Wikipedia edits (fa)
This is the bipartite edit network of the Persian Wikipedia. It contains users
and pages from the Persian Wikipedia, connected by edit events. Each edge
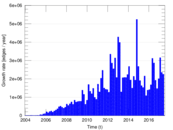
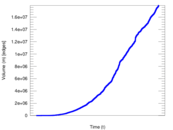
represents an edit. The dataset includes the timestamp of each edit.
Metadata
Statistics
| Size | n = | 3,732,366
|
| Left size | n1 = | 134,986
|
| Right size | n2 = | 3,597,380
|
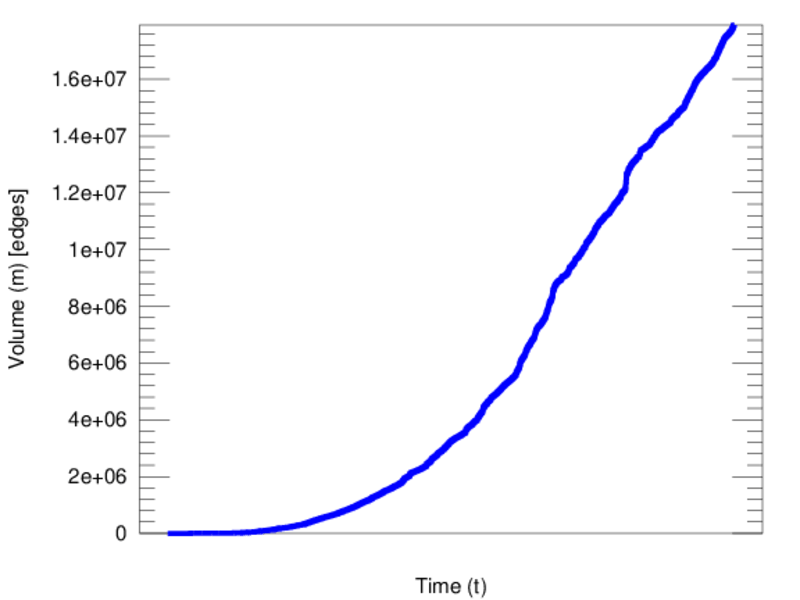
| Volume | m = | 17,908,113
|
| Unique edge count | m̿ = | 10,011,147
|
| Wedge count | s = | 1,620,722,993,804
|
| Claw count | z = | 490,104,680,350,393,408
|
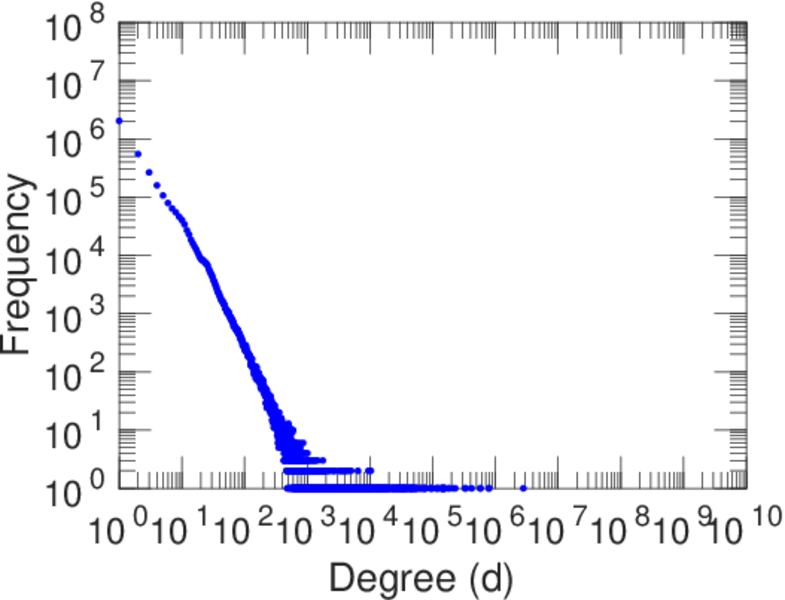
| Maximum degree | dmax = | 2,792,428
|
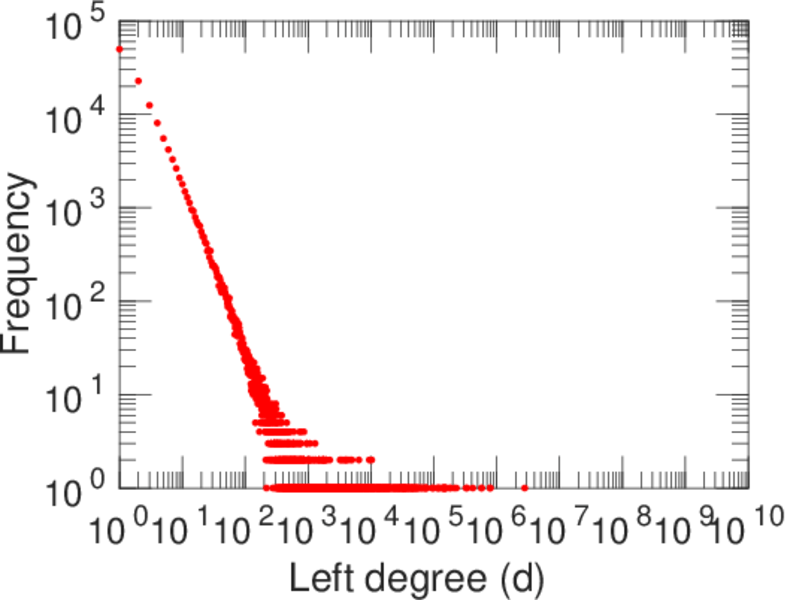
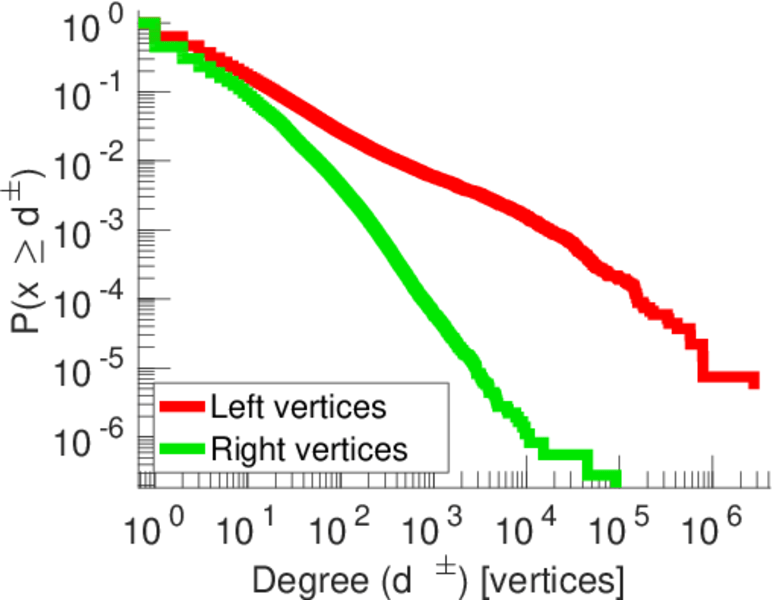
| Maximum left degree | d1max = | 2,792,428
|
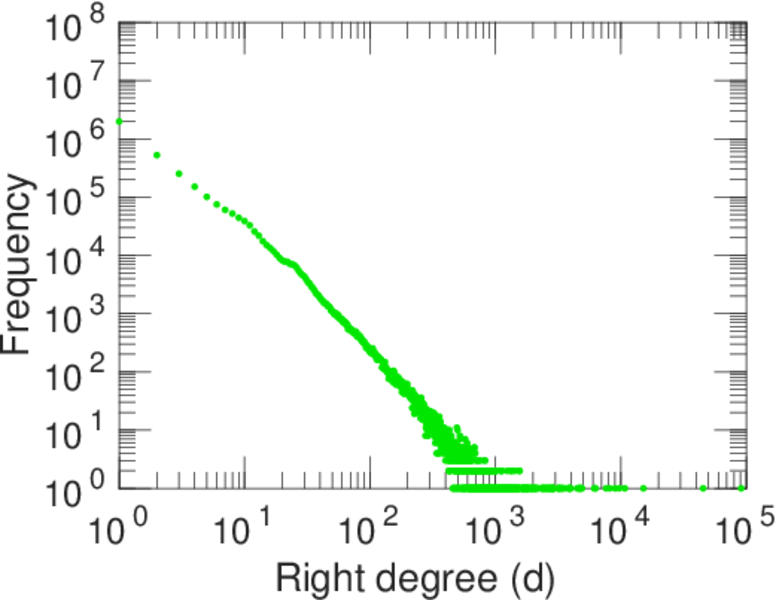
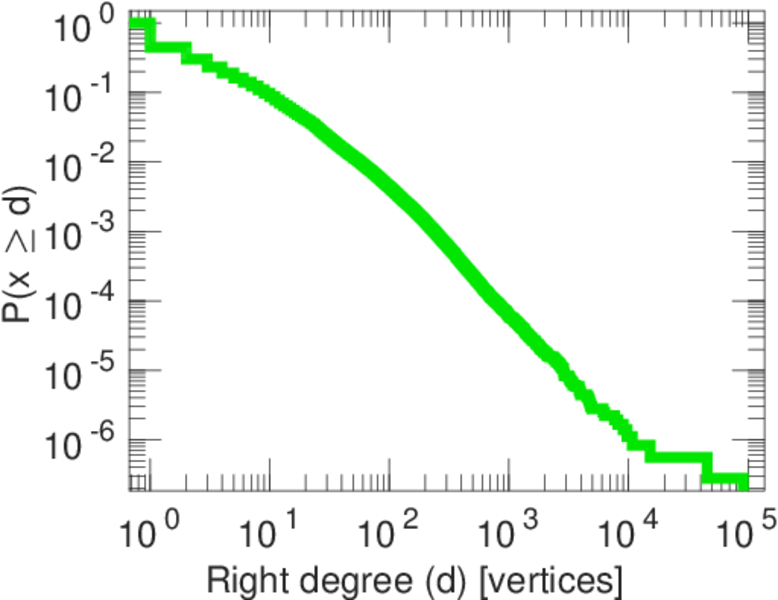
| Maximum right degree | d2max = | 91,121
|
| Average degree | d = | 9.596 12
|
| Average left degree | d1 = | 132.666
|
| Average right degree | d2 = | 4.978 10
|
| Fill | p = | 2.061 62 × 10−5
|
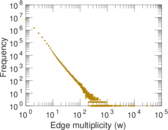
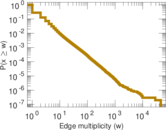
| Average edge multiplicity | m̃ = | 1.788 82
|
| Size of LCC | N = | 3,694,179
|
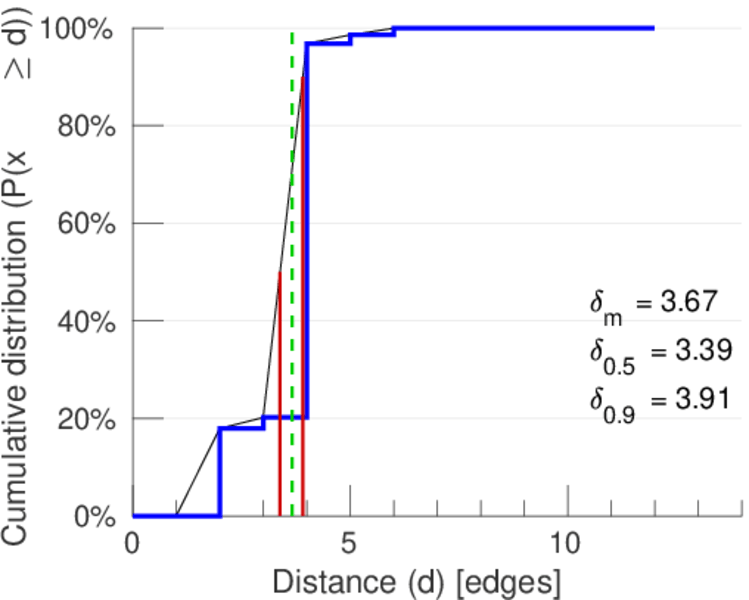
| Diameter | δ = | 12
|
| 50-Percentile effective diameter | δ0.5 = | 3.389 24
|
| 90-Percentile effective diameter | δ0.9 = | 3.911 19
|
| Median distance | δM = | 4
|
| Mean distance | δm = | 3.666 29
|
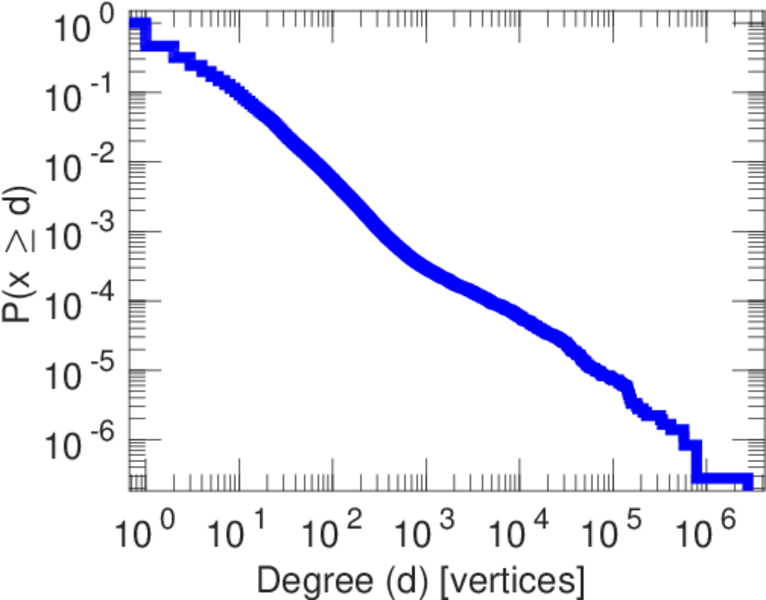
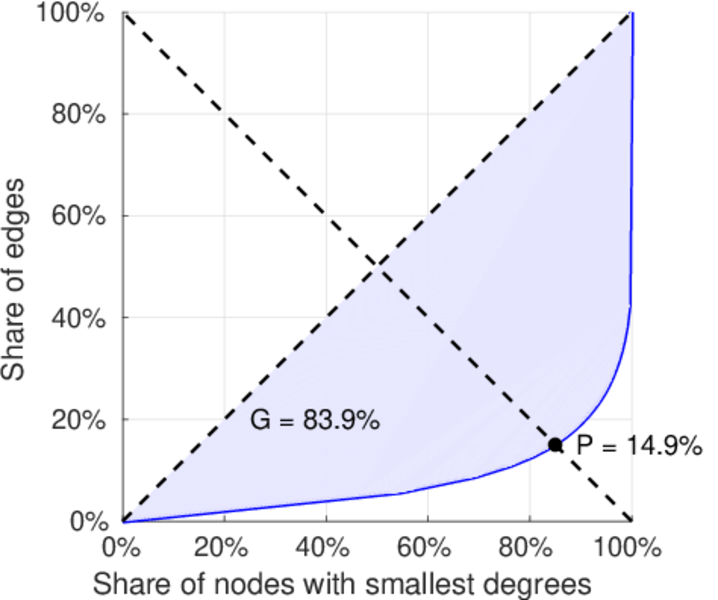
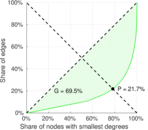
| Gini coefficient | G = | 0.842 152
|
| Balanced inequality ratio | P = | 0.149 788
|
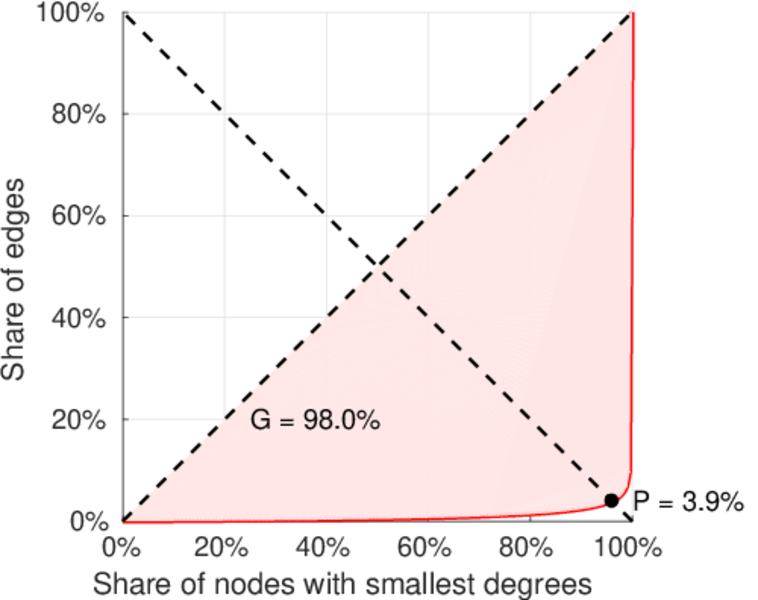
| Left balanced inequality ratio | P1 = | 0.038 987 5
|
| Right balanced inequality ratio | P2 = | 0.217 059
|
| Relative edge distribution entropy | Her = | 0.690 420
|
| Power law exponent | γ = | 2.914 53
|
| Tail power law exponent | γt = | 2.631 00
|
| Tail power law exponent with p | γ3 = | 2.631 00
|
| p-value | p = | 0.000 00
|
| Left tail power law exponent with p | γ3,1 = | 1.951 00
|
| Left p-value | p1 = | 0.000 00
|
| Right tail power law exponent with p | γ3,2 = | 3.601 00
|
| Right p-value | p2 = | 0.000 00
|
| Degree assortativity | ρ = | −0.218 956
|
| Degree assortativity p-value | pρ = | 0.000 00
|
| Spectral norm | α = | 55,050.4
|
| Spectral separation | |λ1[A] / λ2[A]| = | 1.214 06
|
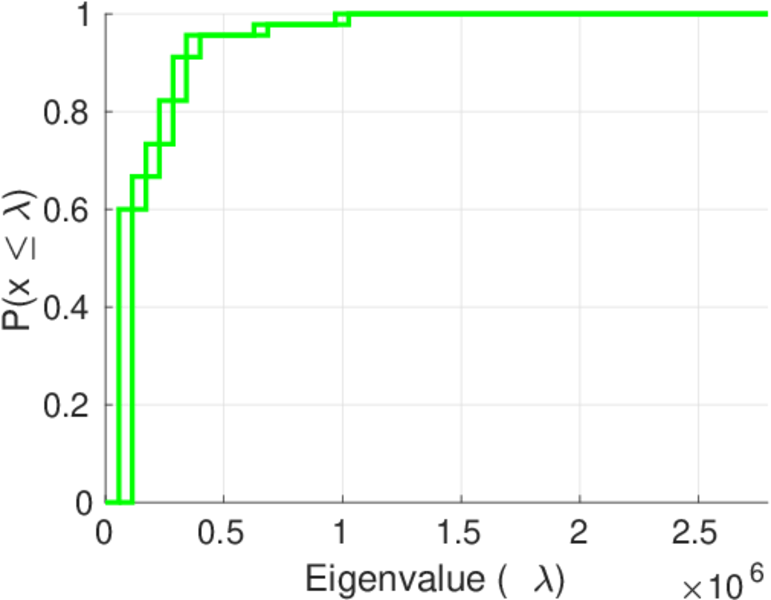
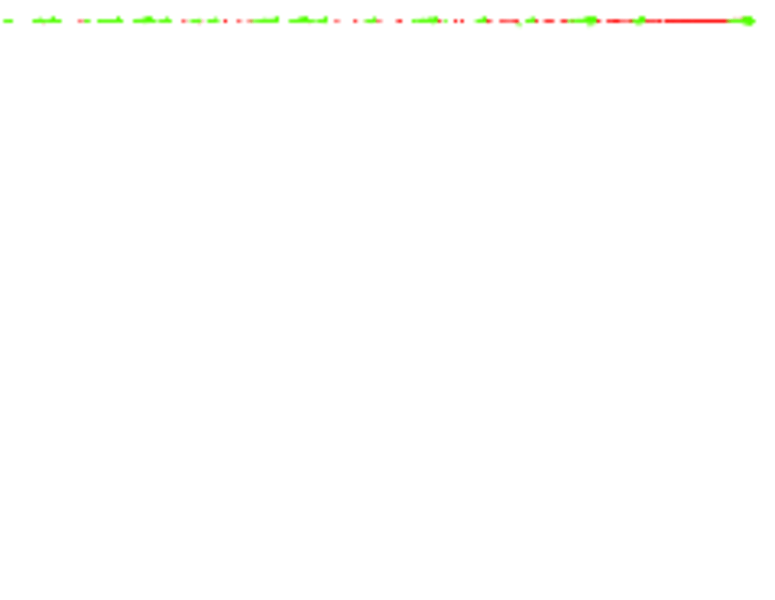
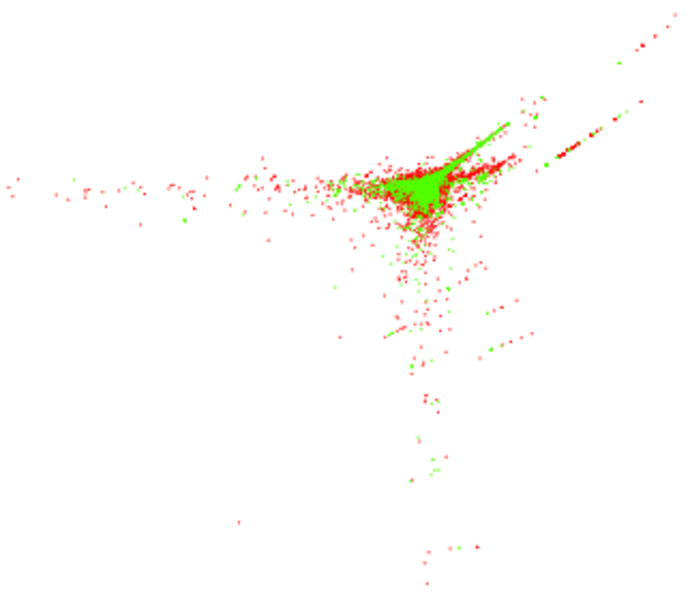
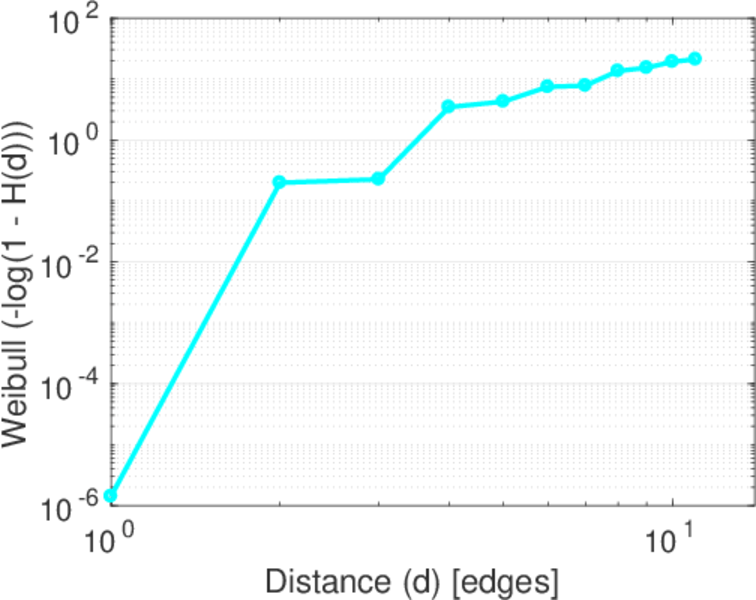
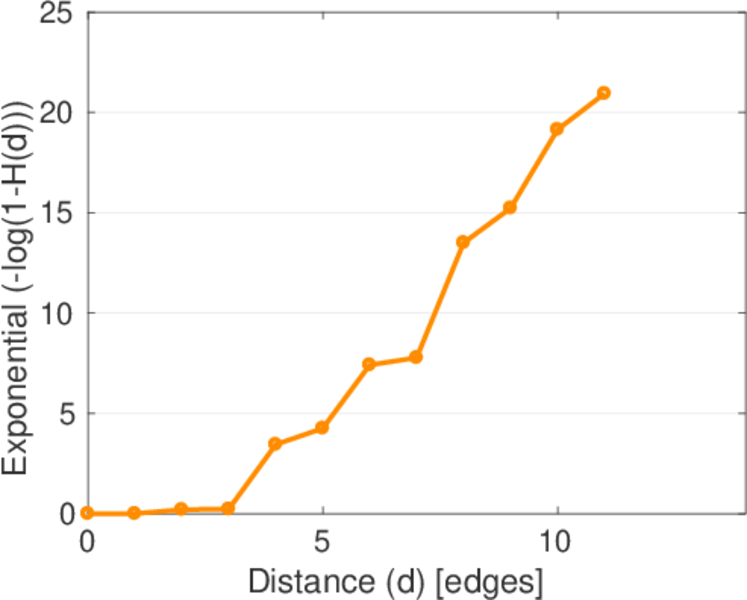
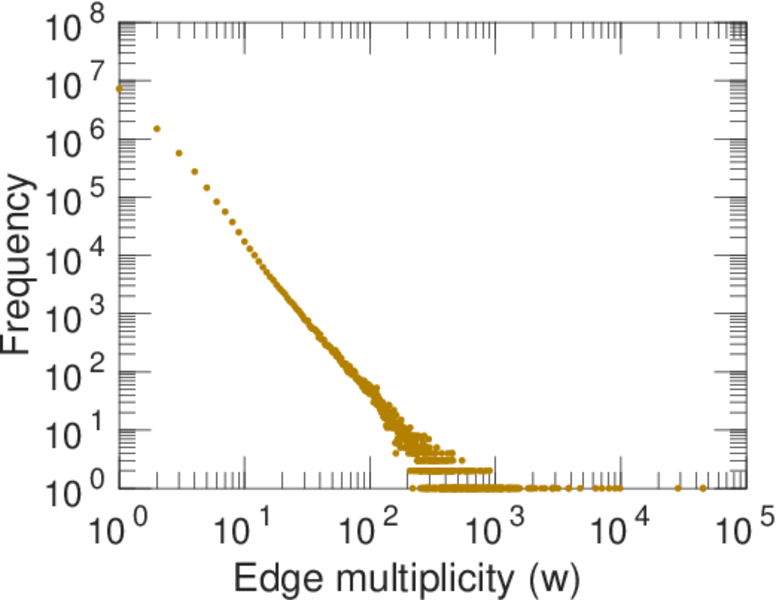
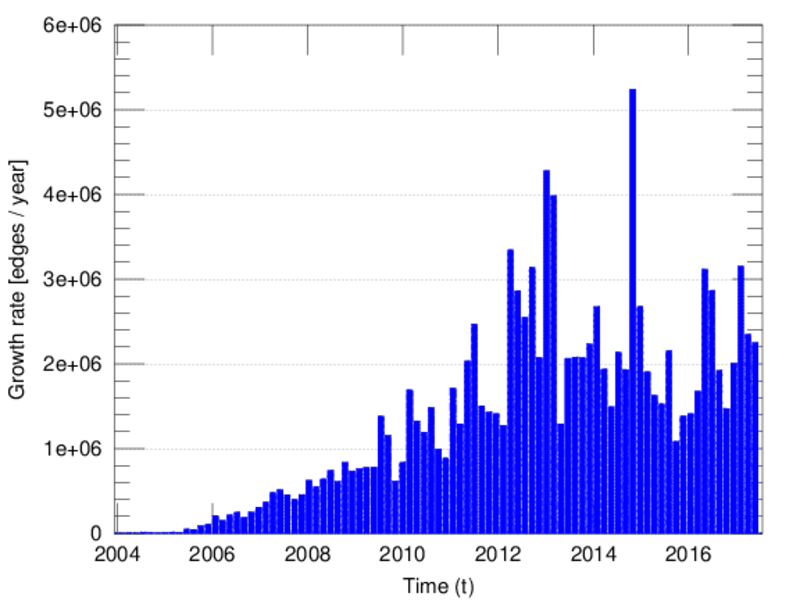
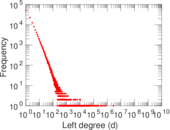
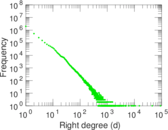
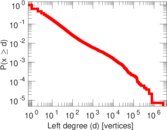
Plots


Downloads
References
|
[1]
|
Jérôme Kunegis.
KONECT – The Koblenz Network Collection.
In Proc. Int. Conf. on World Wide Web Companion, pages
1343–1350, 2013.
[ http ]
|
|
[2]
|
Wikimedia Foundation.
Wikimedia downloads.
http://dumps.wikimedia.org/, January 2010.
|
 KONECT ‣ Networks ‣
Buy Me a Coffee
KONECT ‣ Networks ‣
Buy Me a Coffee