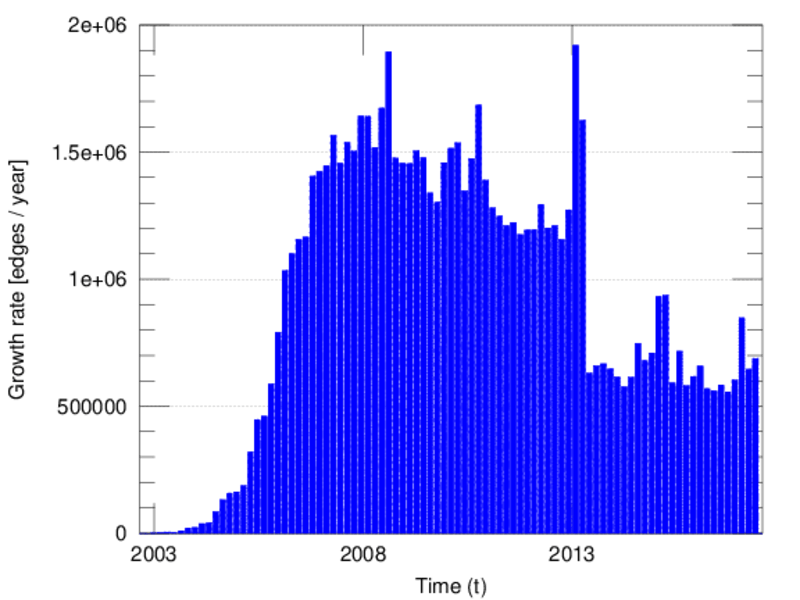
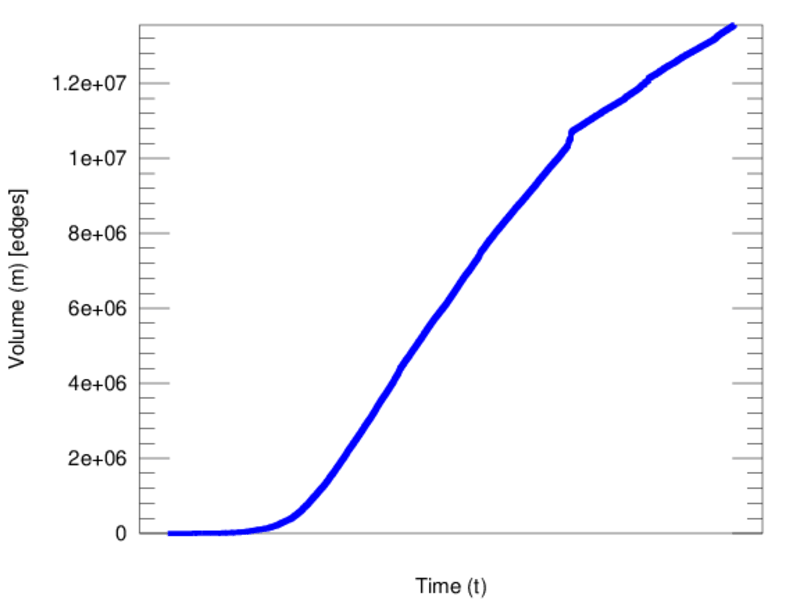
Wikipedia edits (fi)
This is the bipartite edit network of the Finnish Wikipedia. It contains users
and pages from the Finnish Wikipedia, connected by edit events. Each edge
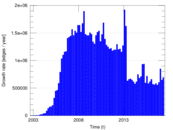
represents an edit. The dataset includes the timestamp of each edit.
Metadata
Statistics
| Size | n = | 1,225,701
|
| Left size | n1 = | 95,247
|
| Right size | n2 = | 1,130,454
|
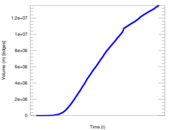
| Volume | m = | 13,557,662
|
| Unique edge count | m̿ = | 7,244,336
|
| Wedge count | s = | 138,925,451,717
|
| Claw count | z = | 5,570,543,420,165,483
|
| Cross count | x = | 2.694 14 × 1020
|
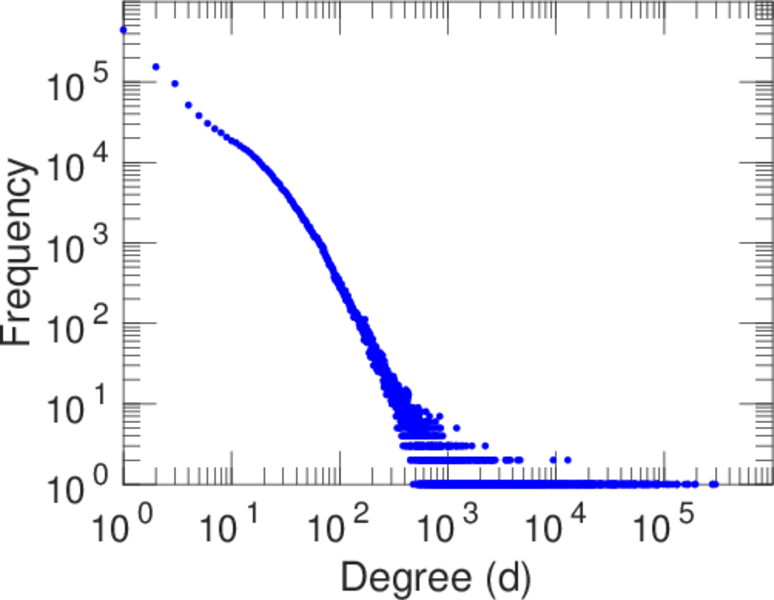
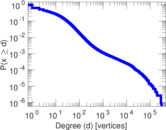
| Maximum degree | dmax = | 297,040
|
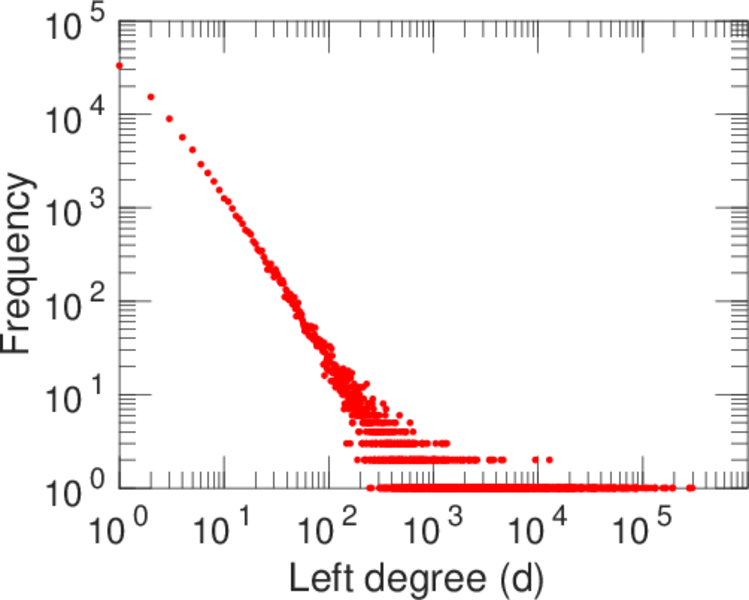
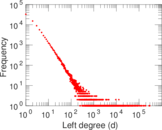
| Maximum left degree | d1max = | 297,040
|
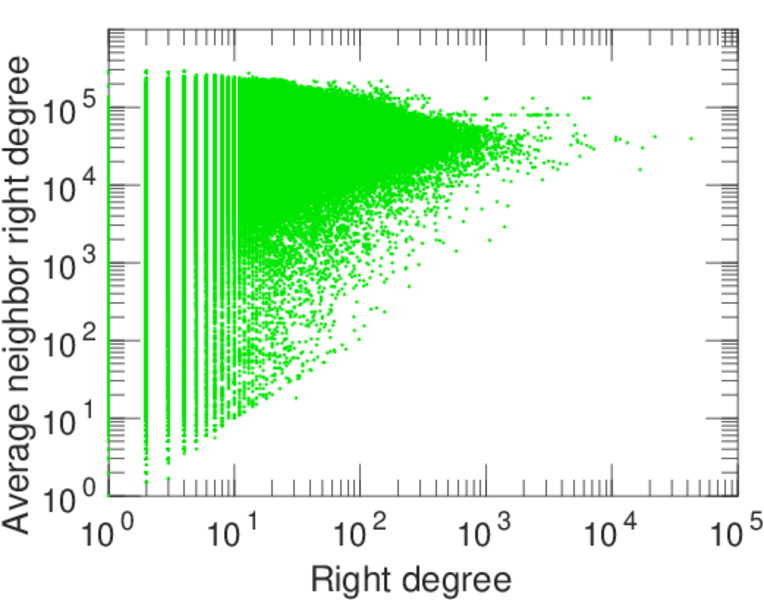
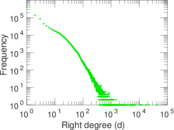
| Maximum right degree | d2max = | 42,856
|
| Average degree | d = | 22.122 3
|
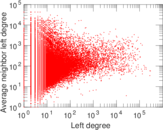
| Average left degree | d1 = | 142.342
|
| Average right degree | d2 = | 11.993 1
|
| Average edge multiplicity | m̃ = | 1.871 48
|
| Size of LCC | N = | 1,201,778
|
| Diameter | δ = | 12
|
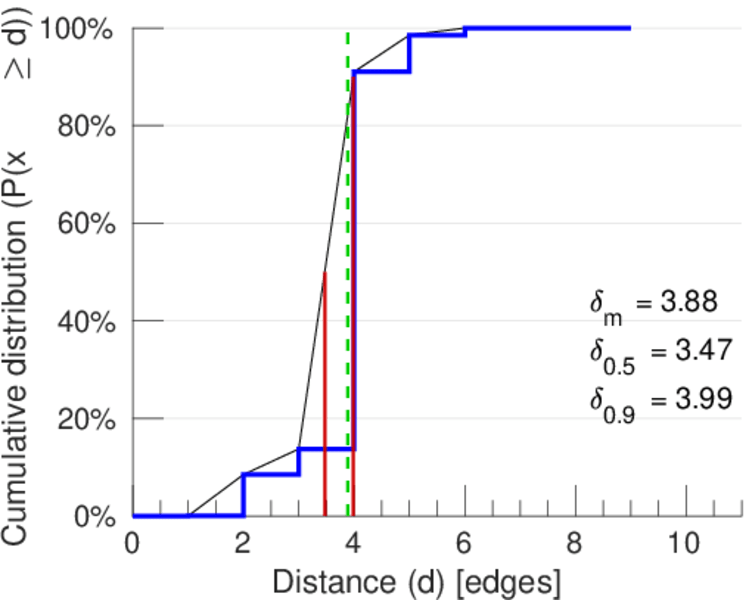
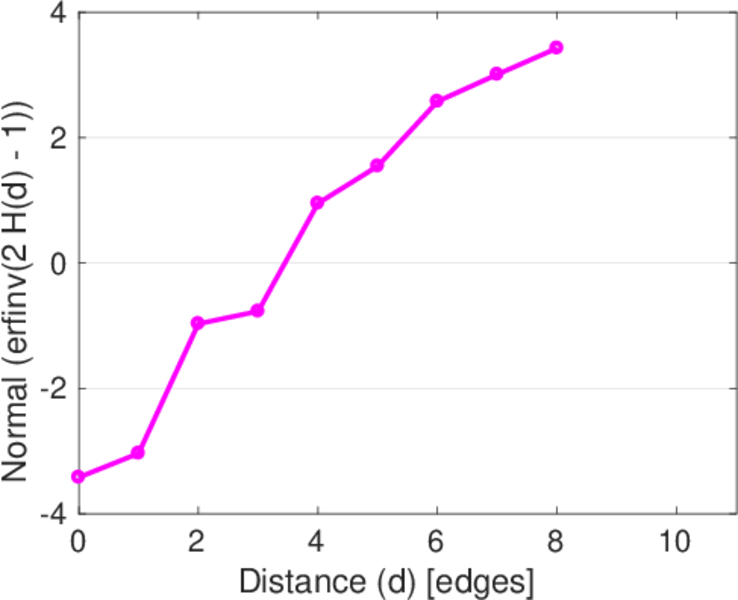
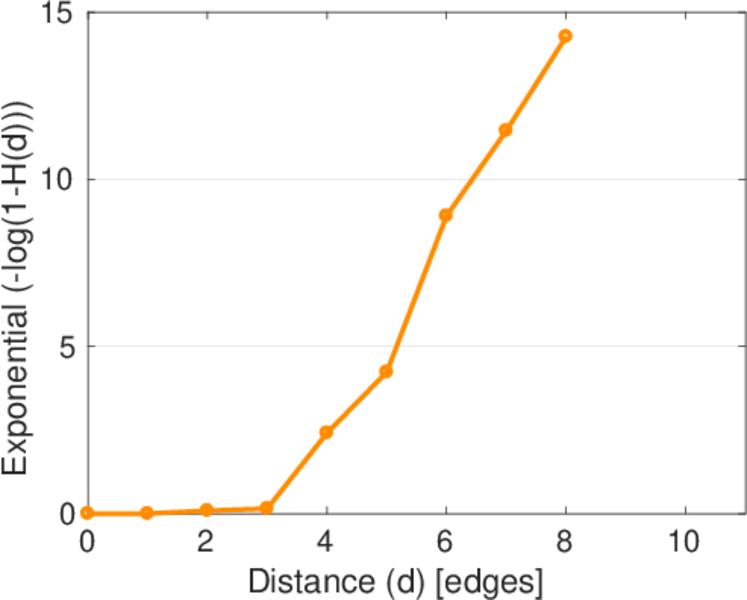
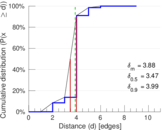
| 50-Percentile effective diameter | δ0.5 = | 3.469 23
|
| 90-Percentile effective diameter | δ0.9 = | 3.986 69
|
| Median distance | δM = | 4
|
| Mean distance | δm = | 3.882 39
|
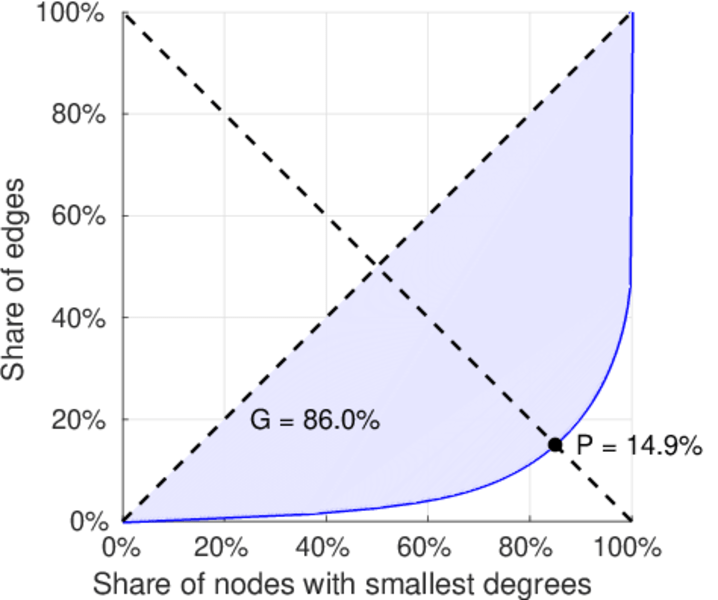
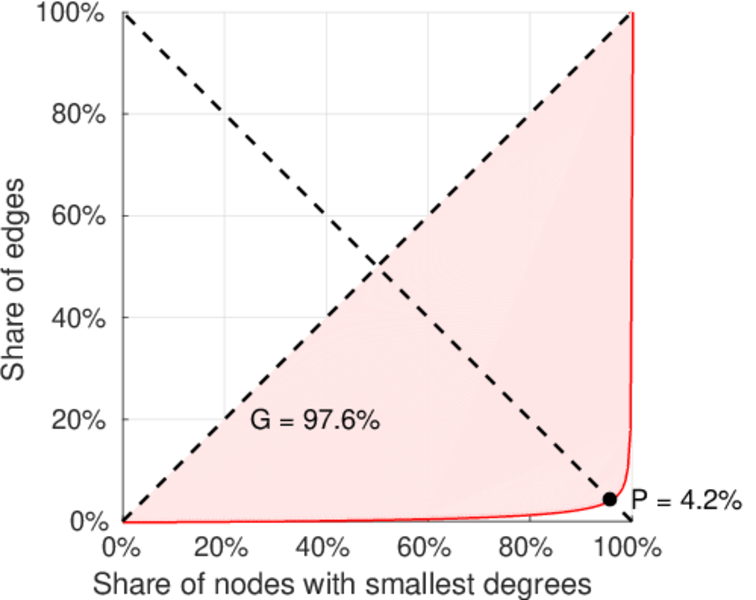
| Balanced inequality ratio | P = | 0.147 164
|
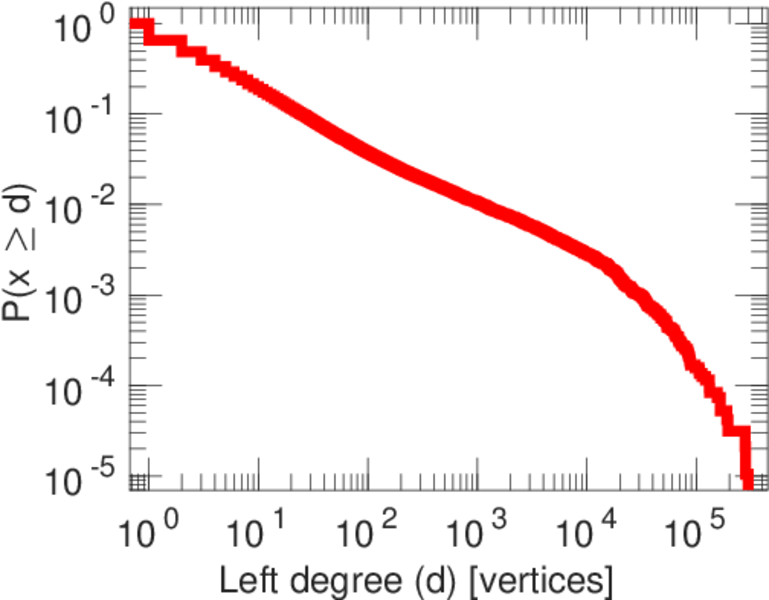
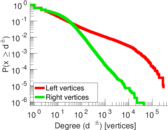
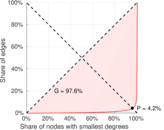
| Left balanced inequality ratio | P1 = | 0.041 677 6
|
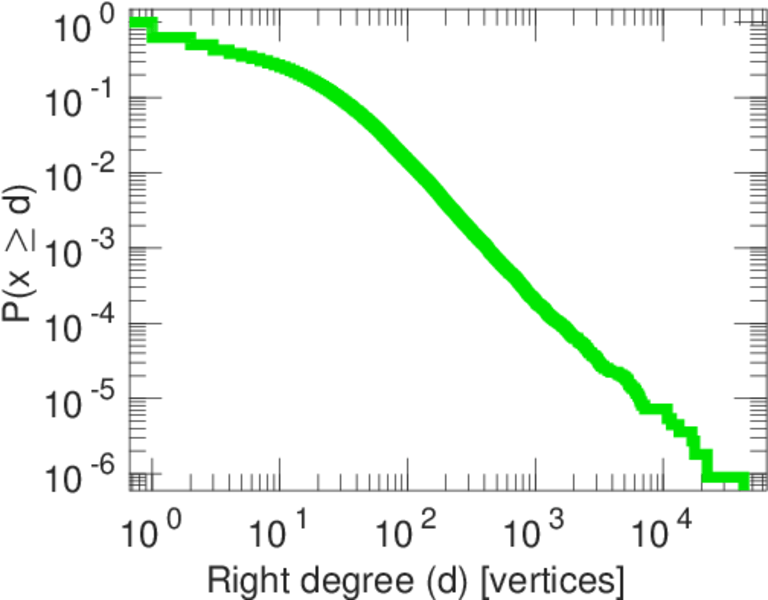
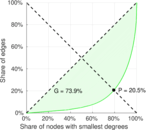
| Right balanced inequality ratio | P2 = | 0.205 435
|
| Relative edge distribution entropy | Her = | 0.747 591
|
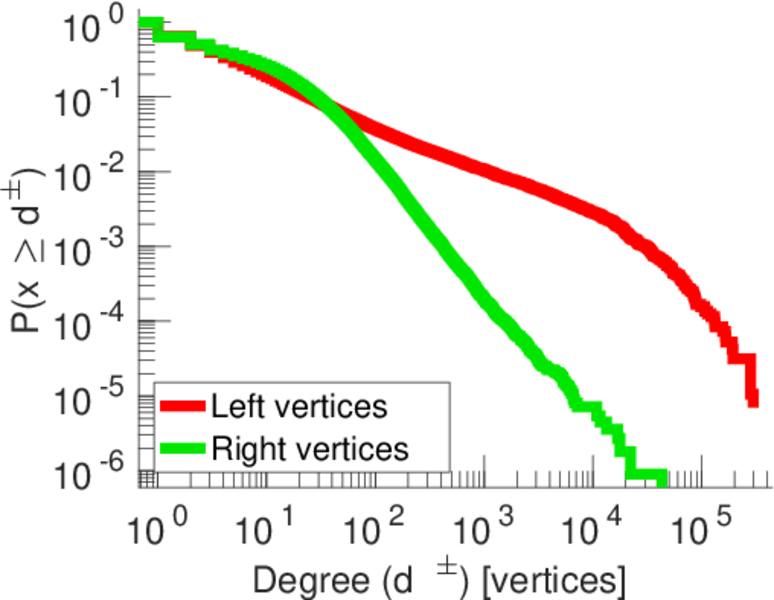
| Tail power law exponent | γt = | 2.761 00
|
| Tail power law exponent with p | γ3 = | 2.761 00
|
| p-value | p = | 0.000 00
|
| Left tail power law exponent with p | γ3,1 = | 1.801 00
|
| Left p-value | p1 = | 0.000 00
|
| Right tail power law exponent with p | γ3,2 = | 3.451 00
|
| Right p-value | p2 = | 0.000 00
|
| Degree assortativity | ρ = | −0.073 987 3
|
| Degree assortativity p-value | pρ = | 0.000 00
|
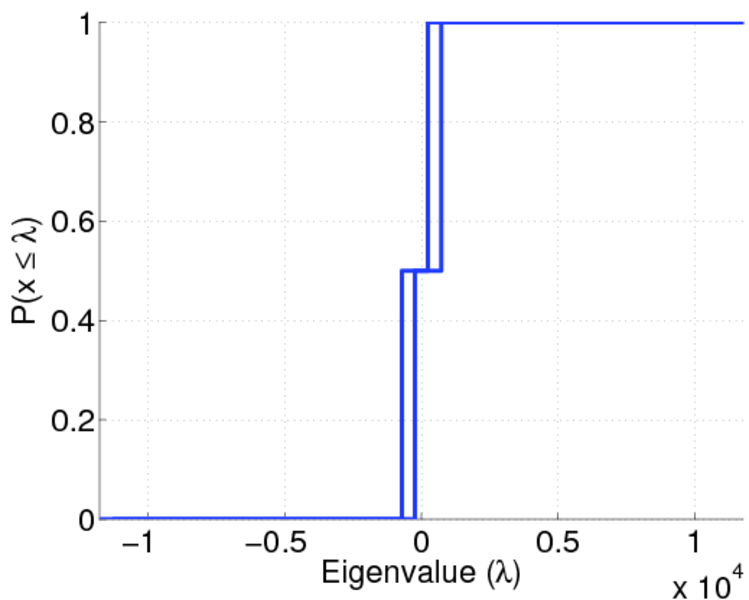
| Spectral norm | α = | 11,795.3
|
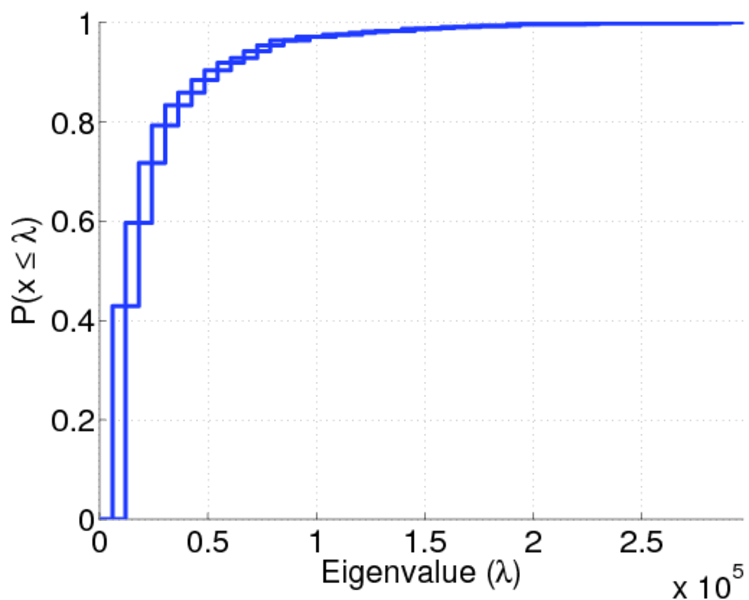
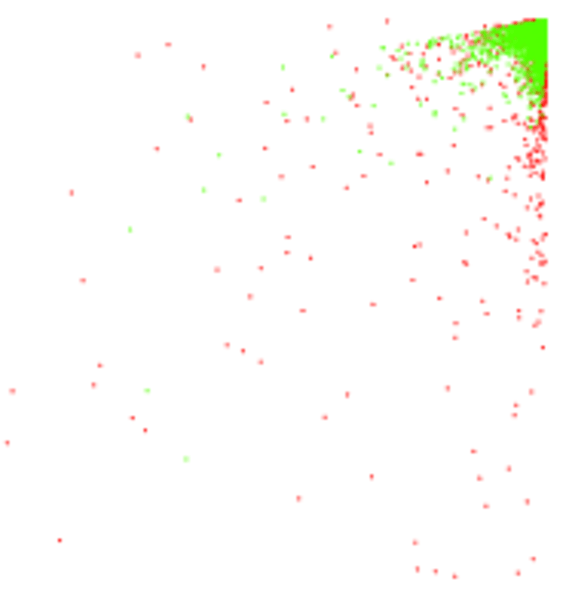
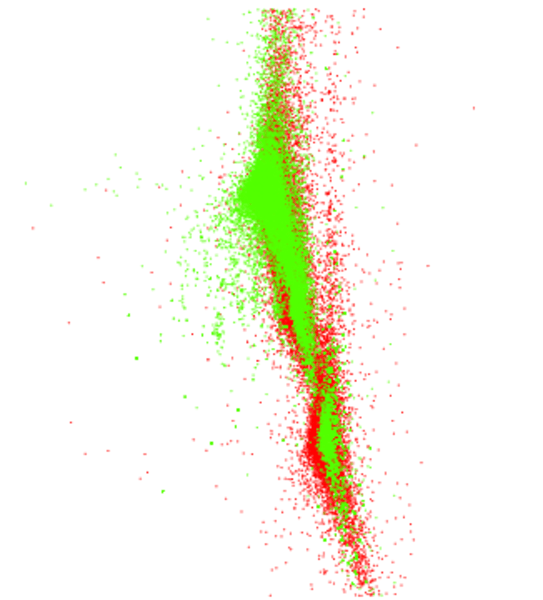
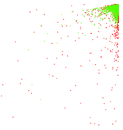
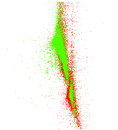
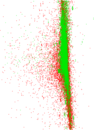
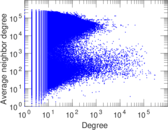
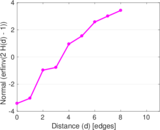
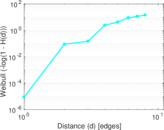
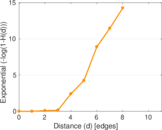
Plots


Downloads
References
|
[1]
|
Jérôme Kunegis.
KONECT – The Koblenz Network Collection.
In Proc. Int. Conf. on World Wide Web Companion, pages
1343–1350, 2013.
[ http ]
|
|
[2]
|
Wikimedia Foundation.
Wikimedia downloads.
http://dumps.wikimedia.org/, January 2010.
|
 KONECT ‣ Networks ‣
Buy Me a Coffee
KONECT ‣ Networks ‣
Buy Me a Coffee