Wikiquote edits (fr)
This is the bipartite edit network of the French Wikisource. It contains users
and pages from the French Wikisource, connected by edit events. Each edge
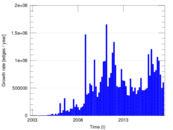
represents an edit. The dataset includes the timestamp of each edit.
Metadata
Statistics
| Size | n = | 2,409,110
|
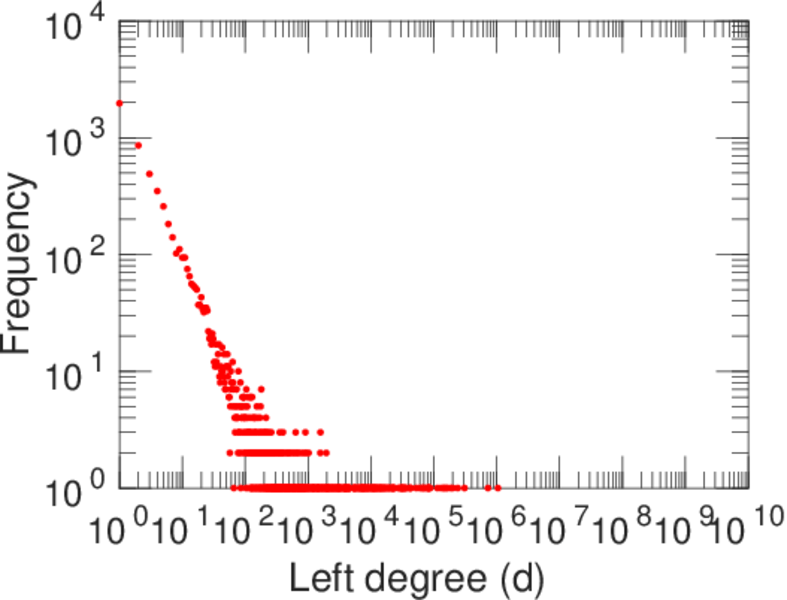
| Left size | n1 = | 6,666
|
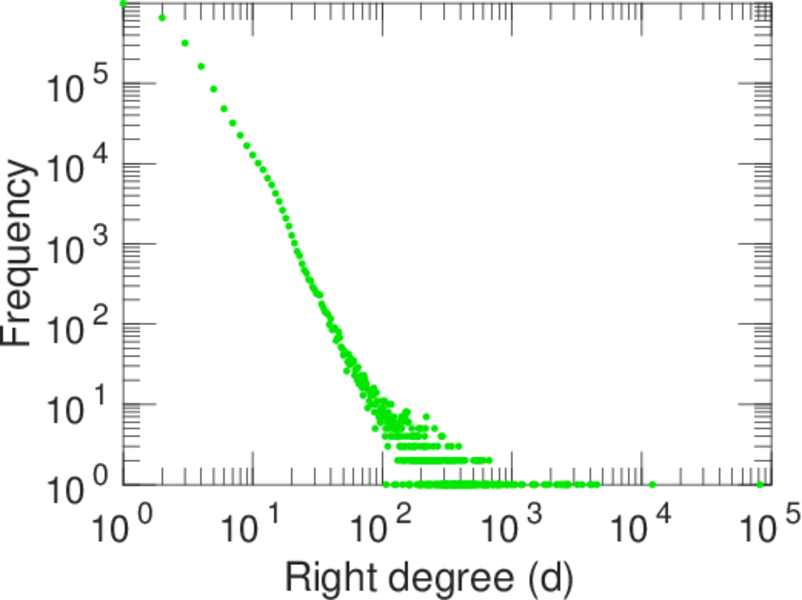
| Right size | n2 = | 2,402,444
|
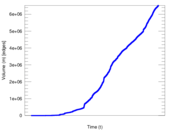
| Volume | m = | 6,523,303
|
| Unique edge count | m̿ = | 4,408,423
|
| Wedge count | s = | 598,369,968,318
|
| Claw count | z = | 128,490,679,133,637,056
|
| Cross count | x = | 2.385 79 × 1022
|
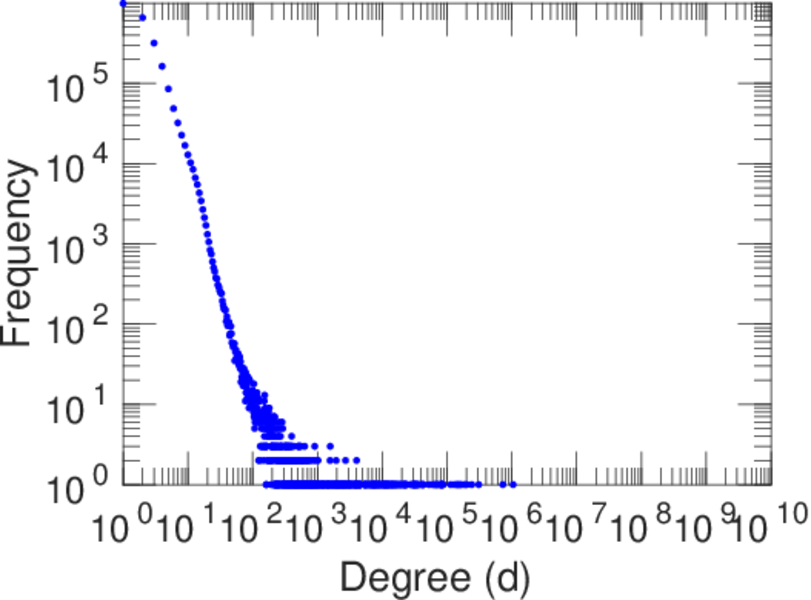
| Maximum degree | dmax = | 1,045,775
|
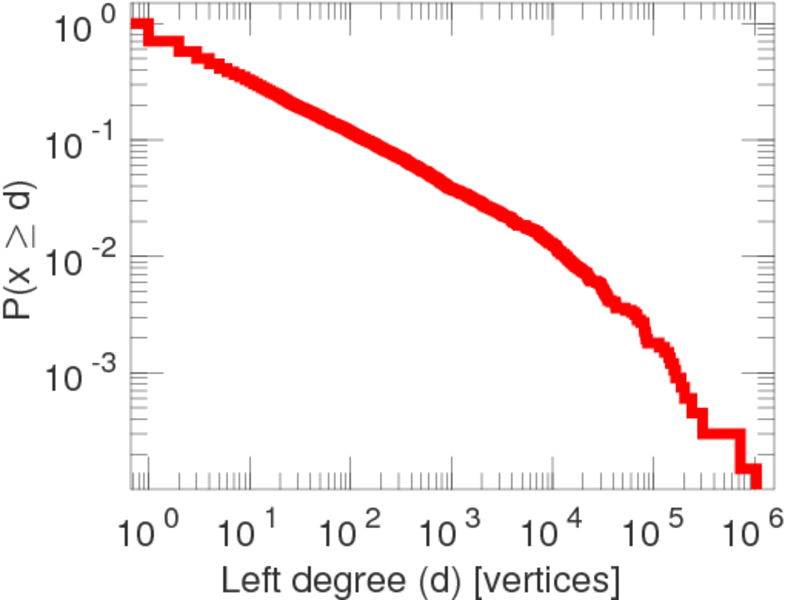
| Maximum left degree | d1max = | 1,045,775
|
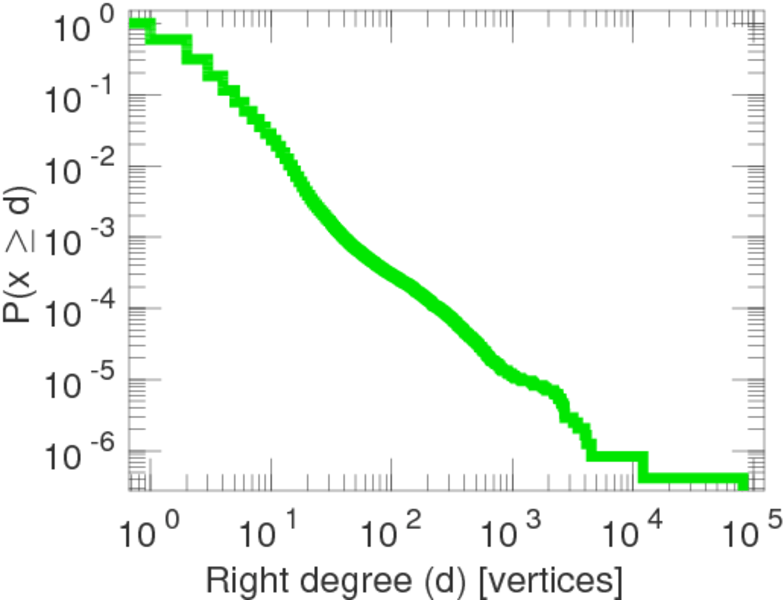
| Maximum right degree | d2max = | 81,620
|
| Average degree | d = | 5.415 53
|
| Average left degree | d1 = | 978.593
|
| Average right degree | d2 = | 2.715 28
|
| Fill | p = | 0.000 275 274
|
| Average edge multiplicity | m̃ = | 1.479 74
|
| Size of LCC | N = | 2,401,362
|
| Diameter | δ = | 12
|
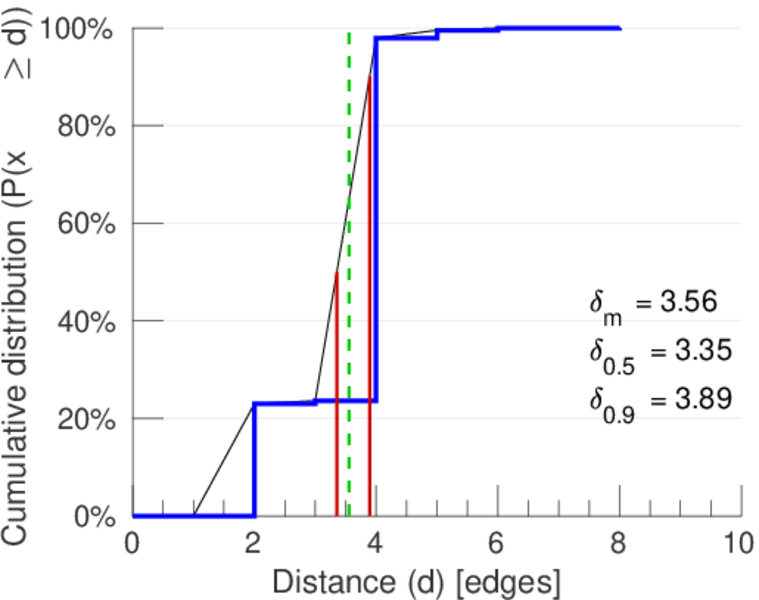
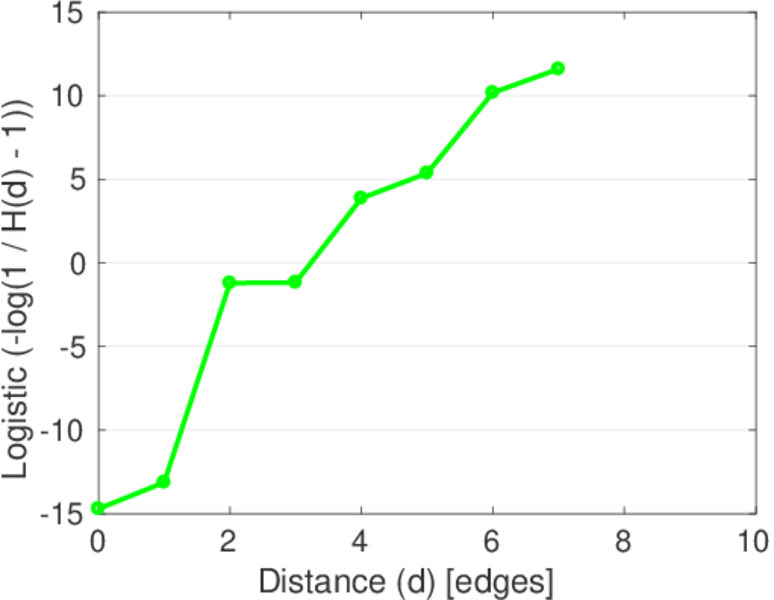
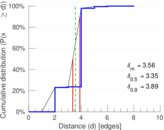
| 50-Percentile effective diameter | δ0.5 = | 3.354 93
|
| 90-Percentile effective diameter | δ0.9 = | 3.893 11
|
| Median distance | δM = | 4
|
| Mean distance | δm = | 3.559 23
|
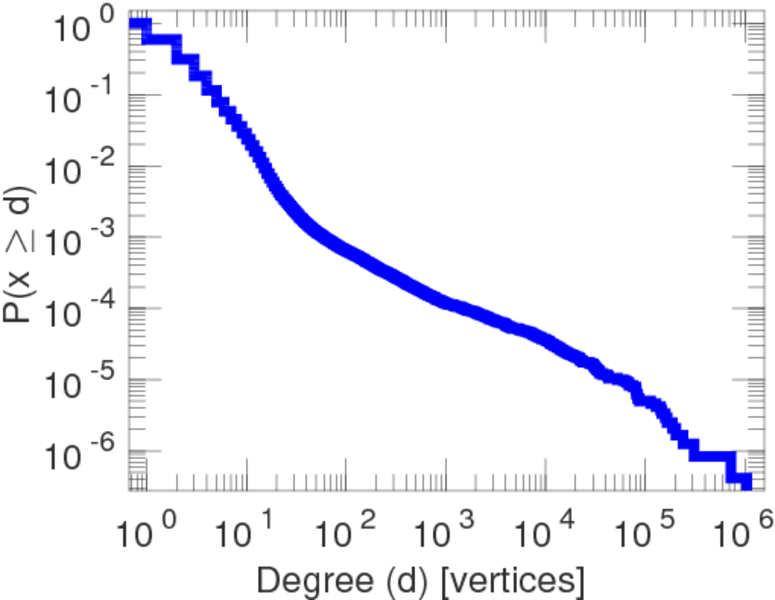
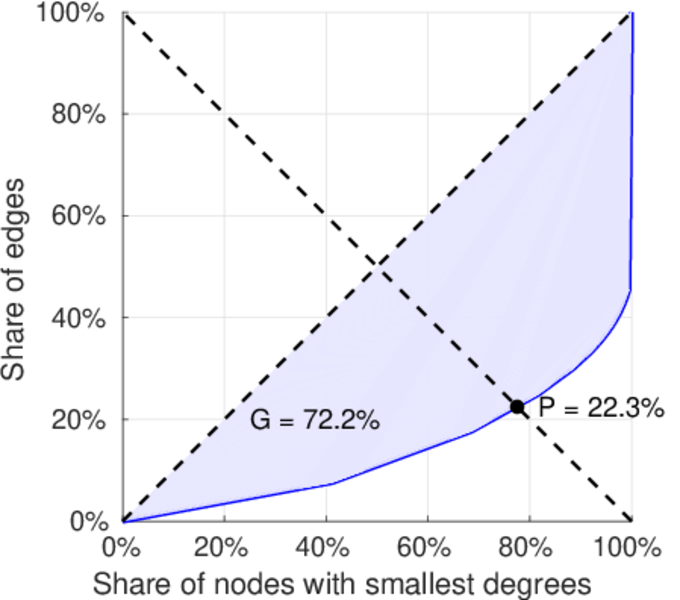
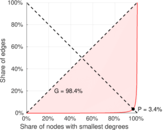
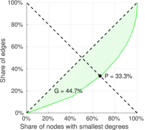
| Gini coefficient | G = | 0.723 523
|
| Balanced inequality ratio | P = | 0.222 478
|
| Left balanced inequality ratio | P1 = | 0.033 822 1
|
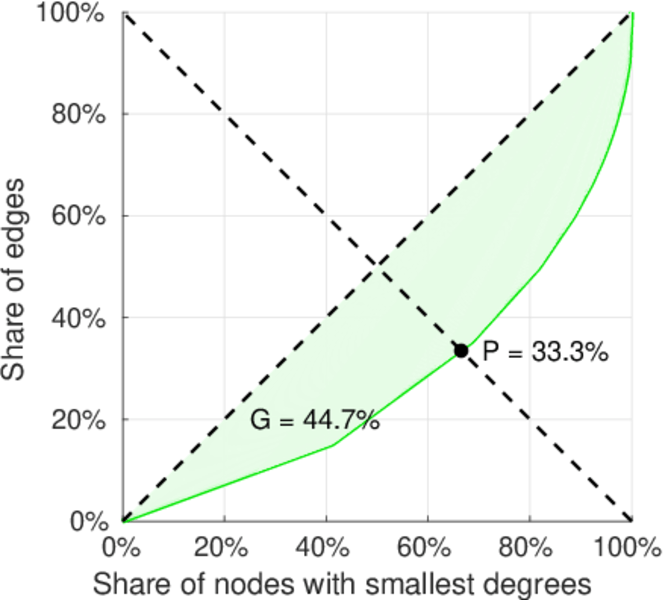
| Right balanced inequality ratio | P2 = | 0.333 365
|
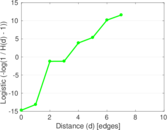
| Power law exponent | γ = | 3.178 21
|
| Tail power law exponent | γt = | 1.501 00
|
| Degree assortativity | ρ = | −0.076 975 9
|
| Degree assortativity p-value | pρ = | 0.000 00
|
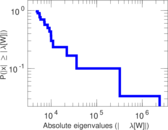
| Spectral norm | α = | 80,334.6
|
| Algebraic connectivity | a = | 0.010 063 3
|
| Spectral separation | |λ1[A] / λ2[A]| = | 8.899 49
|
| Controllability | C = | 2,390,532
|
| Relative controllability | Cr = | 0.995 046
|
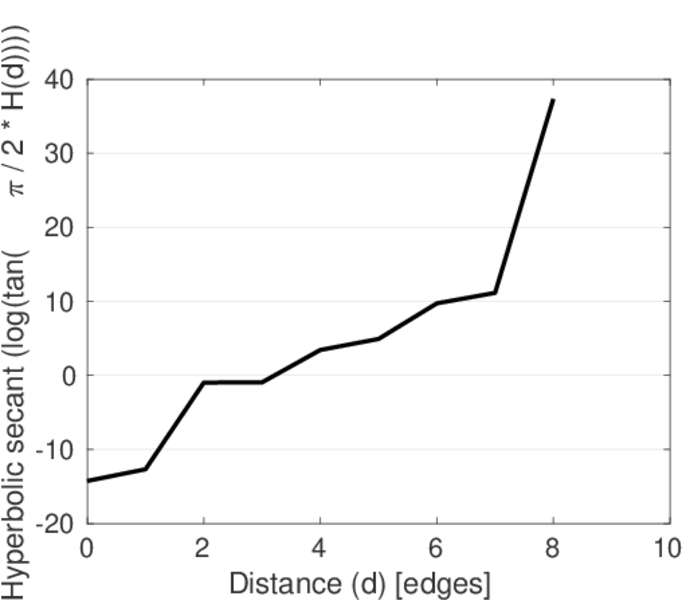
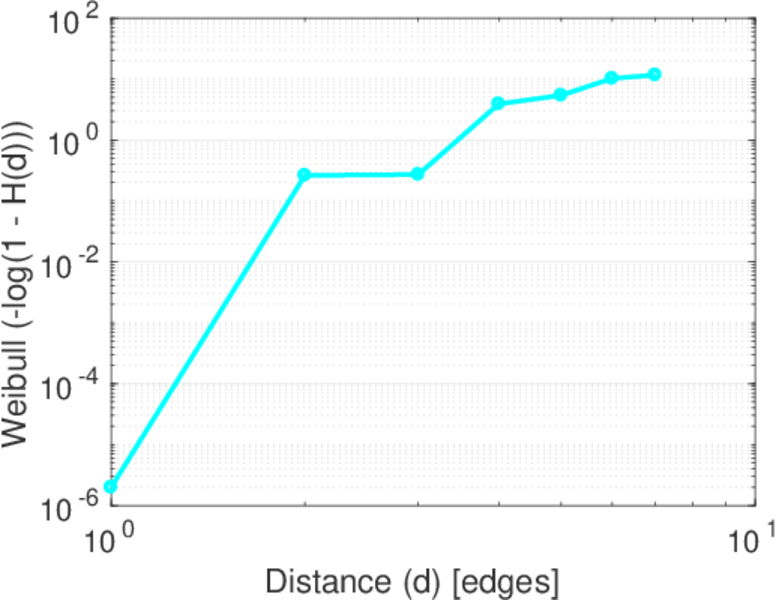
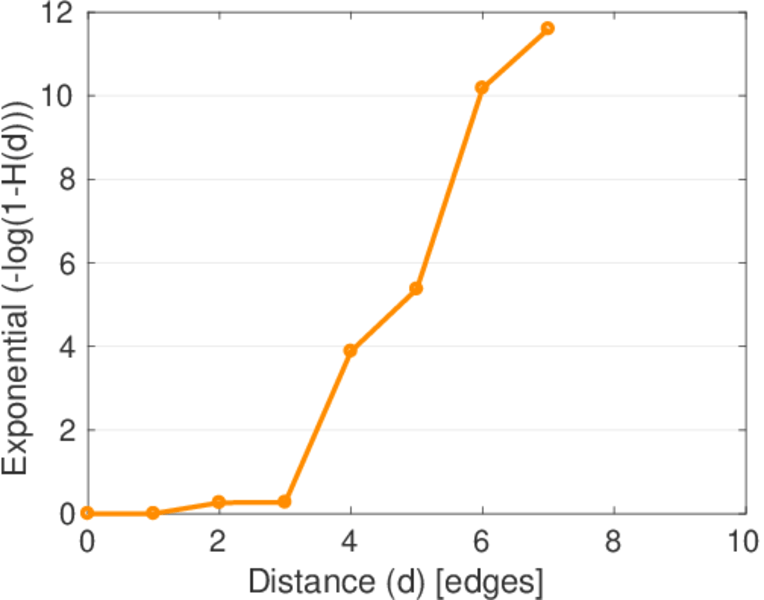
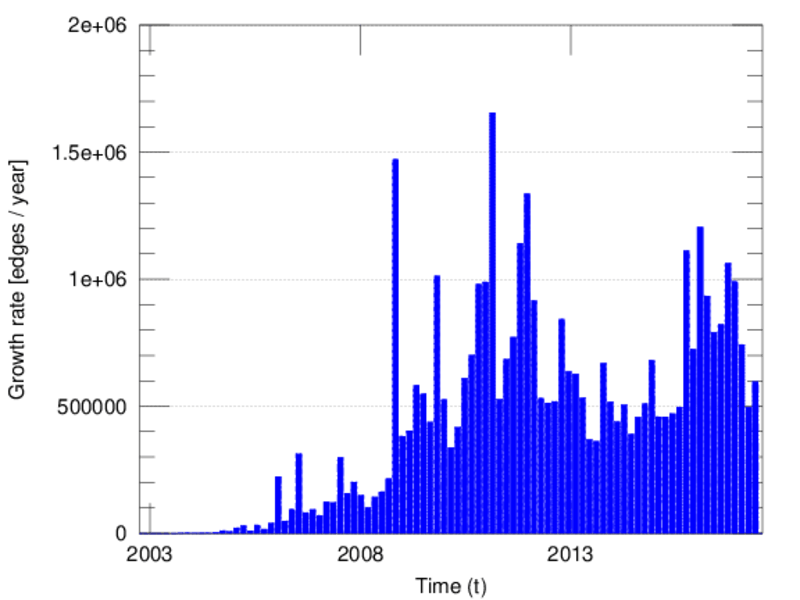
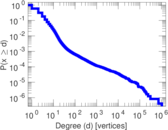
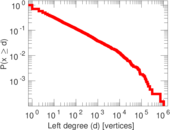
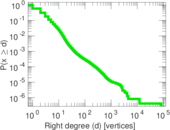
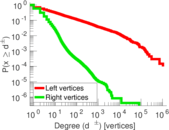
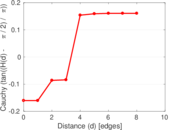
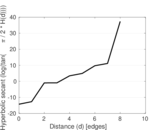
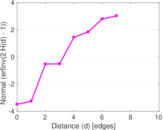
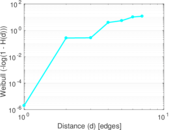
Plots


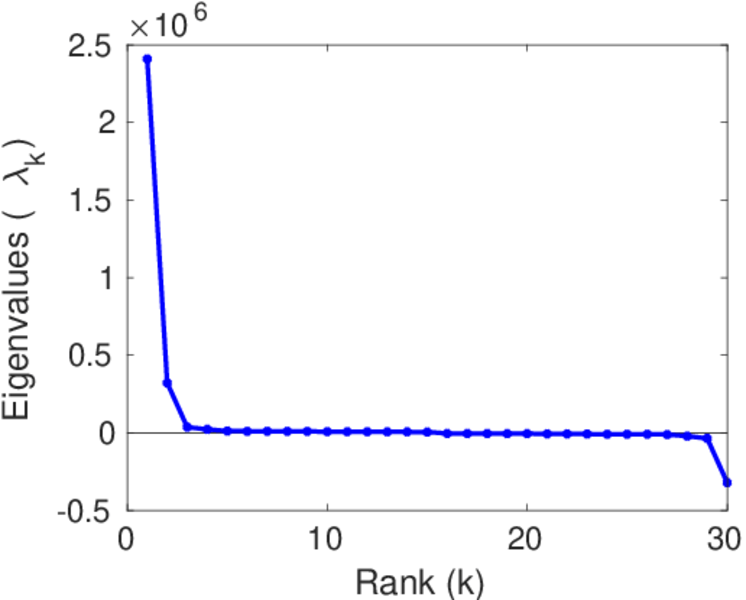
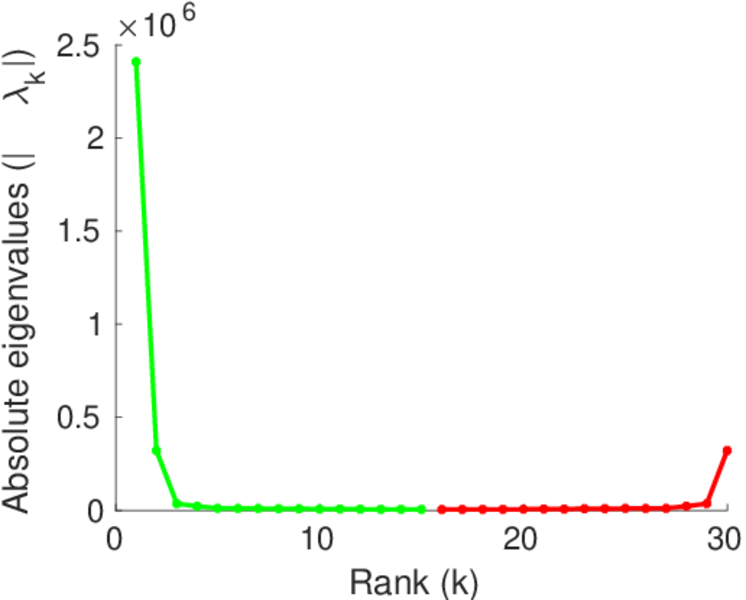
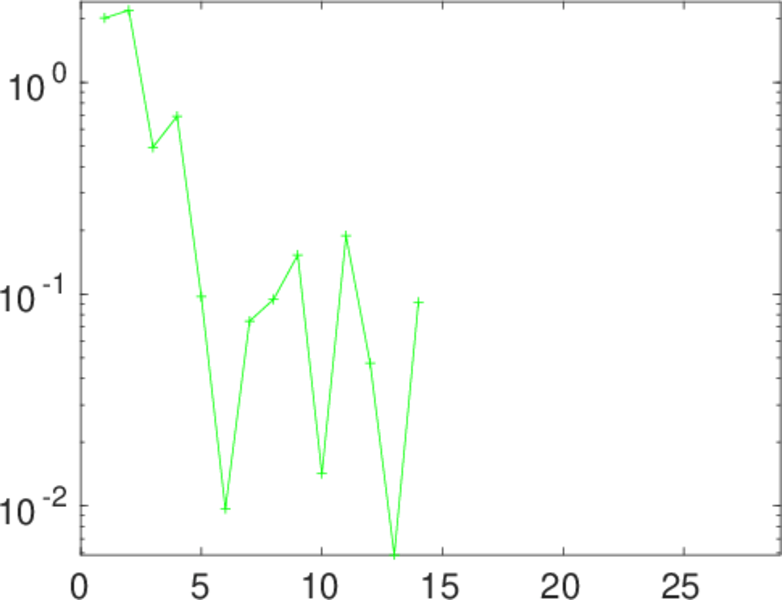
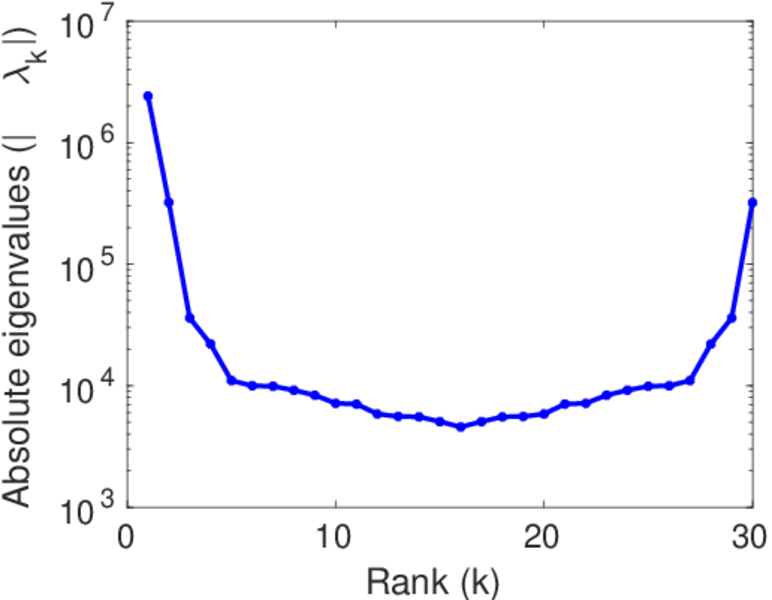
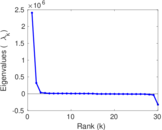
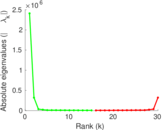
Matrix decompositions plots


Downloads
References
|
[1]
|
Jérôme Kunegis.
KONECT – The Koblenz Network Collection.
In Proc. Int. Conf. on World Wide Web Companion, pages
1343–1350, 2013.
[ http ]
|
|
[2]
|
Wikimedia Foundation.
Wikimedia downloads.
http://dumps.wikimedia.org/, January 2010.
|
 KONECT ‣ Networks ‣
Buy Me a Coffee
KONECT ‣ Networks ‣
Buy Me a Coffee