Wikipedia edits (he)
This is the bipartite edit network of the Hebrew Wikipedia. It contains users
and pages from the Hebrew Wikipedia, connected by edit events. Each edge
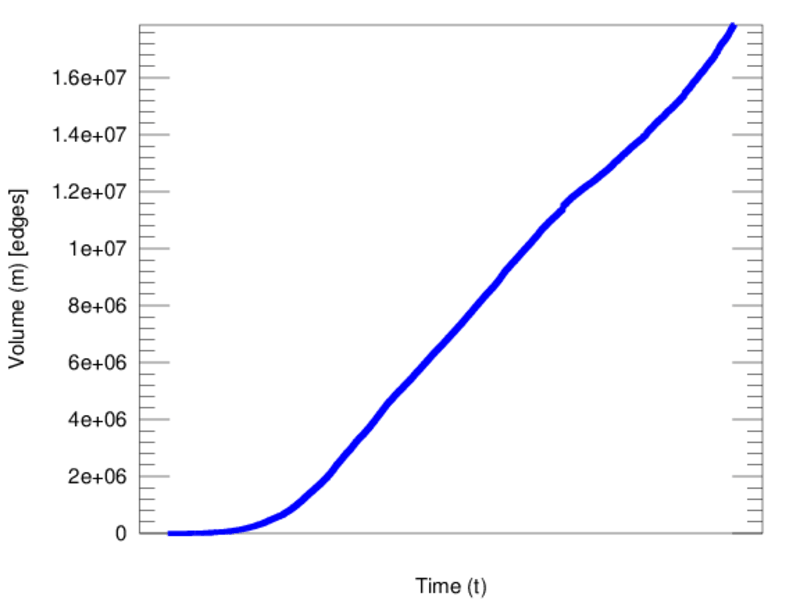
represents an edit. The dataset includes the timestamp of each edit.
Metadata
Statistics
| Size | n = | 991,424
|
| Left size | n1 = | 98,906
|
| Right size | n2 = | 892,518
|
| Volume | m = | 17,853,031
|
| Unique edge count | m̿ = | 6,902,392
|
| Wedge count | s = | 108,416,665,639
|
| Claw count | z = | 3,327,495,343,948,276
|
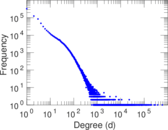
| Maximum degree | dmax = | 593,849
|
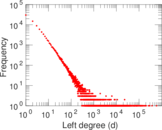
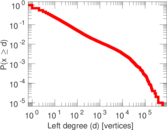
| Maximum left degree | d1max = | 593,849
|
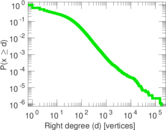
| Maximum right degree | d2max = | 174,328
|
| Average degree | d = | 36.014 9
|
| Average left degree | d1 = | 180.505
|
| Average right degree | d2 = | 20.003 0
|
| Fill | p = | 7.819 16 × 10−5
|
| Average edge multiplicity | m̃ = | 2.586 50
|
| Size of LCC | N = | 969,794
|
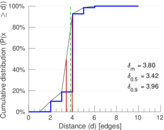
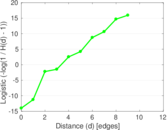
| Diameter | δ = | 13
|
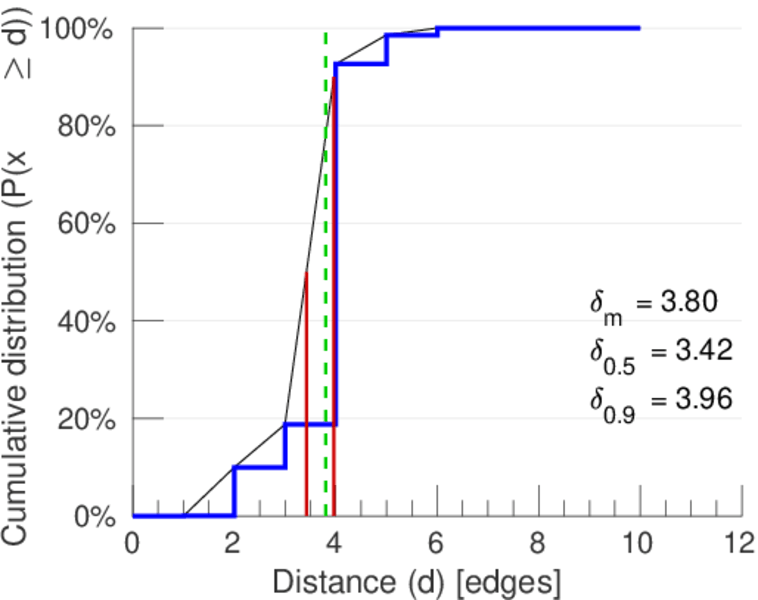
| 50-Percentile effective diameter | δ0.5 = | 3.423 04
|
| 90-Percentile effective diameter | δ0.9 = | 3.964 71
|
| Median distance | δM = | 4
|
| Mean distance | δm = | 3.801 35
|
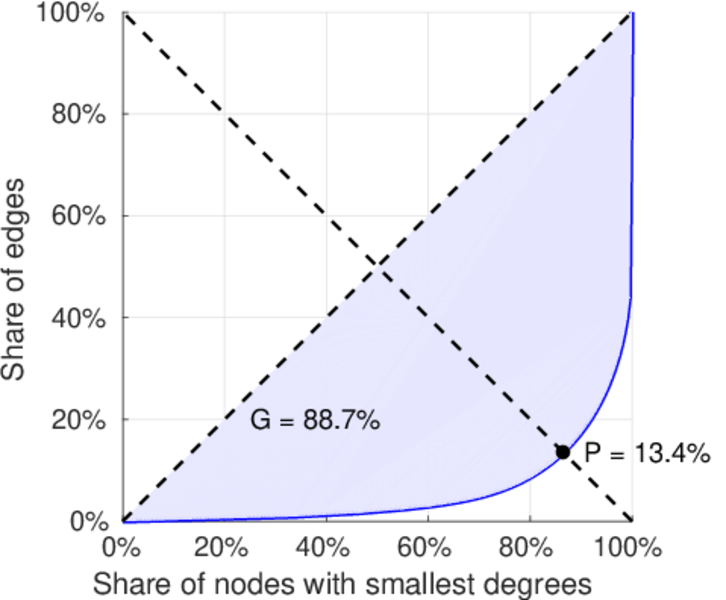
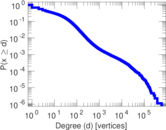
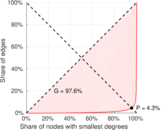
| Gini coefficient | G = | 0.888 272
|
| Balanced inequality ratio | P = | 0.134 970
|
| Left balanced inequality ratio | P1 = | 0.043 334 5
|
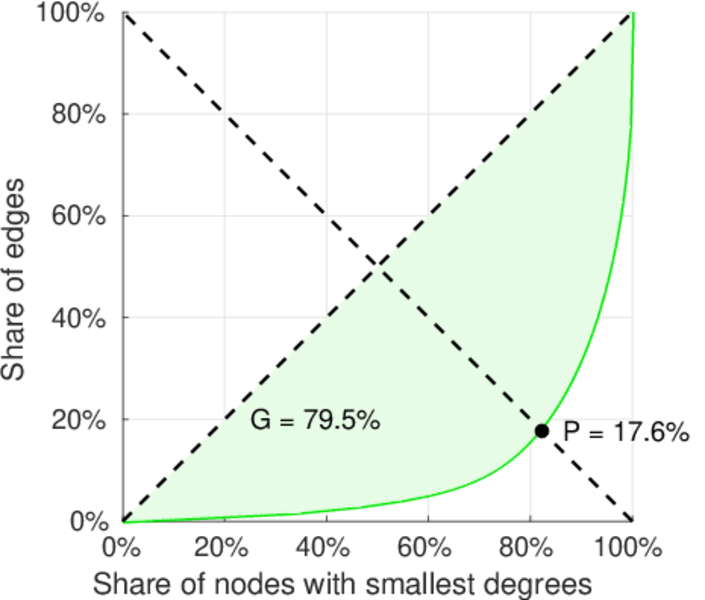
| Right balanced inequality ratio | P2 = | 0.175 783
|
| Relative edge distribution entropy | Her = | 0.752 575
|
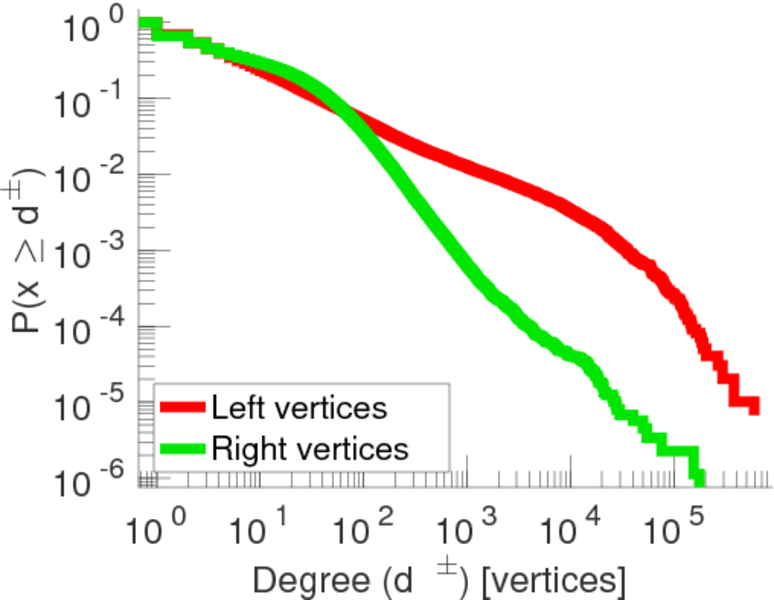
| Power law exponent | γ = | 1.937 82
|
| Tail power law exponent with p | γ3 = | 2.611 00
|
| p-value | p = | 0.000 00
|
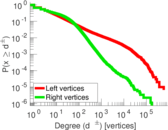
| Left tail power law exponent with p | γ3,1 = | 1.741 00
|
| Left p-value | p1 = | 0.000 00
|
| Right tail power law exponent with p | γ3,2 = | 3.381 00
|
| Right p-value | p2 = | 0.000 00
|
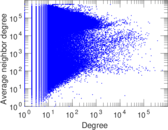
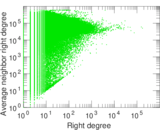
| Degree assortativity | ρ = | −0.102 569
|
| Degree assortativity p-value | pρ = | 0.000 00
|
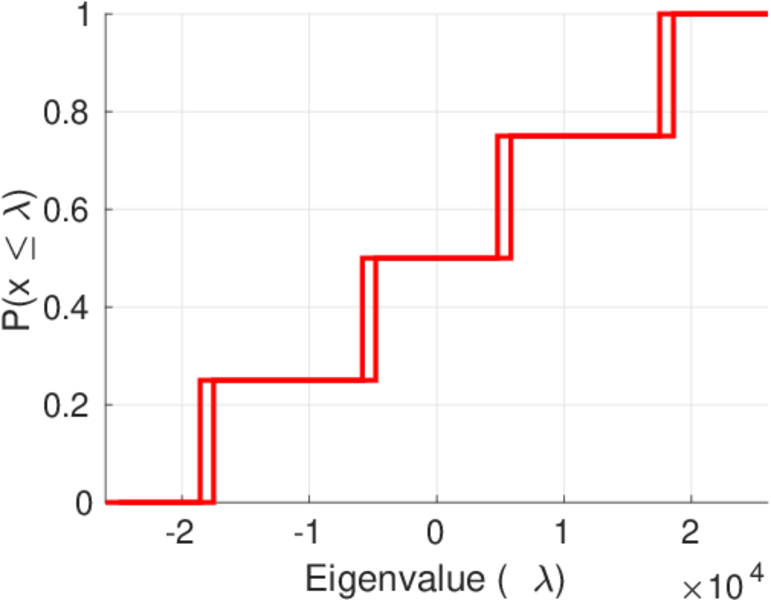
| Spectral norm | α = | 26,007.1
|
| Controllability | C = | 825,204
|
| Relative controllability | Cr = | 0.841 088
|
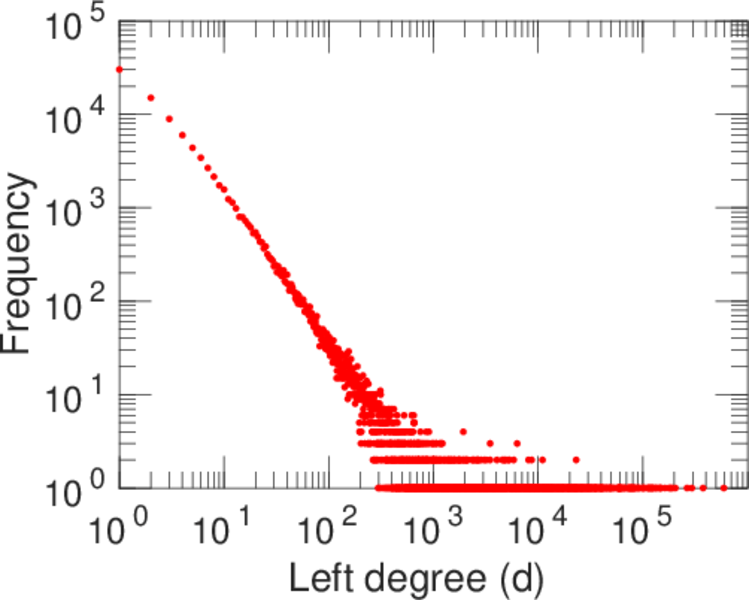
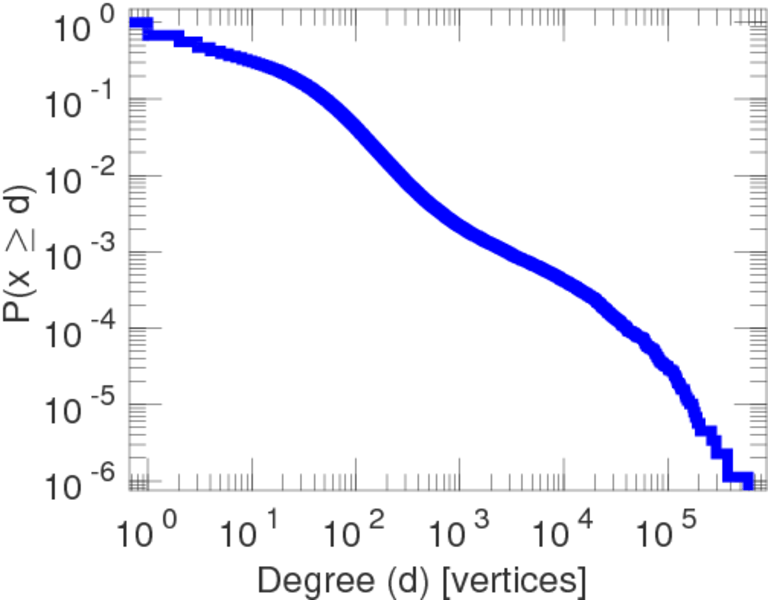
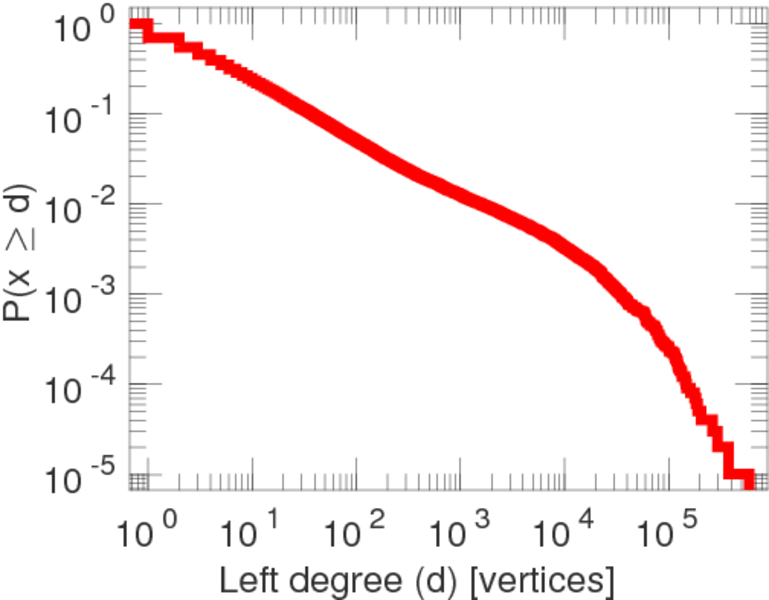
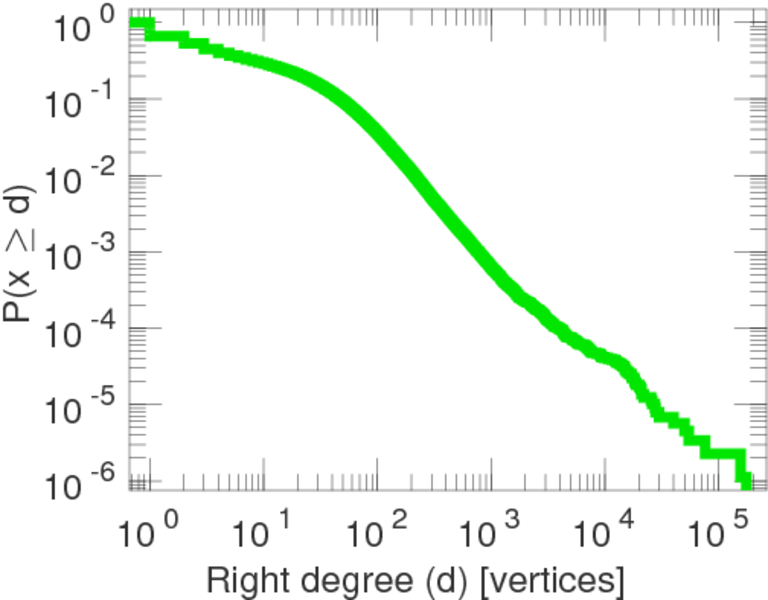
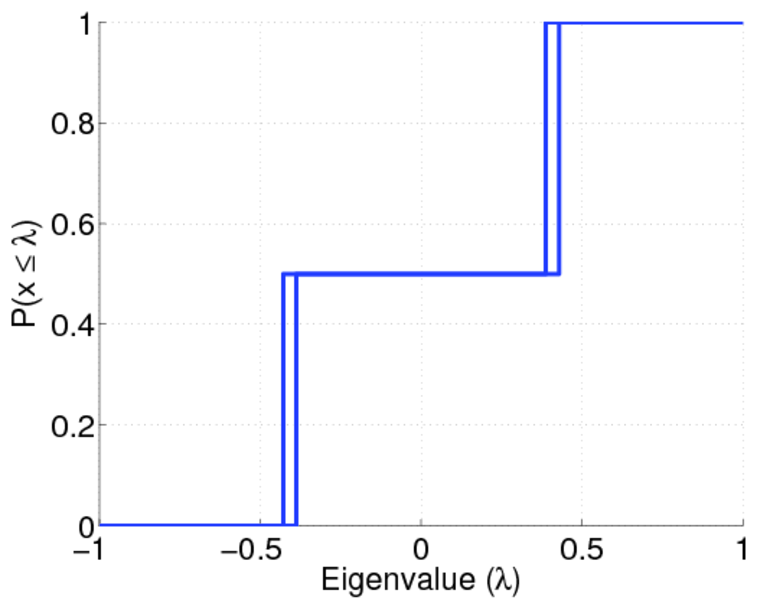
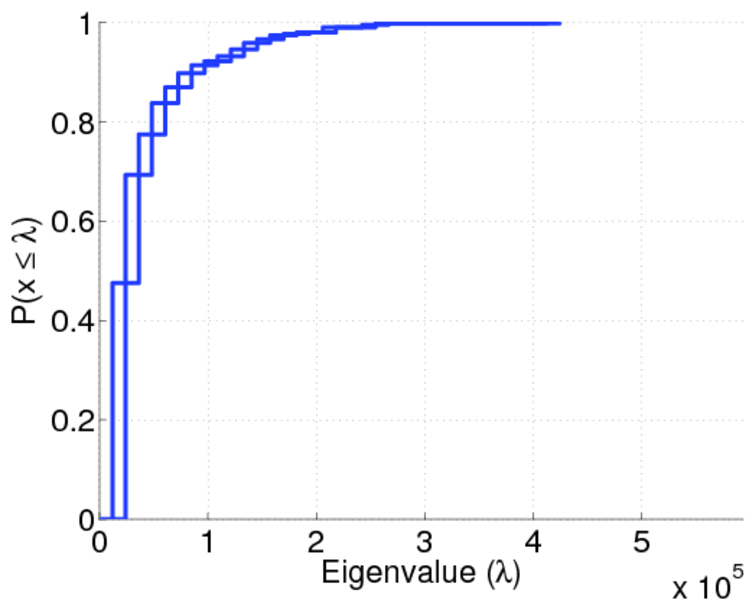
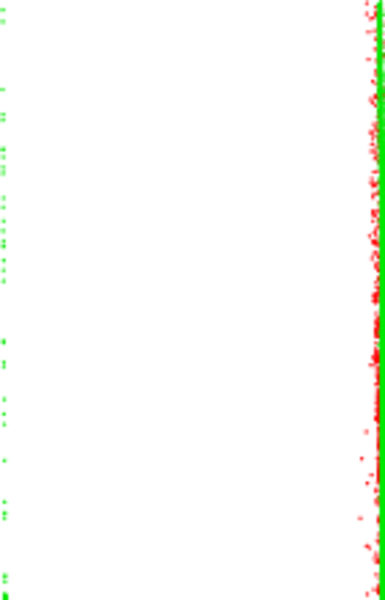
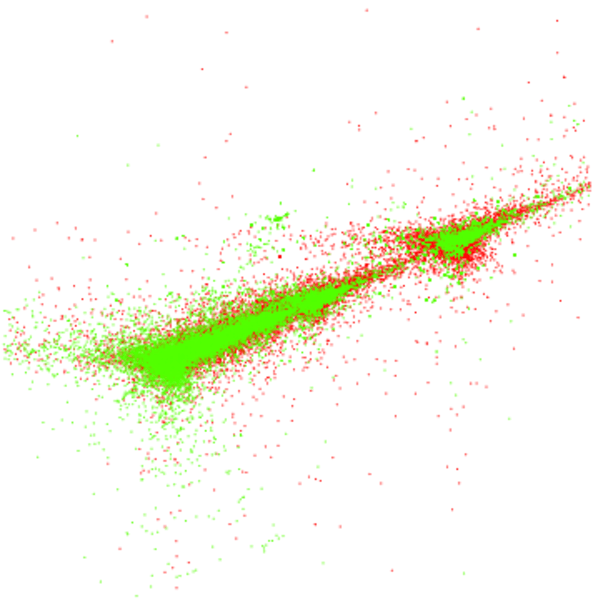
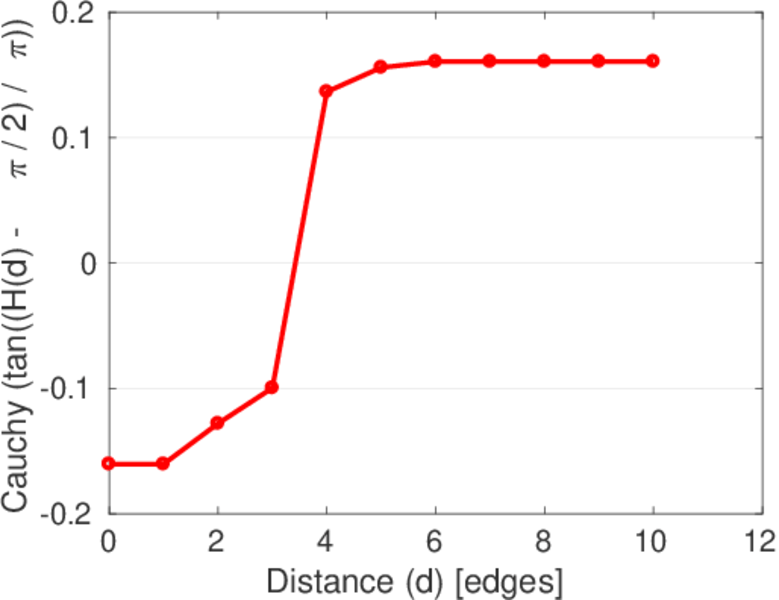
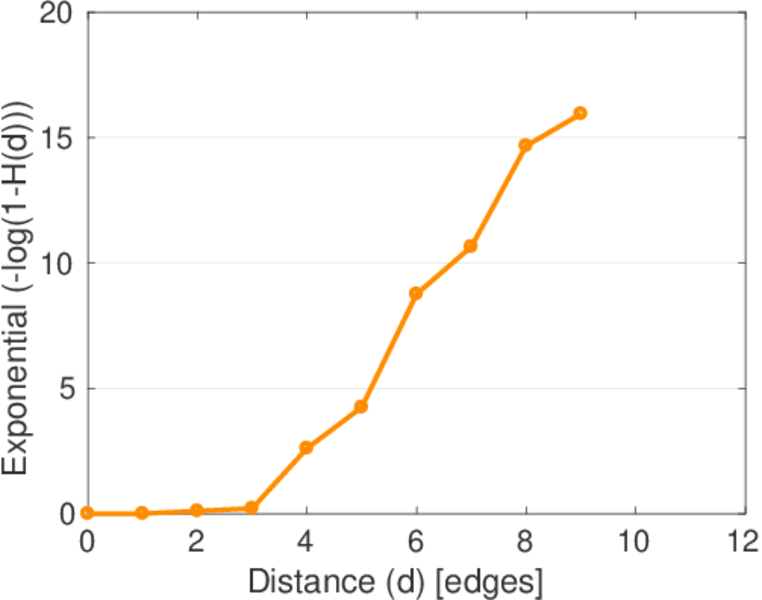
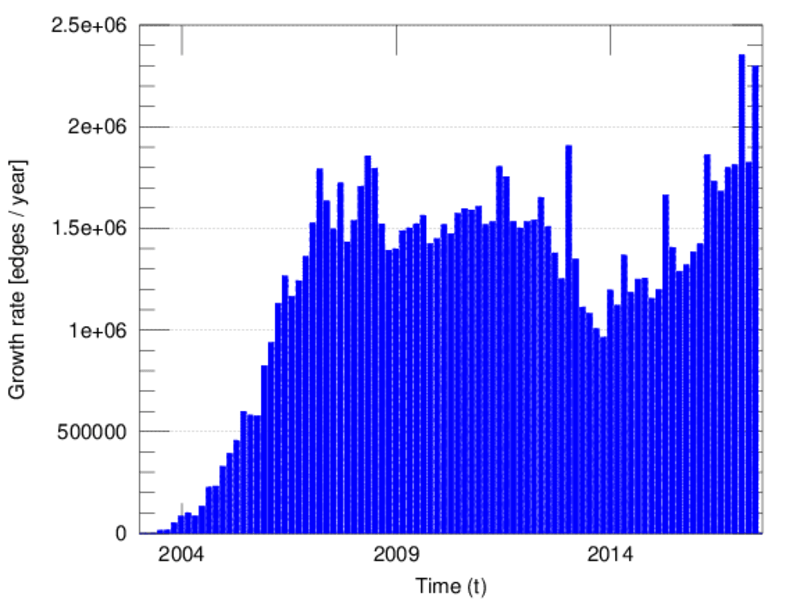
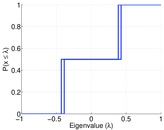
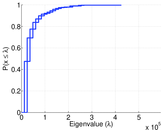
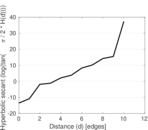
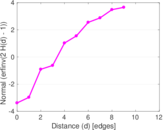
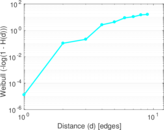
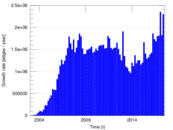
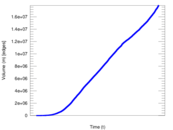
Plots


Downloads
References
|
[1]
|
Jérôme Kunegis.
KONECT – The Koblenz Network Collection.
In Proc. Int. Conf. on World Wide Web Companion, pages
1343–1350, 2013.
[ http ]
|
|
[2]
|
Wikimedia Foundation.
Wikimedia downloads.
http://dumps.wikimedia.org/, January 2010.
|
 KONECT ‣ Networks ‣
Buy Me a Coffee
KONECT ‣ Networks ‣
Buy Me a Coffee