Wikipedia edits (hu)
This is the bipartite edit network of the Hungarian Wikipedia. It contains
users and pages from the Hungarian Wikipedia, connected by edit events. Each
edge represents an edit. The dataset includes the timestamp of each edit.
Metadata
Statistics
| Size | n = | 1,280,637
|
| Left size | n1 = | 88,875
|
| Right size | n2 = | 1,191,762
|
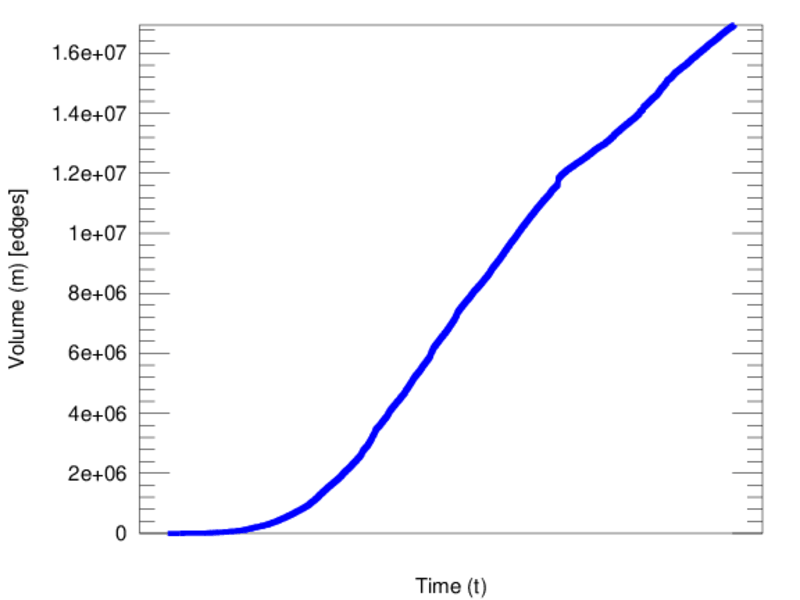
| Volume | m = | 16,945,613
|
| Unique edge count | m̿ = | 7,011,352
|
| Wedge count | s = | 140,591,347,579
|
| Claw count | z = | 4,006,622,072,878,192
|
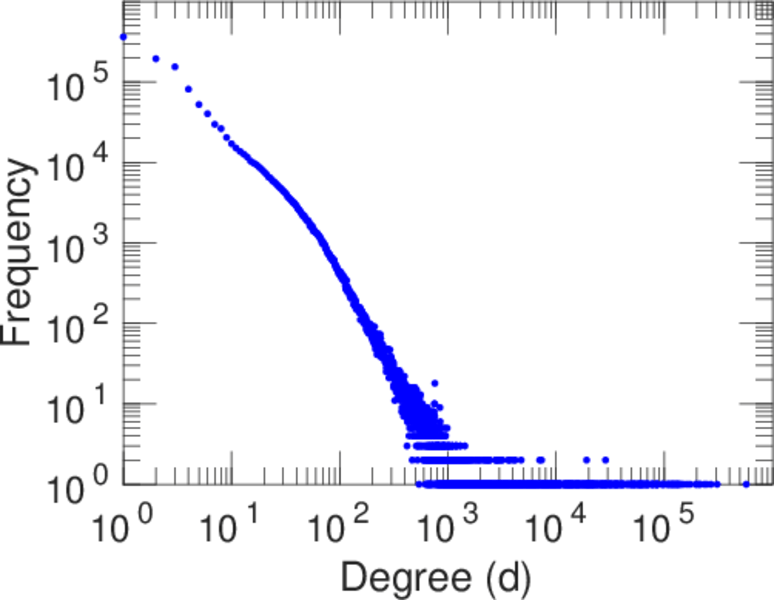
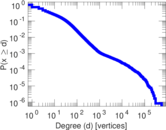
| Maximum degree | dmax = | 573,160
|
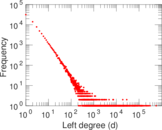
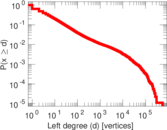
| Maximum left degree | d1max = | 573,160
|
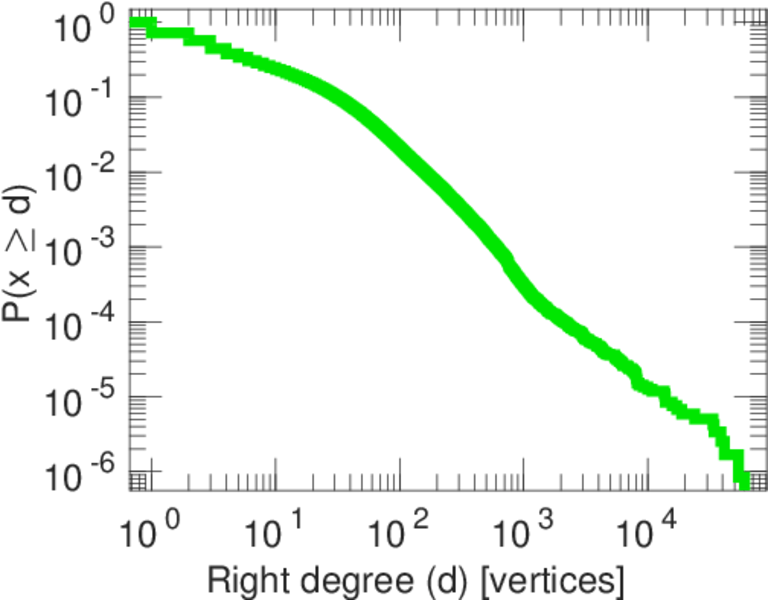
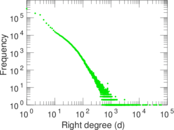
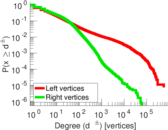
| Maximum right degree | d2max = | 60,176
|
| Average degree | d = | 26.464 4
|
| Average left degree | d1 = | 190.668
|
| Average right degree | d2 = | 14.219 0
|
| Average edge multiplicity | m̃ = | 2.416 88
|
| Size of LCC | N = | 1,265,729
|
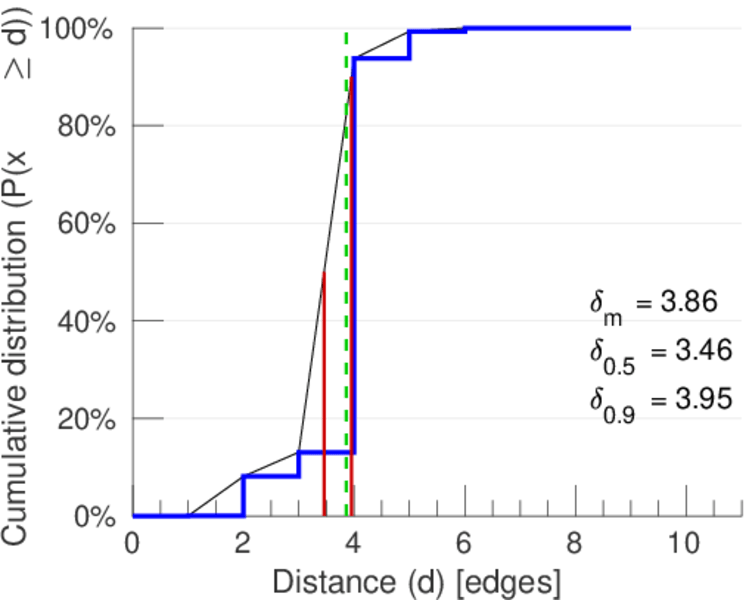
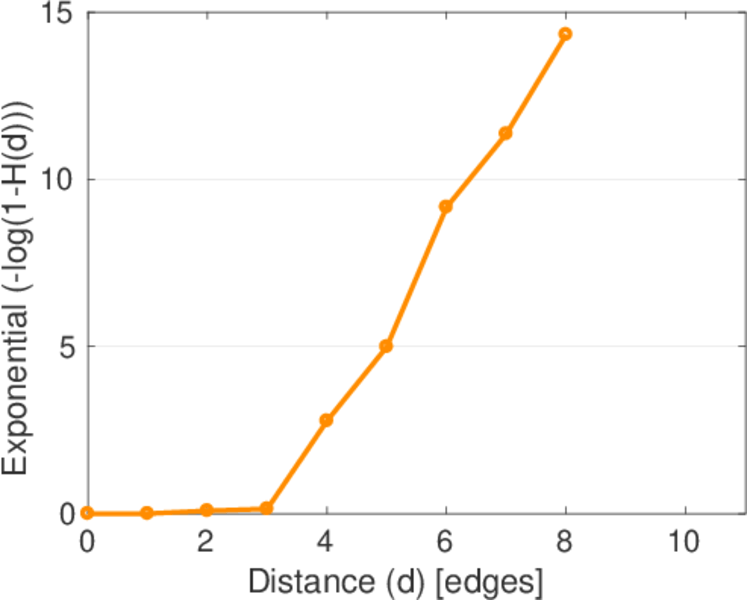
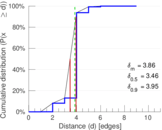
| Diameter | δ = | 13
|
| 50-Percentile effective diameter | δ0.5 = | 3.457 85
|
| 90-Percentile effective diameter | δ0.9 = | 3.953 61
|
| Median distance | δM = | 4
|
| Mean distance | δm = | 3.857 87
|
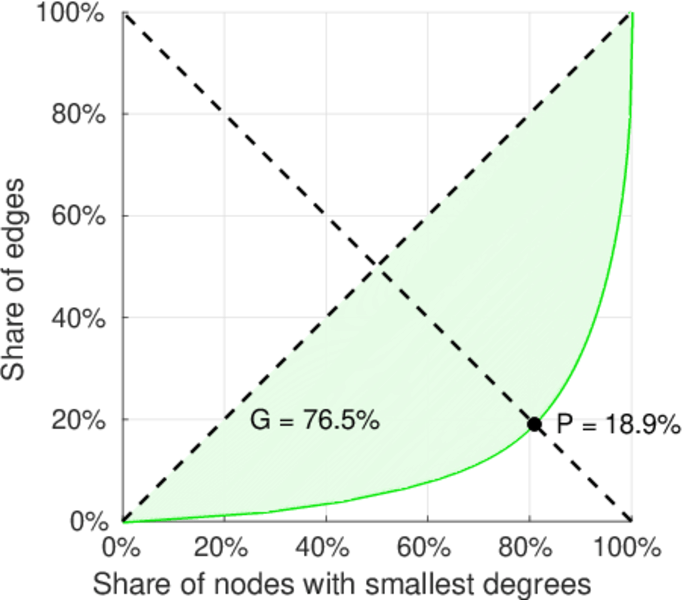
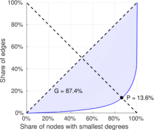
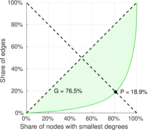
| Gini coefficient | G = | 0.876 397
|
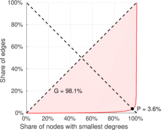
| Balanced inequality ratio | P = | 0.135 441
|
| Left balanced inequality ratio | P1 = | 0.035 974 1
|
| Right balanced inequality ratio | P2 = | 0.189 010
|
| Relative edge distribution entropy | Her = | 0.738 283
|
| Power law exponent | γ = | 1.986 04
|
| Degree assortativity | ρ = | −0.078 906 3
|
| Degree assortativity p-value | pρ = | 0.000 00
|
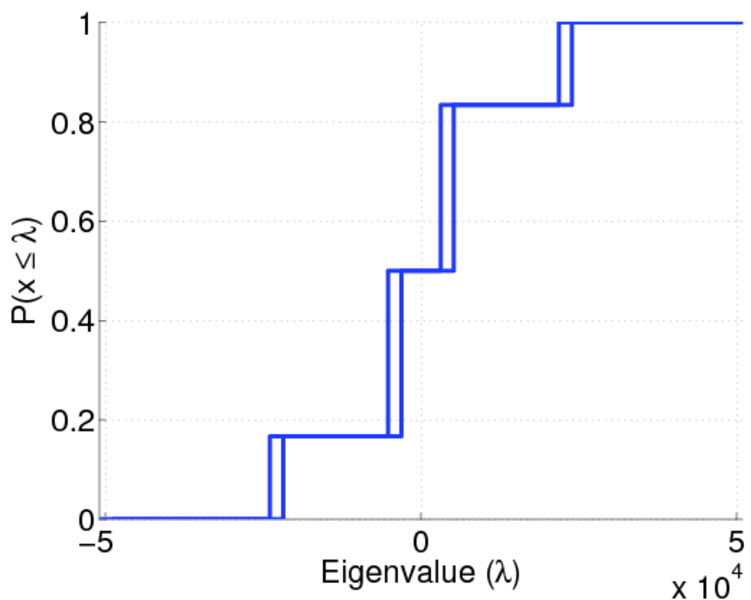
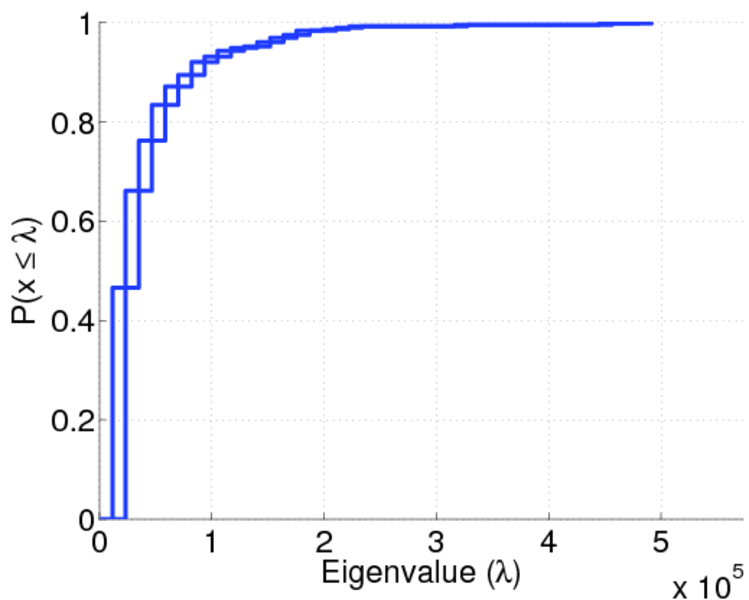
| Spectral norm | α = | 50,936.8
|
| Spectral separation | |λ1[A] / λ2[A]| = | 3.109 14
|
| Controllability | C = | 1,138,029
|
| Relative controllability | Cr = | 0.891 939
|
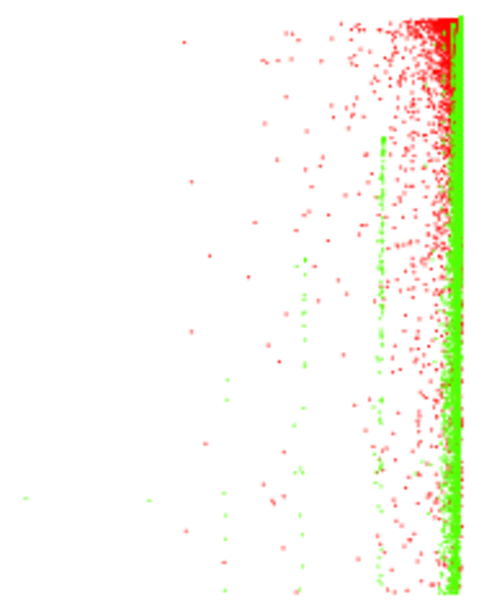
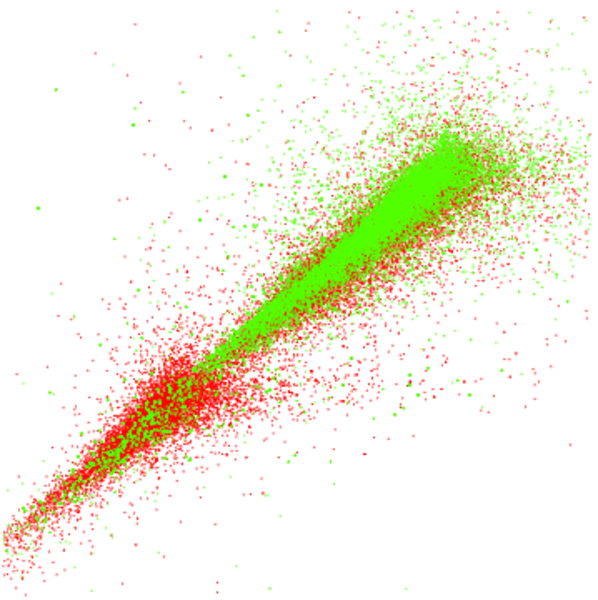
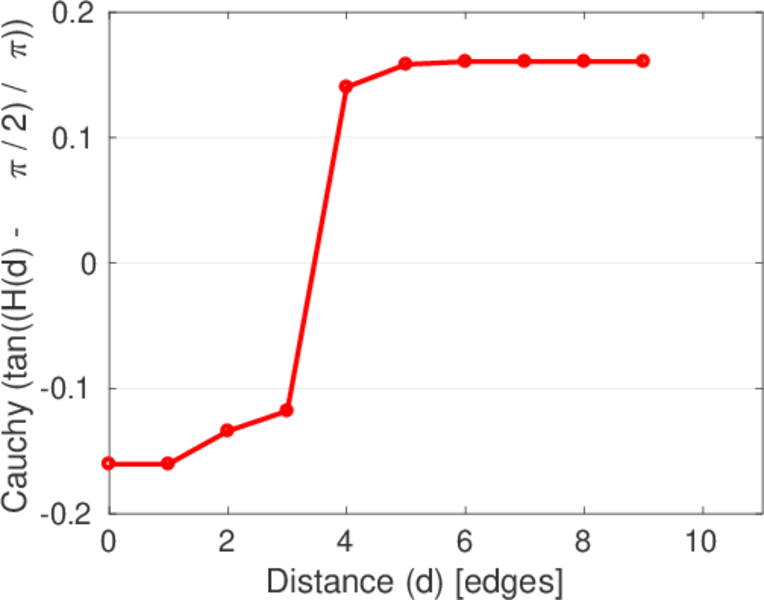
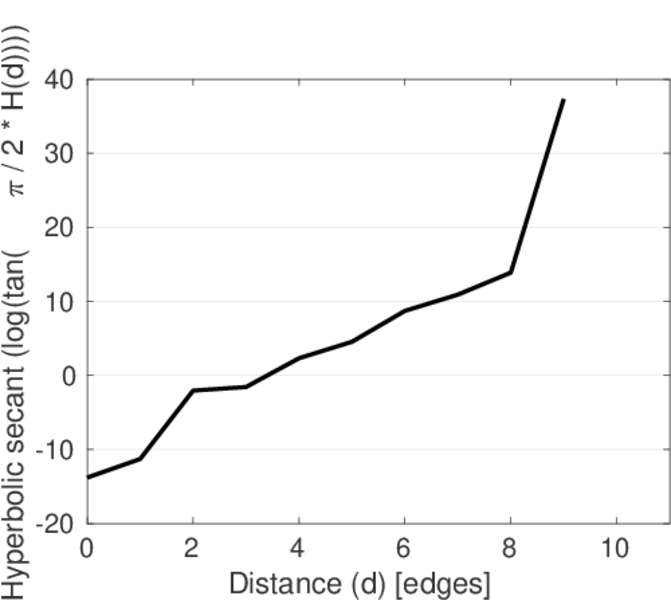
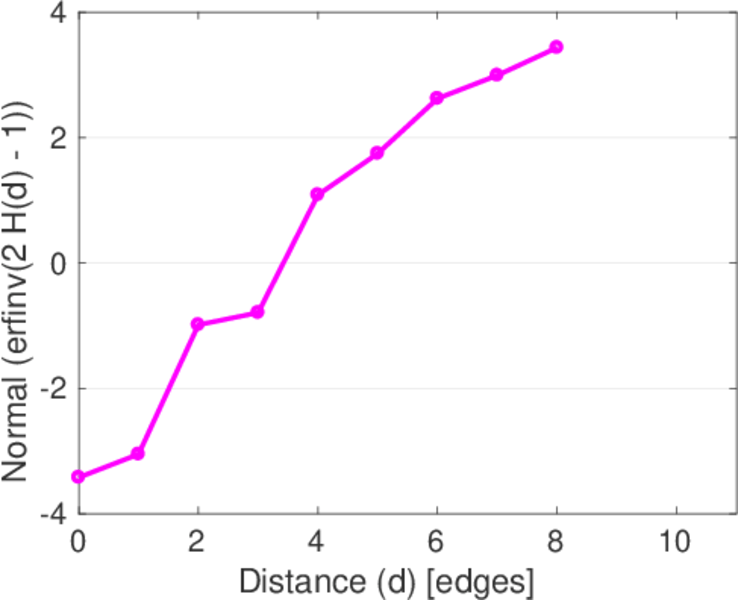
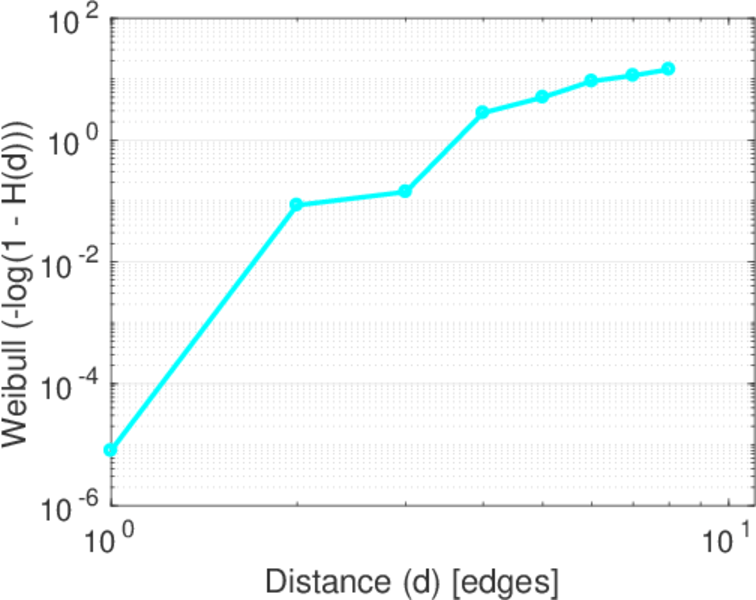
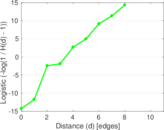
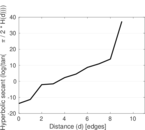
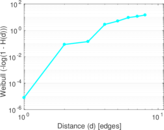
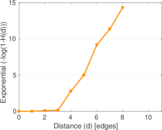
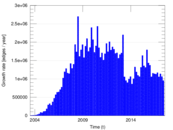
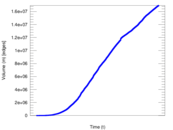
Plots


Downloads
References
|
[1]
|
Jérôme Kunegis.
KONECT – The Koblenz Network Collection.
In Proc. Int. Conf. on World Wide Web Companion, pages
1343–1350, 2013.
[ http ]
|
|
[2]
|
Wikimedia Foundation.
Wikimedia downloads.
http://dumps.wikimedia.org/, January 2010.
|
 KONECT ‣ Networks ‣
Buy Me a Coffee
KONECT ‣ Networks ‣
Buy Me a Coffee