Wiktionary edits (ko)
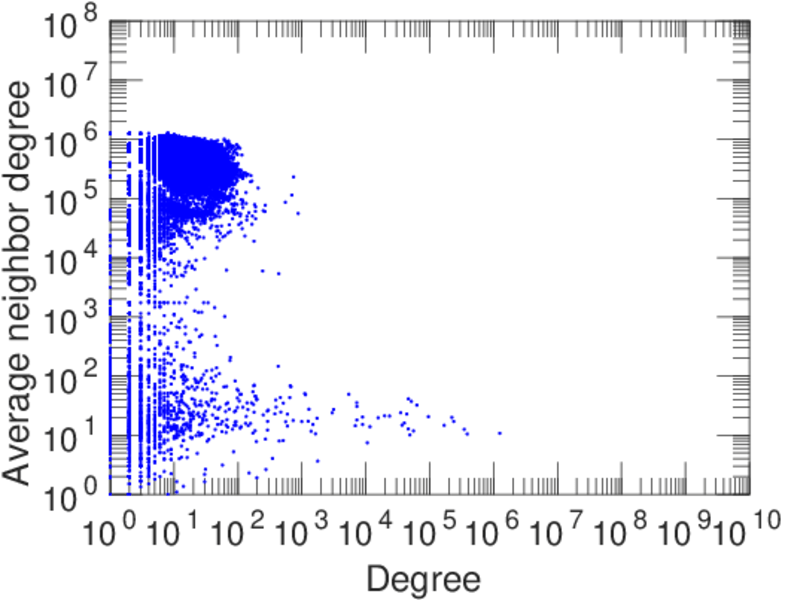
This is the bipartite edit network of the Korean Wiktionary. It contains users
and pages from the Korean Wiktionary, connected by edit events. Each edge
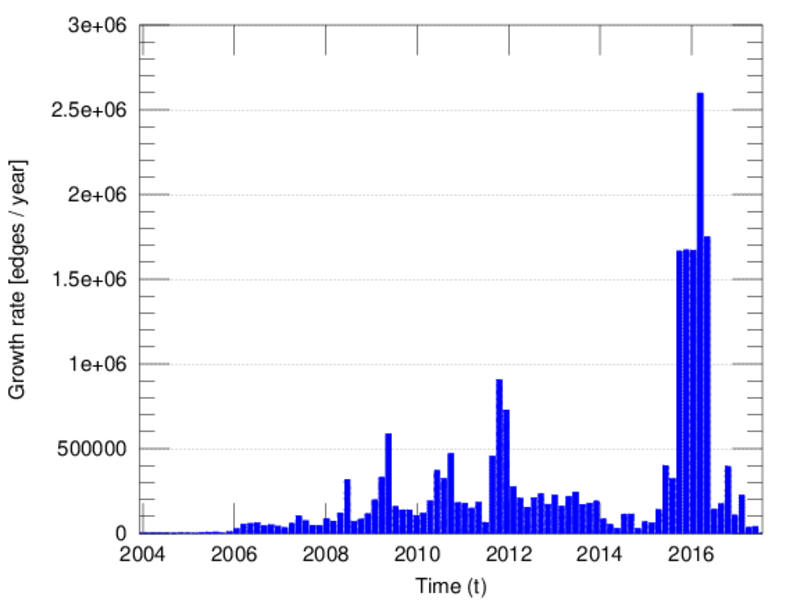
represents an edit. The dataset includes the timestamp of each edit.
Metadata
Statistics
| Size | n = | 409,984
|
| Left size | n1 = | 1,300
|
| Right size | n2 = | 408,684
|
| Volume | m = | 3,351,194
|
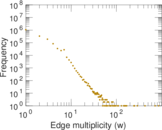
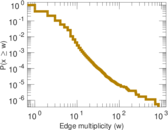
| Unique edge count | m̿ = | 1,781,718
|
| Wedge count | s = | 172,539,742,992
|
| Cross count | x = | 1.416 52 × 1021
|
| 4-Tour count | T4 = | 1,822,191,396,900
|
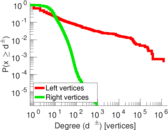
| Maximum degree | dmax = | 1,250,119
|
| Maximum left degree | d1max = | 1,250,119
|
| Maximum right degree | d2max = | 874
|
| Average degree | d = | 16.347 9
|
| Average left degree | d1 = | 2,577.84
|
| Average right degree | d2 = | 8.199 96
|
| Average edge multiplicity | m̃ = | 1.880 88
|
| Size of LCC | N = | 409,516
|
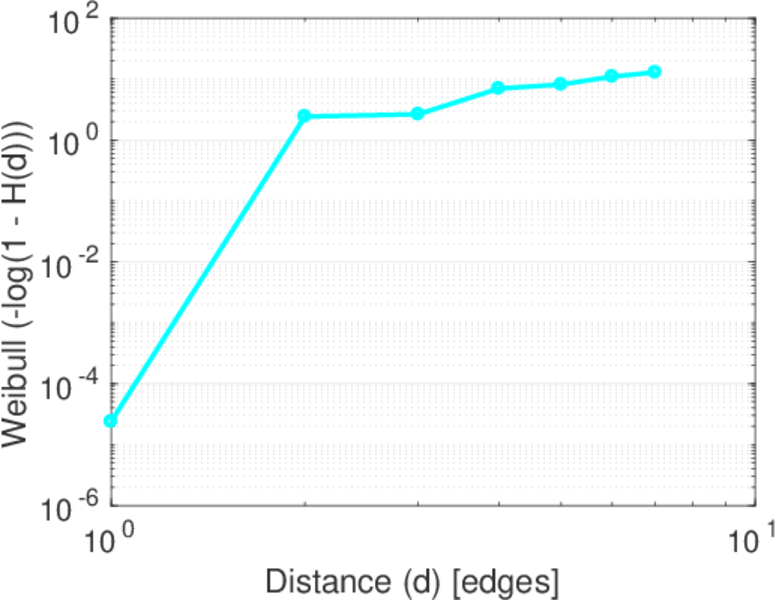
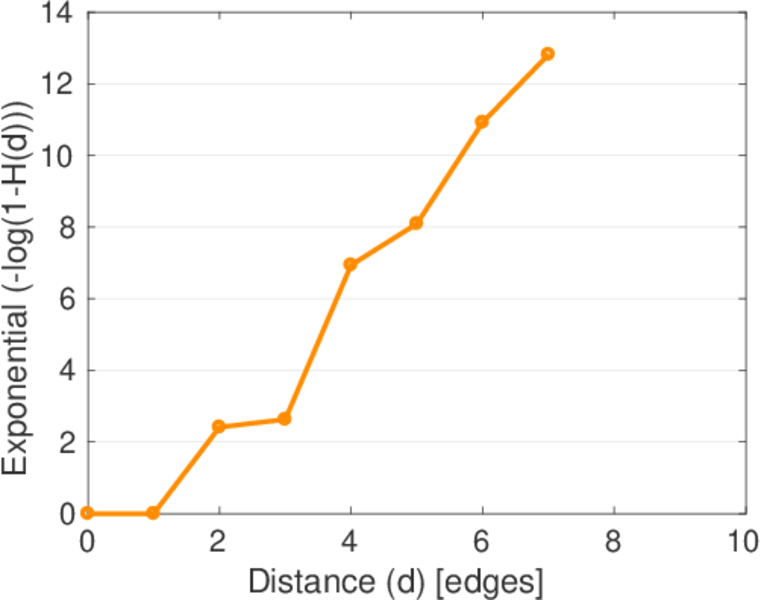
| Diameter | δ = | 10
|
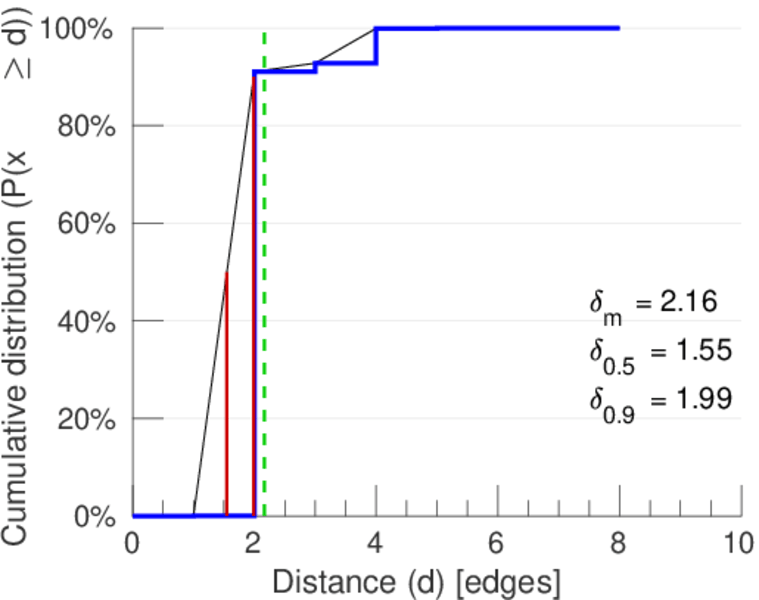
| 50-Percentile effective diameter | δ0.5 = | 1.549 15
|
| 90-Percentile effective diameter | δ0.9 = | 1.988 49
|
| Median distance | δM = | 2
|
| Mean distance | δm = | 2.162 92
|
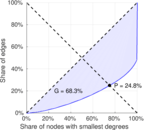
| Gini coefficient | G = | 0.683 502
|
| Balanced inequality ratio | P = | 0.247 898
|
| Left balanced inequality ratio | P1 = | 0.018 672 2
|
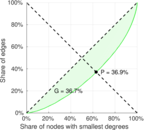
| Right balanced inequality ratio | P2 = | 0.369 238
|
| Relative edge distribution entropy | Her = | 0.653 351
|
| Tail power law exponent with p | γ3 = | 5.291 00
|
| p-value | p = | 0.000 00
|
| Left tail power law exponent with p | γ3,1 = | 1.591 00
|
| Left p-value | p1 = | 0.000 00
|
| Right tail power law exponent with p | γ3,2 = | 8.991 00
|
| Right p-value | p2 = | 0.000 00
|
| Degree assortativity | ρ = | −0.368 036
|
| Degree assortativity p-value | pρ = | 0.000 00
|
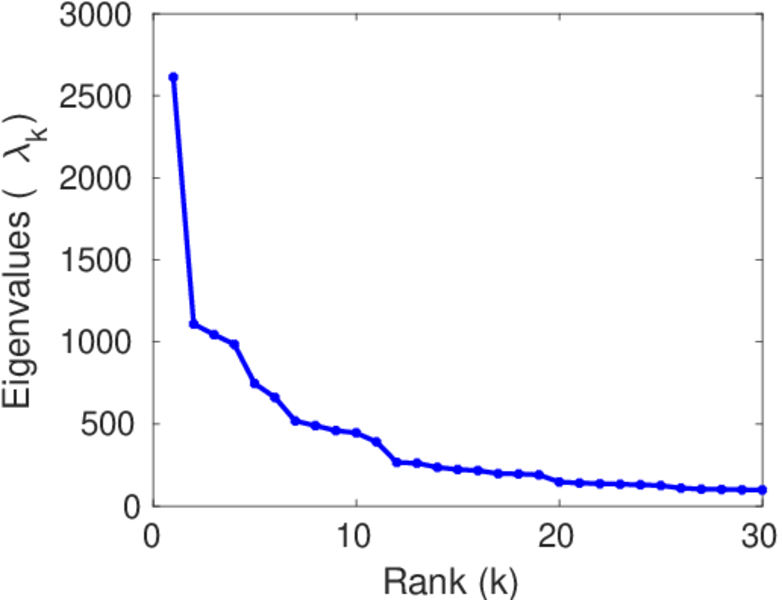
| Spectral norm | α = | 2,613.03
|
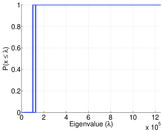
| Algebraic connectivity | a = | 0.023 063 1
|
| Controllability | C = | 407,351
|
| Relative controllability | Cr = | 0.993 847
|
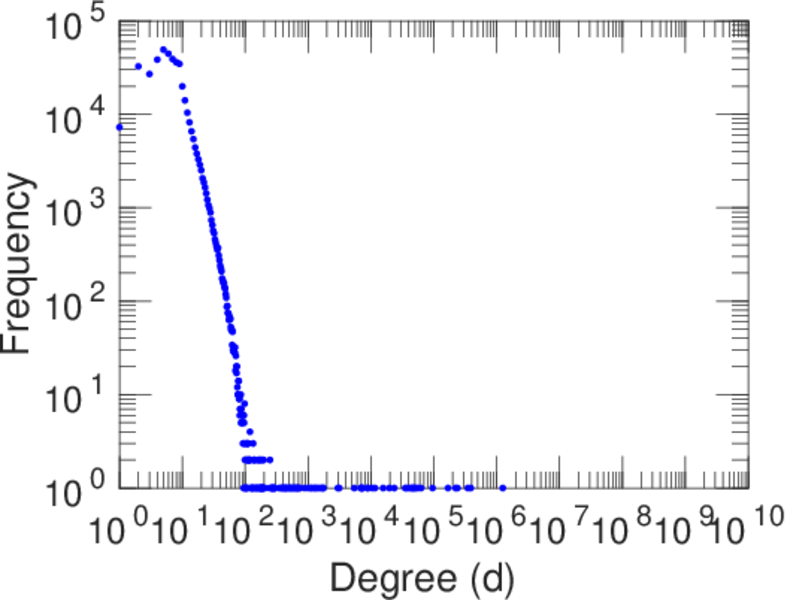
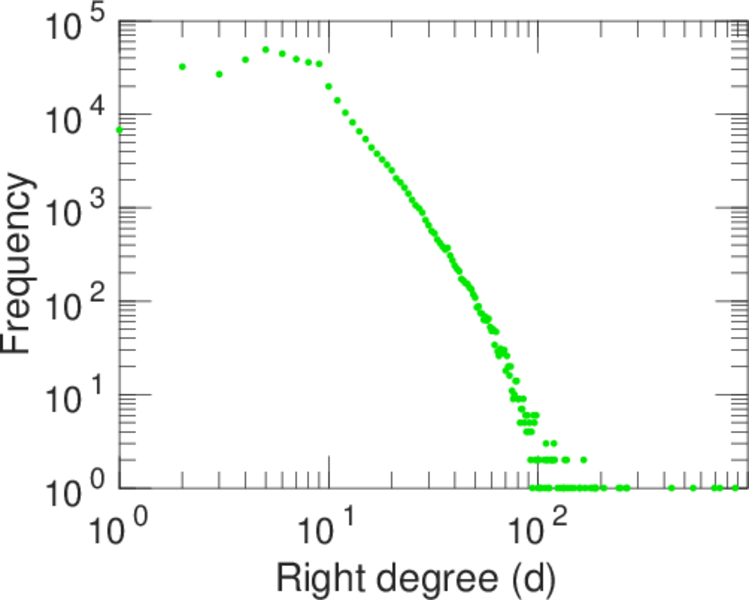
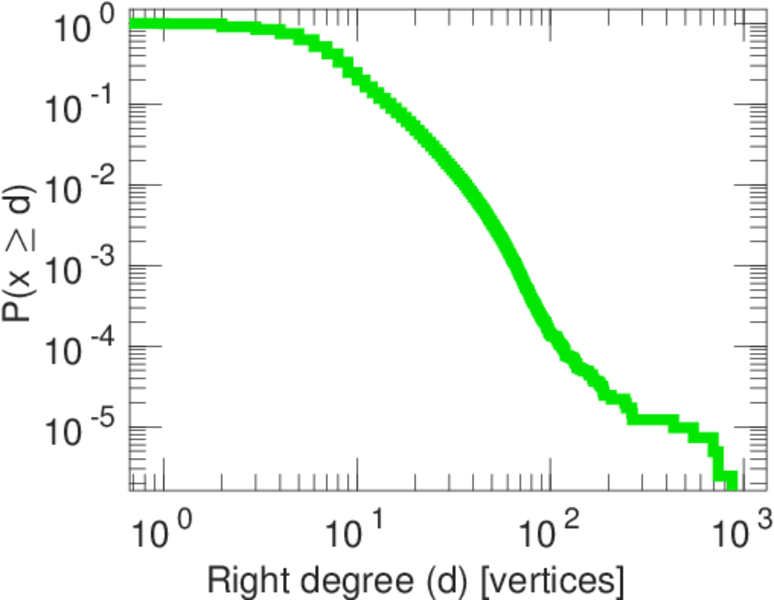
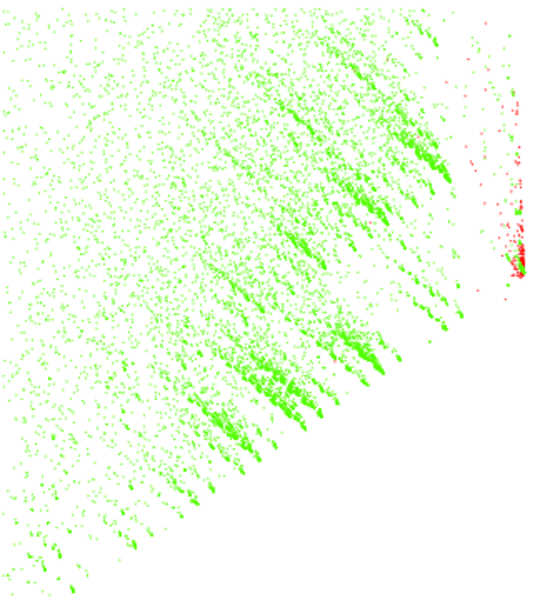
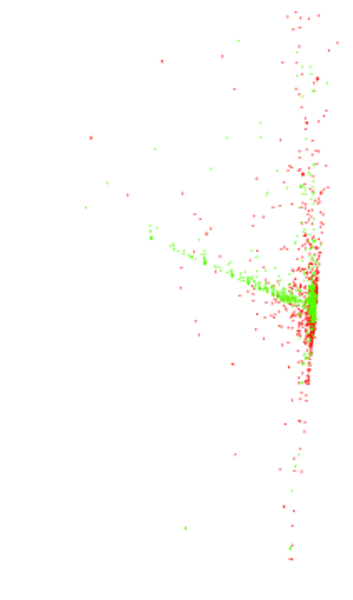
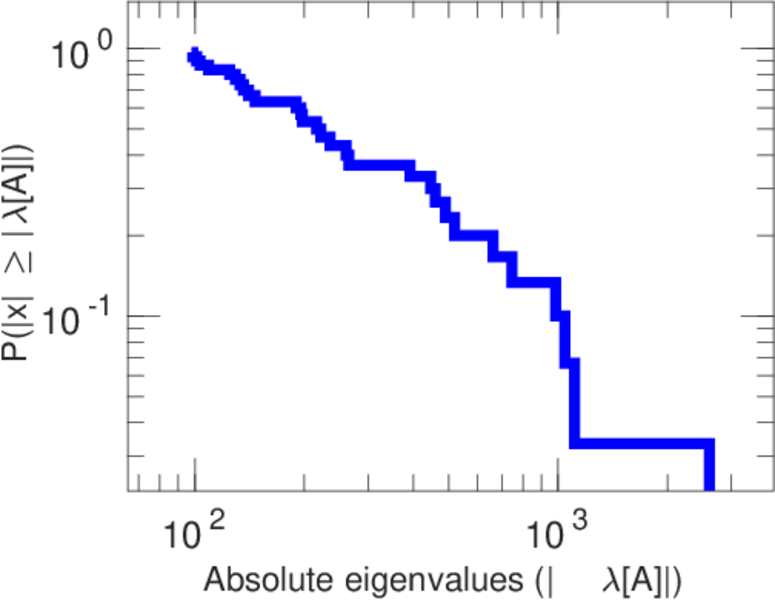
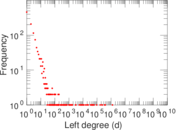
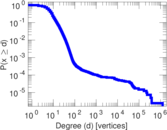
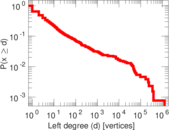
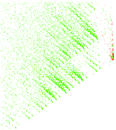
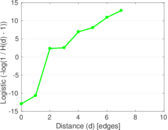
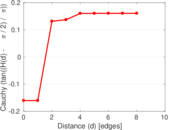
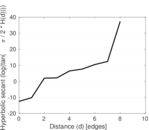
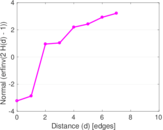
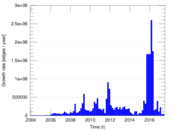
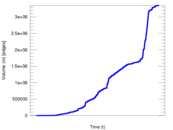
Plots


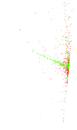


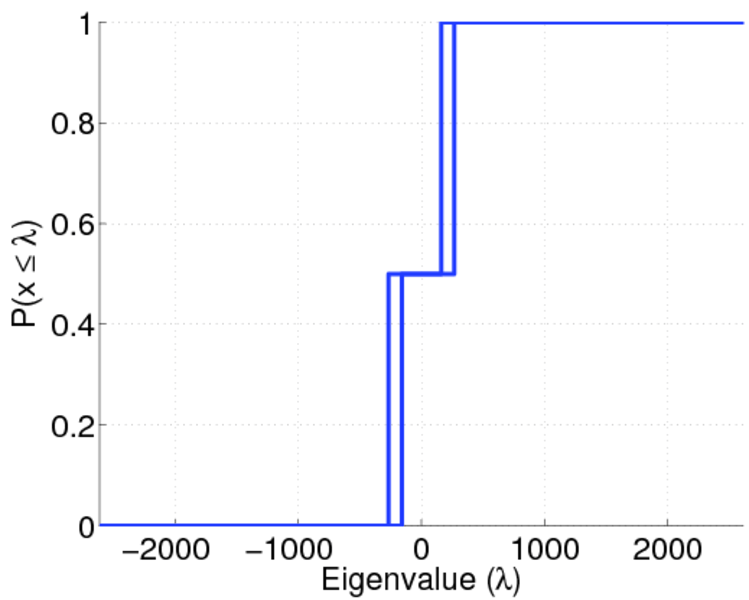
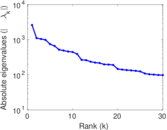
Matrix decompositions plots


Downloads
References
|
[1]
|
Jérôme Kunegis.
KONECT – The Koblenz Network Collection.
In Proc. Int. Conf. on World Wide Web Companion, pages
1343–1350, 2013.
[ http ]
|
|
[2]
|
Wikimedia Foundation.
Wikimedia downloads.
http://dumps.wikimedia.org/, January 2010.
|
 KONECT ‣ Networks ‣
Buy Me a Coffee
KONECT ‣ Networks ‣
Buy Me a Coffee