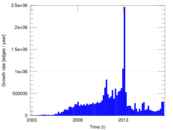
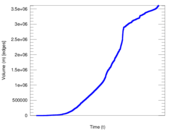
Wikipedia edits (ms)
This is the bipartite edit network of the Malay Wikipedia. It contains users
and pages from the Malay Wikipedia, connected by edit events. Each edge
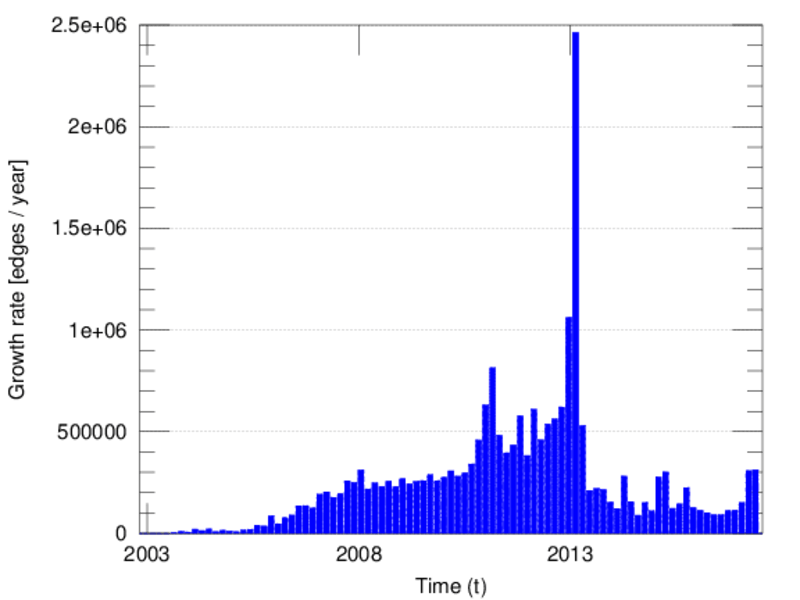
represents an edit. The dataset includes the timestamp of each edit.
Metadata
Statistics
| Size | n = | 819,847
|
| Left size | n1 = | 18,211
|
| Right size | n2 = | 801,636
|
| Volume | m = | 3,615,962
|
| Unique edge count | m̿ = | 2,200,329
|
| Wedge count | s = | 74,600,365,563
|
| Claw count | z = | 3,558,651,047,738,584
|
| Cross count | x = | 1.572 04 × 1020
|
| 4-Tour count | T4 = | 635,785,240,626
|
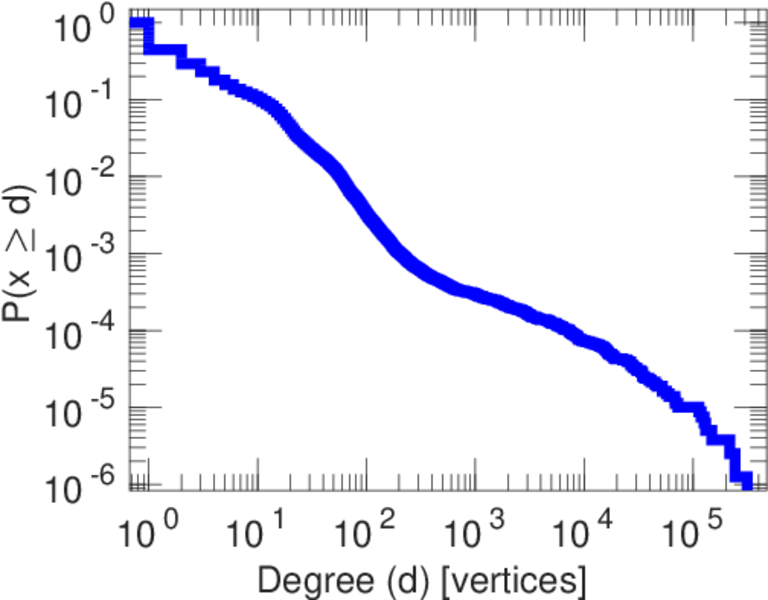
| Maximum degree | dmax = | 314,765
|
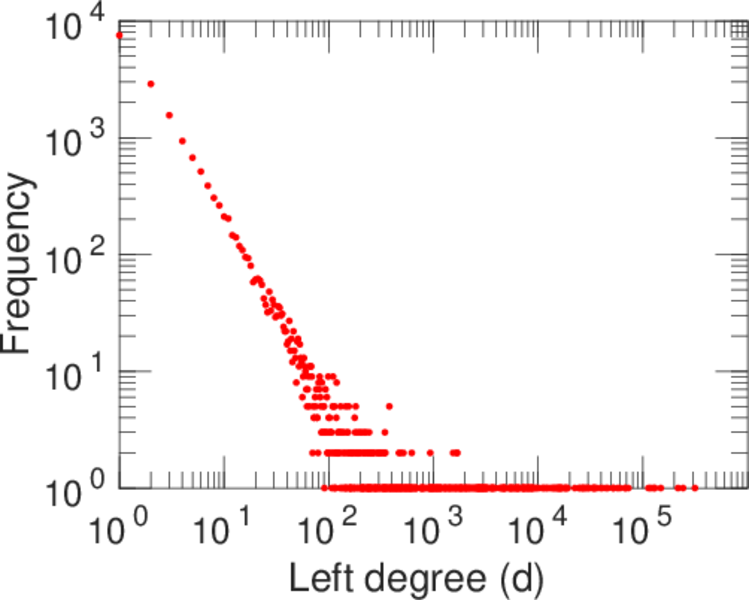
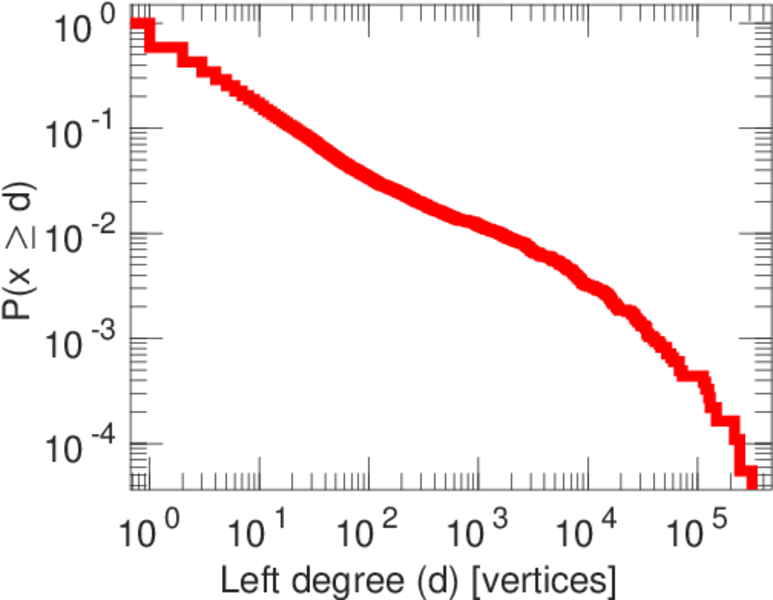
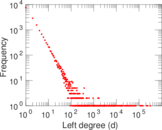
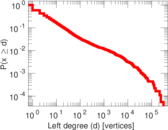
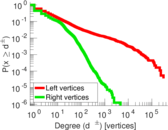
| Maximum left degree | d1max = | 314,765
|
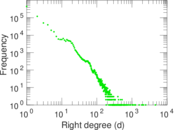
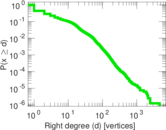
| Maximum right degree | d2max = | 4,671
|
| Average degree | d = | 8.821 07
|
| Average left degree | d1 = | 198.559
|
| Average right degree | d2 = | 4.510 73
|
| Fill | p = | 0.000 150 722
|
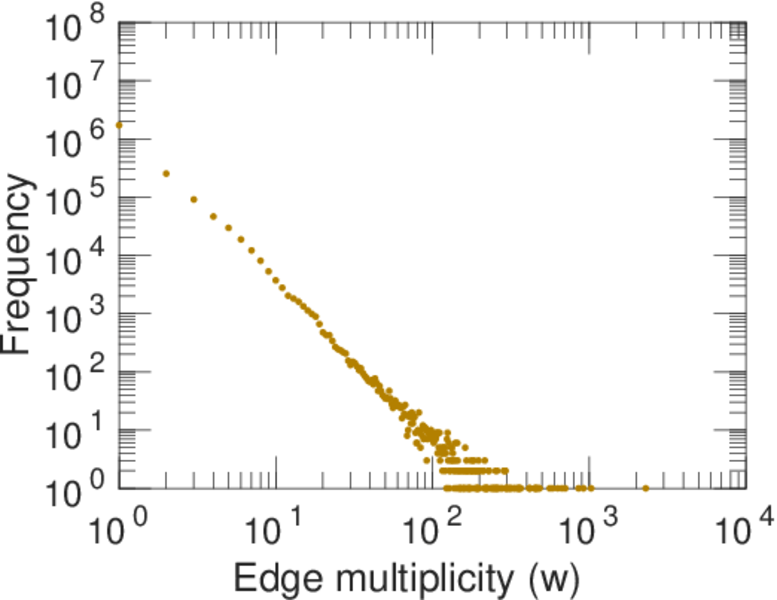
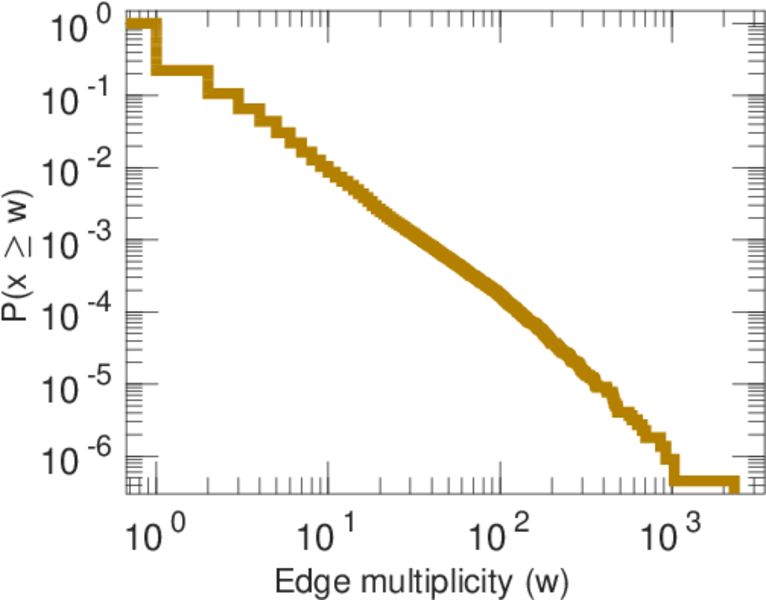
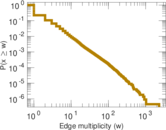
| Average edge multiplicity | m̃ = | 1.643 37
|
| Size of LCC | N = | 812,196
|
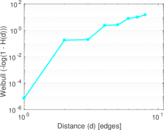
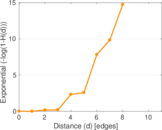
| Diameter | δ = | 11
|
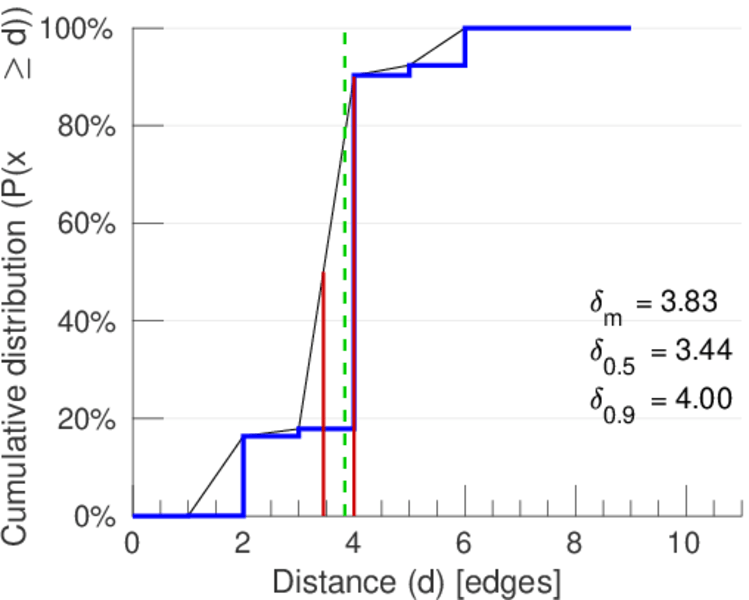
| 50-Percentile effective diameter | δ0.5 = | 3.443 99
|
| 90-Percentile effective diameter | δ0.9 = | 3.996 24
|
| Median distance | δM = | 4
|
| Mean distance | δm = | 3.832 16
|
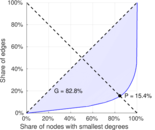
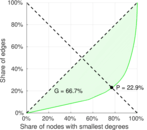
| Gini coefficient | G = | 0.831 455
|
| Balanced inequality ratio | P = | 0.151 217
|
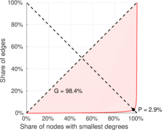
| Left balanced inequality ratio | P1 = | 0.028 703 0
|
| Right balanced inequality ratio | P2 = | 0.229 119
|
| Power law exponent | γ = | 2.852 24
|
| Tail power law exponent | γt = | 2.031 00
|
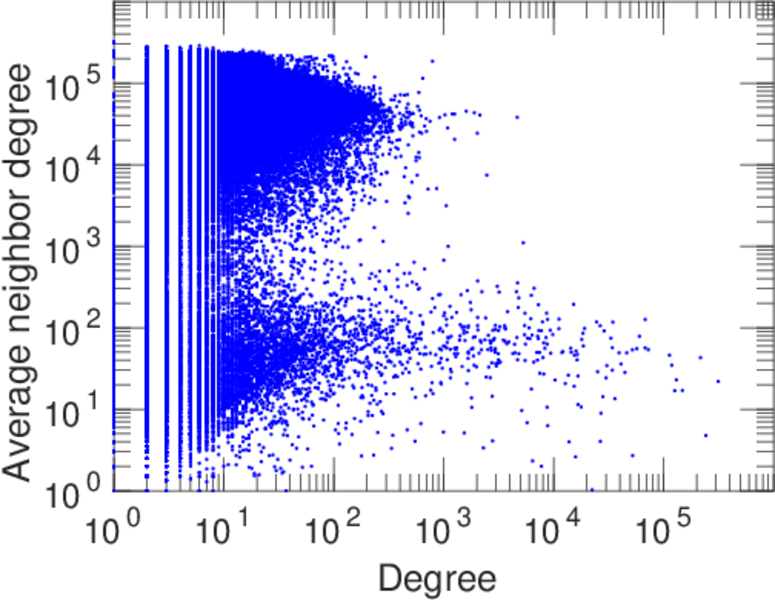
| Degree assortativity | ρ = | −0.266 697
|
| Degree assortativity p-value | pρ = | 0.000 00
|
| Spectral norm | α = | 2,310.00
|
| Controllability | C = | 783,776
|
| Relative controllability | Cr = | 0.961 543
|
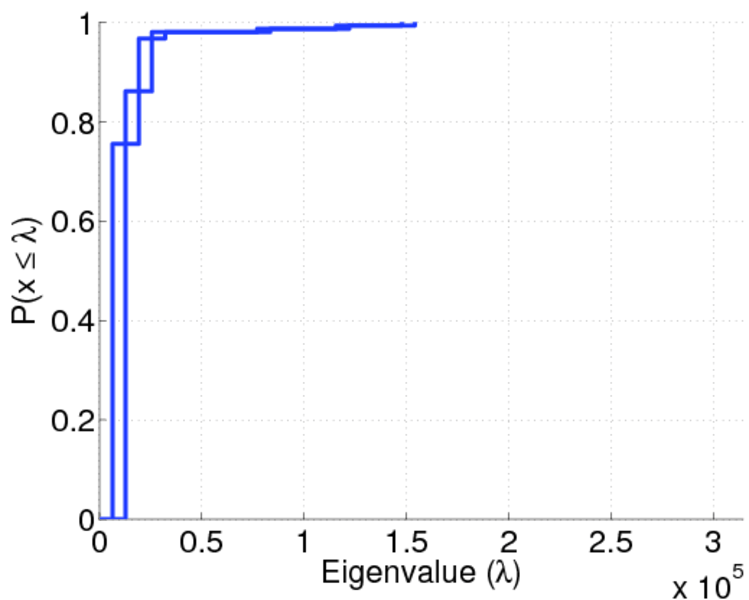
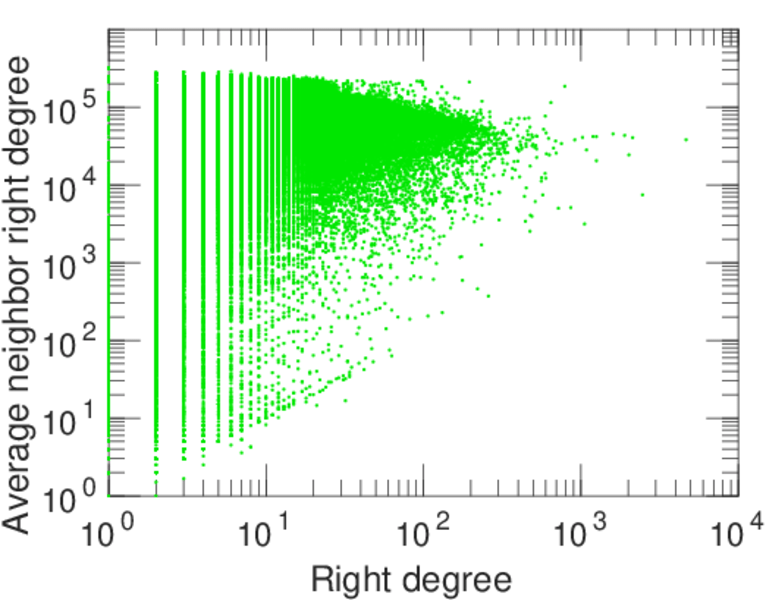
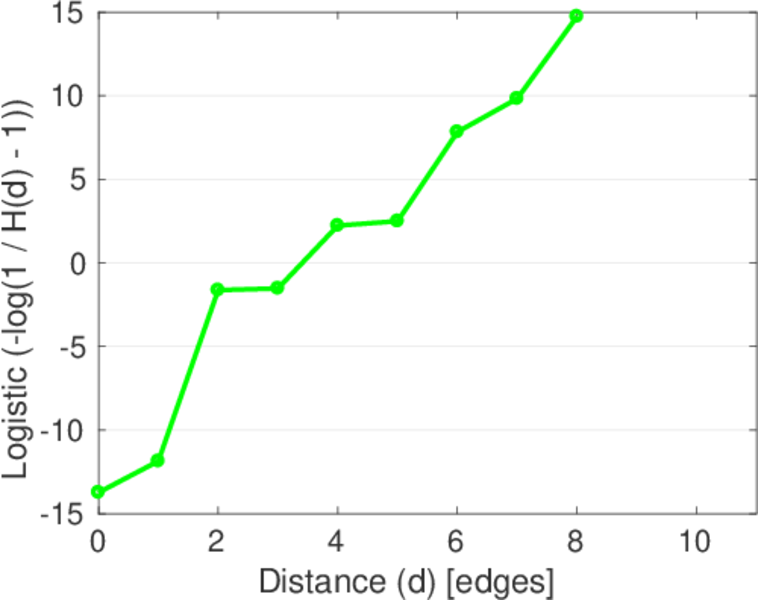
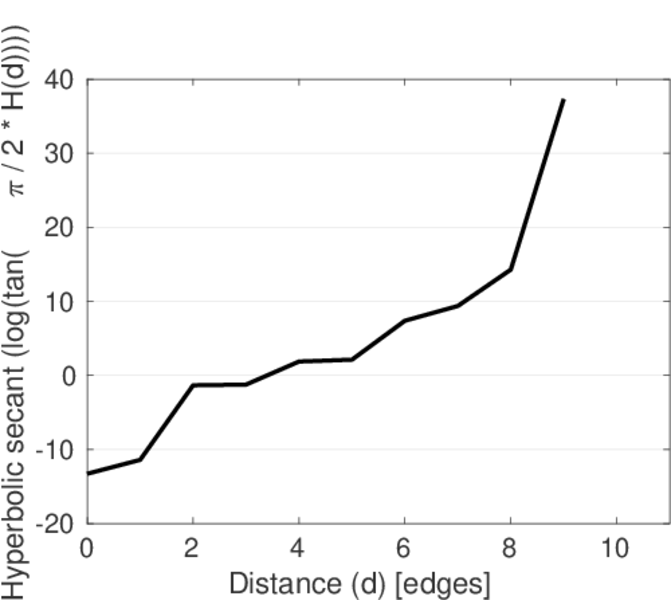
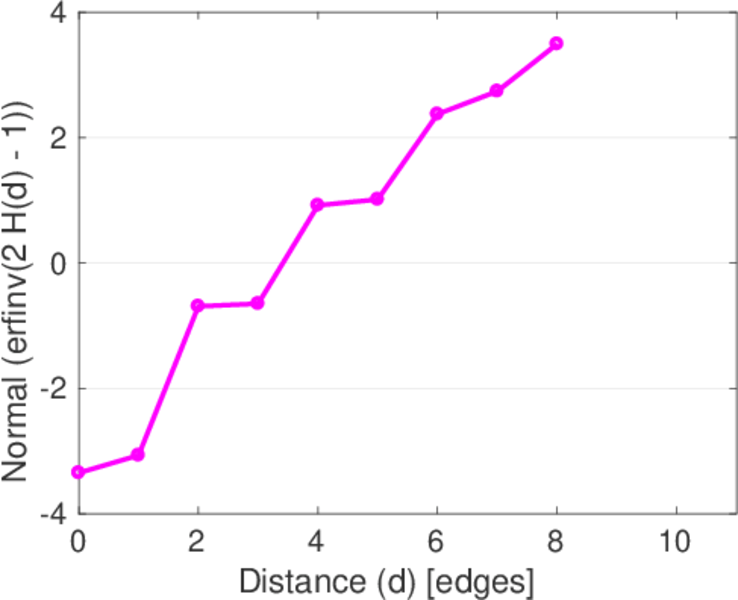
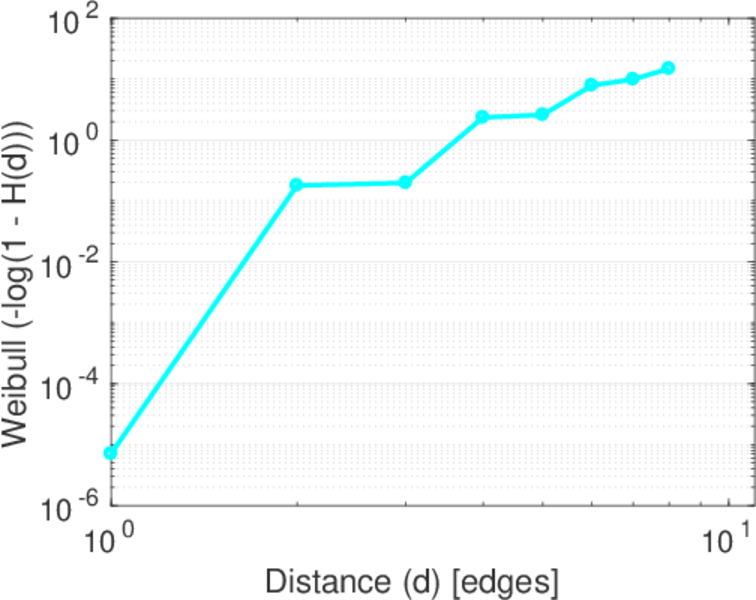
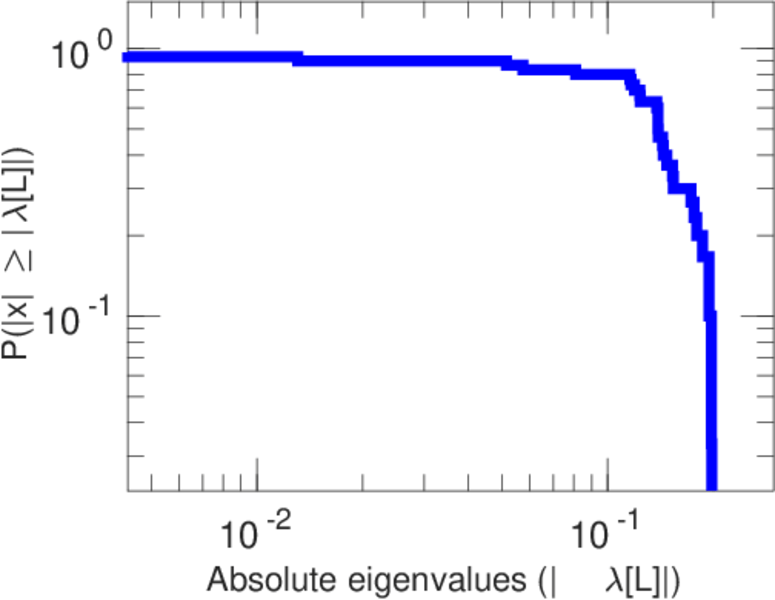
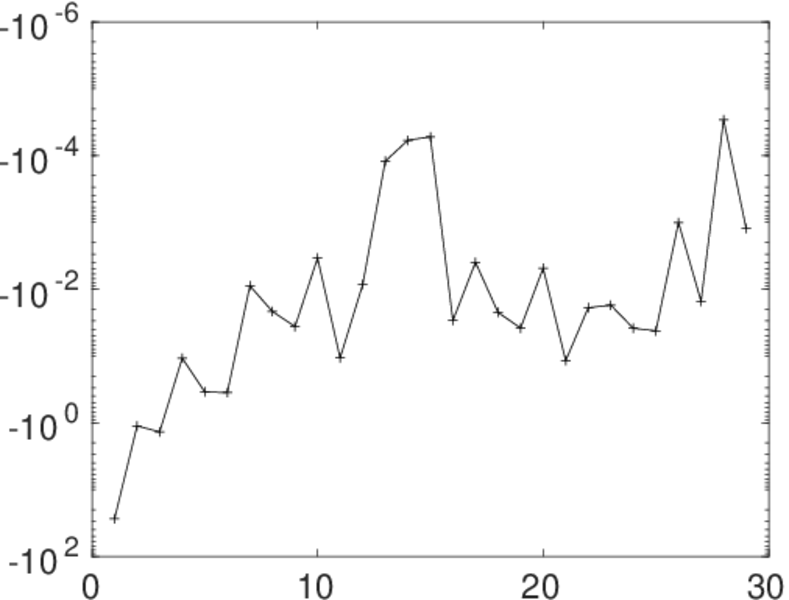
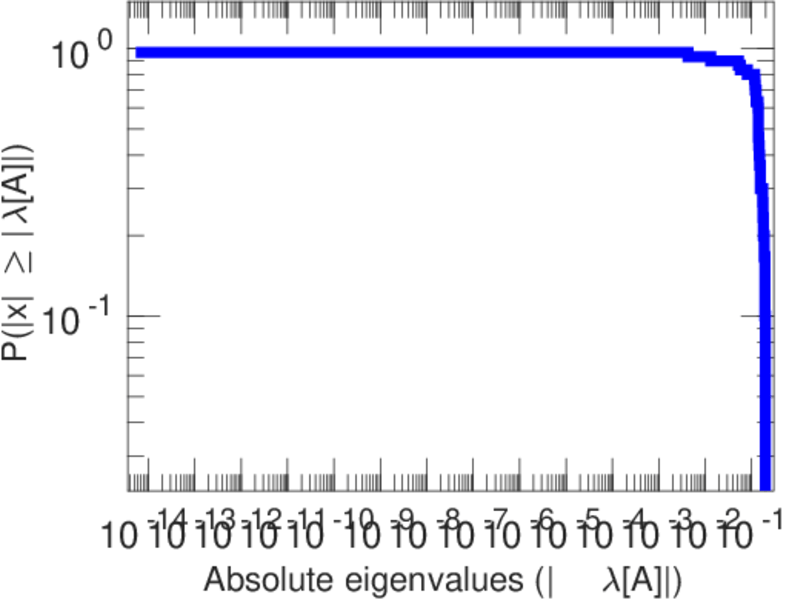
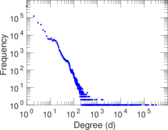
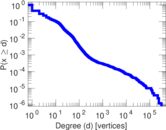
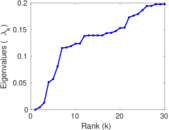
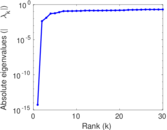
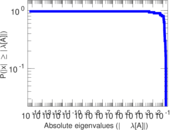
Plots


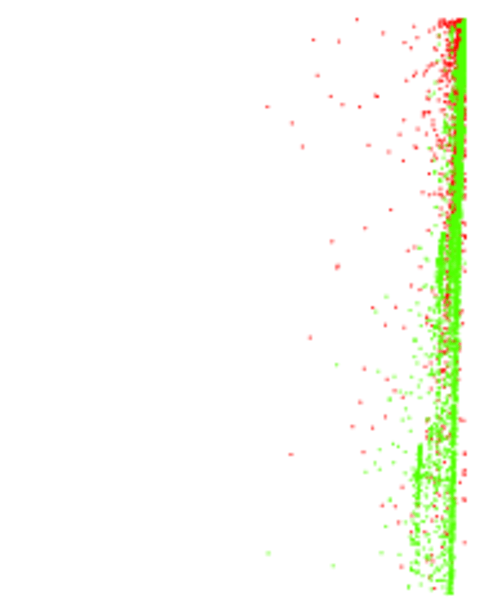
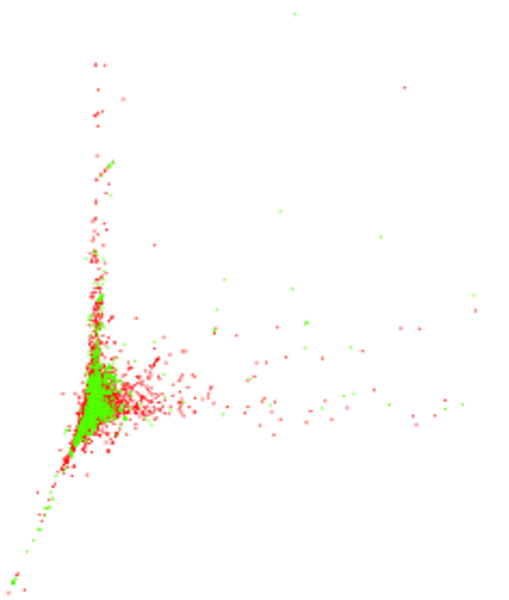
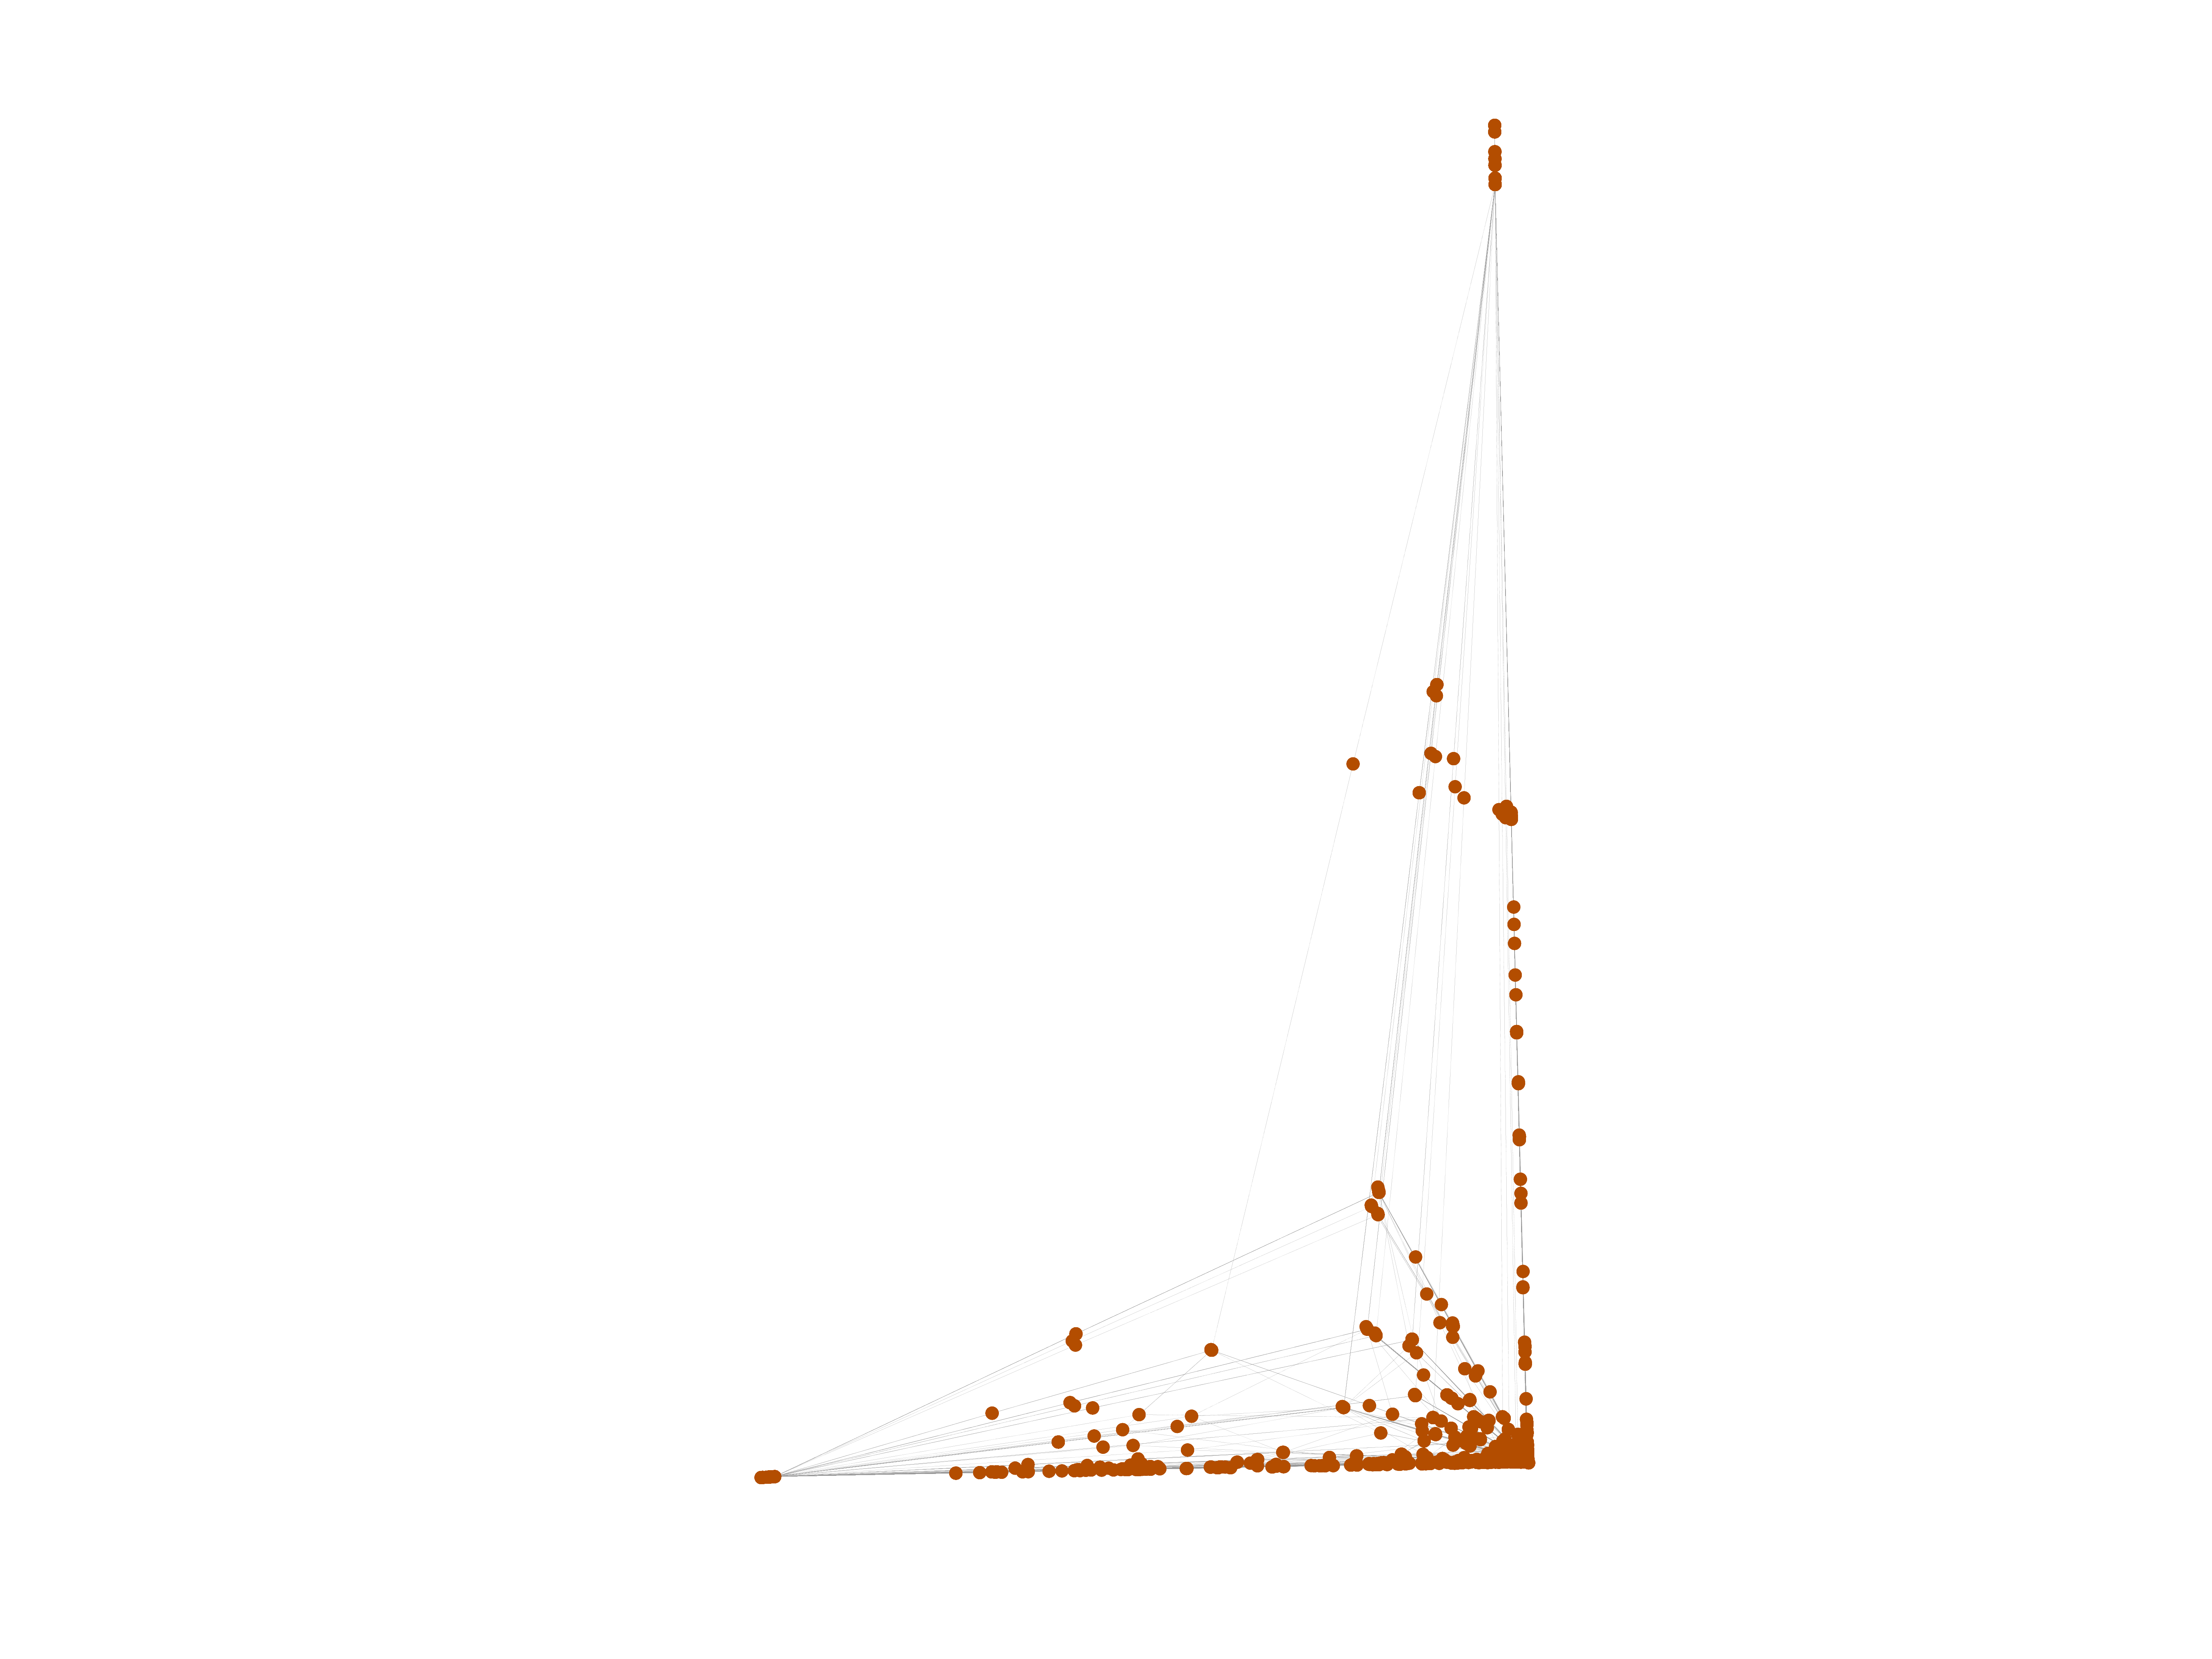
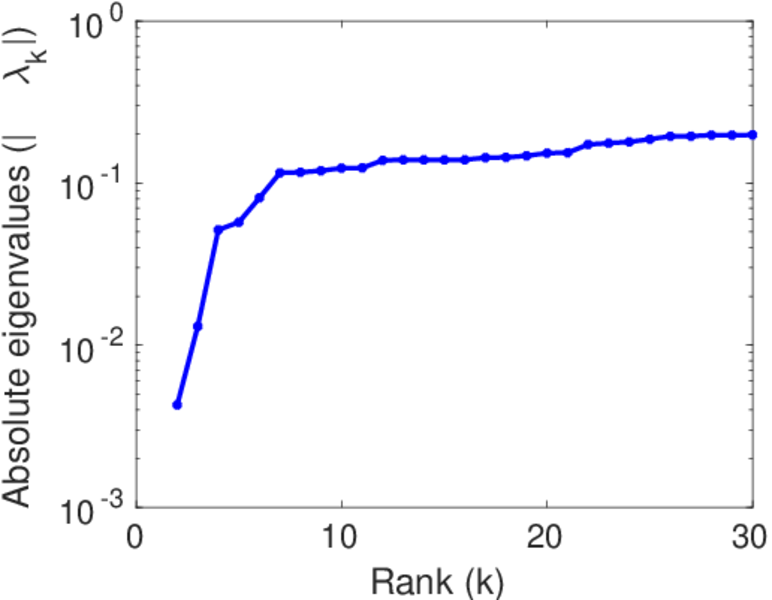
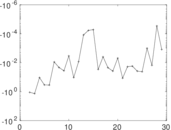
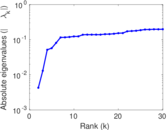
Matrix decompositions plots


Downloads
References
|
[1]
|
Jérôme Kunegis.
KONECT – The Koblenz Network Collection.
In Proc. Int. Conf. on World Wide Web Companion, pages
1343–1350, 2013.
[ http ]
|
|
[2]
|
Wikimedia Foundation.
Wikimedia downloads.
http://dumps.wikimedia.org/, January 2010.
|
 KONECT ‣ Networks ‣
Buy Me a Coffee
KONECT ‣ Networks ‣
Buy Me a Coffee