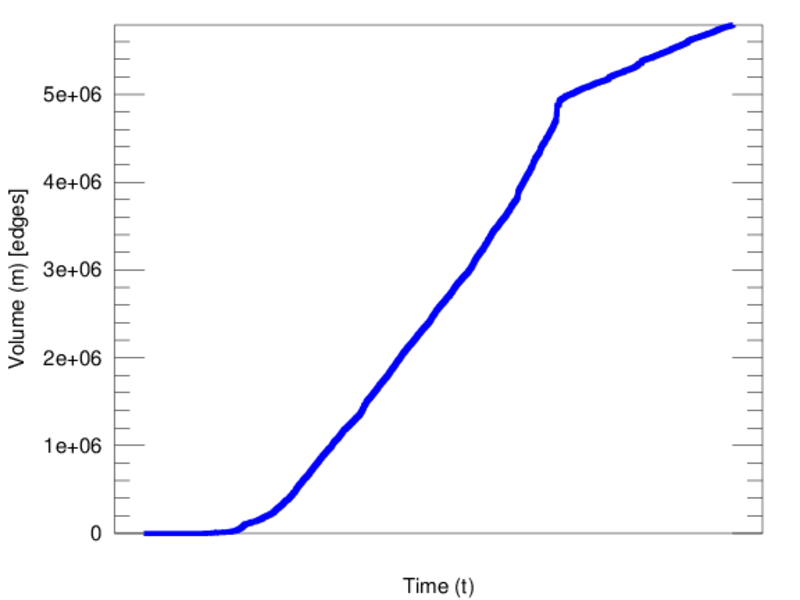
Wikipedia edits (sk)
This is the bipartite edit network of the Slovak Wikipedia. It contains users
and pages from the Slovak Wikipedia, connected by edit events. Each edge
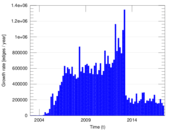
represents an edit. The dataset includes the timestamp of each edit.
Metadata
Statistics
| Size | n = | 504,318
|
| Left size | n1 = | 27,200
|
| Right size | n2 = | 477,118
|
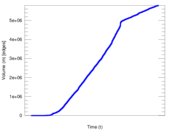
| Volume | m = | 5,788,725
|
| Unique edge count | m̿ = | 3,294,038
|
| Wedge count | s = | 69,534,963,330
|
| Claw count | z = | 1,676,198,805,452,371
|
| Cross count | x = | 3.657 43 × 1019
|
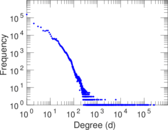
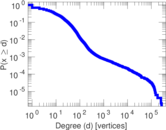
| Maximum degree | dmax = | 265,882
|
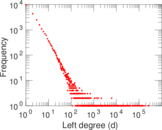
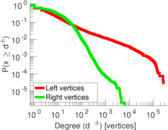
| Maximum left degree | d1max = | 265,882
|
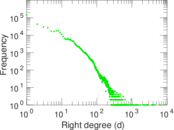
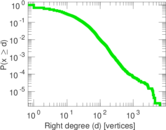
| Maximum right degree | d2max = | 6,326
|
| Average degree | d = | 22.956 6
|
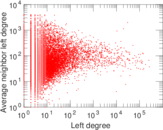
| Average left degree | d1 = | 212.821
|
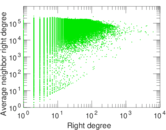
| Average right degree | d2 = | 12.132 7
|
| Average edge multiplicity | m̃ = | 1.757 33
|
| Size of LCC | N = | 499,796
|
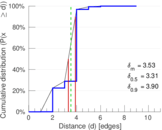
| Diameter | δ = | 11
|
| 50-Percentile effective diameter | δ0.5 = | 3.310 85
|
| 90-Percentile effective diameter | δ0.9 = | 3.899 36
|
| Median distance | δM = | 4
|
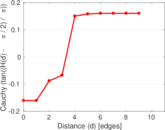
| Mean distance | δm = | 3.525 24
|
| Gini coefficient | G = | 0.834 009
|
| Balanced inequality ratio | P = | 0.167 075
|
| Left balanced inequality ratio | P1 = | 0.031 354 4
|
| Right balanced inequality ratio | P2 = | 0.235 037
|
| Relative edge distribution entropy | Her = | 0.723 298
|
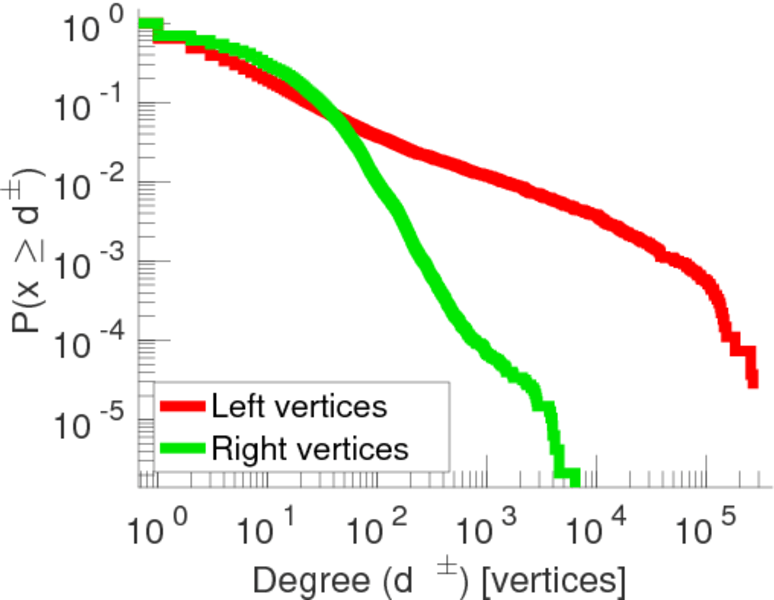
| Power law exponent | γ = | 1.814 97
|
| Tail power law exponent | γt = | 3.191 00
|
| Tail power law exponent with p | γ3 = | 3.191 00
|
| p-value | p = | 0.000 00
|
| Left tail power law exponent with p | γ3,1 = | 1.831 00
|
| Left p-value | p1 = | 0.000 00
|
| Right tail power law exponent with p | γ3,2 = | 4.311 00
|
| Right p-value | p2 = | 0.000 00
|
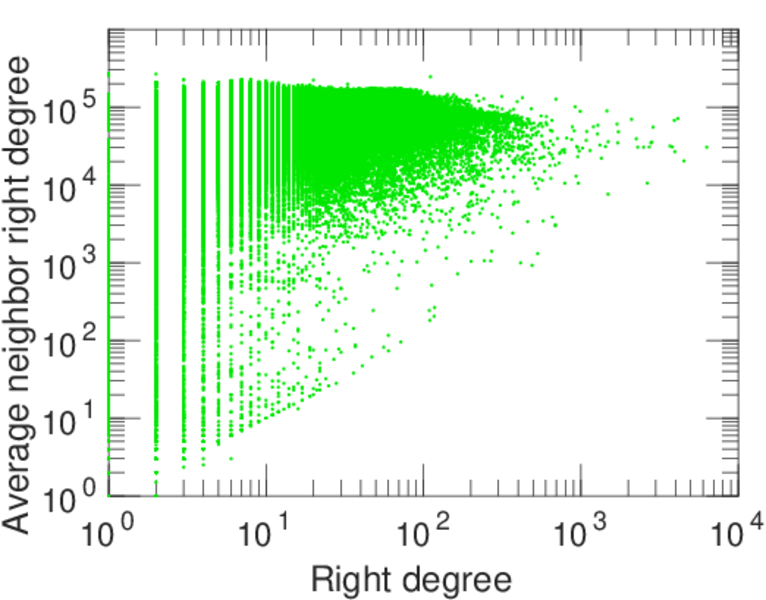
| Degree assortativity | ρ = | −0.156 591
|
| Degree assortativity p-value | pρ = | 0.000 00
|
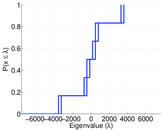
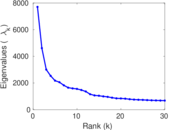
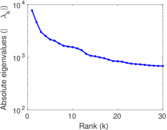
| Spectral norm | α = | 7,702.14
|
| Spectral separation | |λ1[A] / λ2[A]| = | 1.669 69
|
| Controllability | C = | 455,562
|
| Relative controllability | Cr = | 0.906 429
|
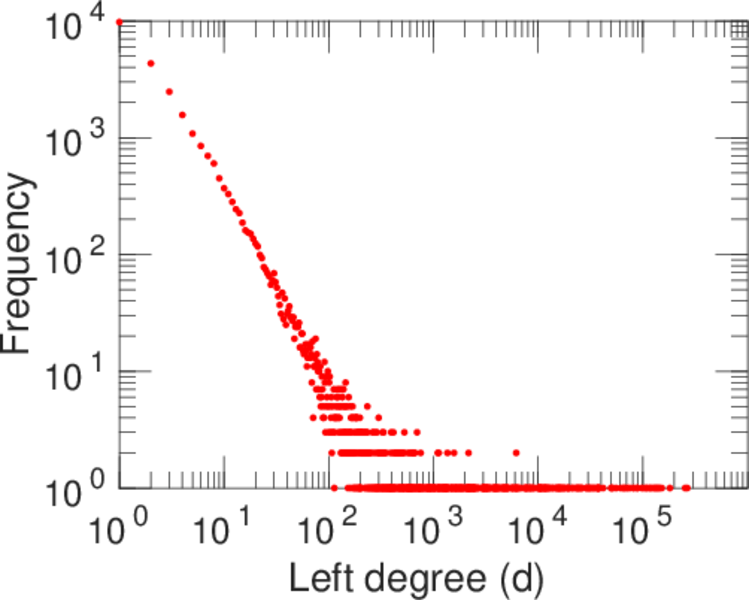
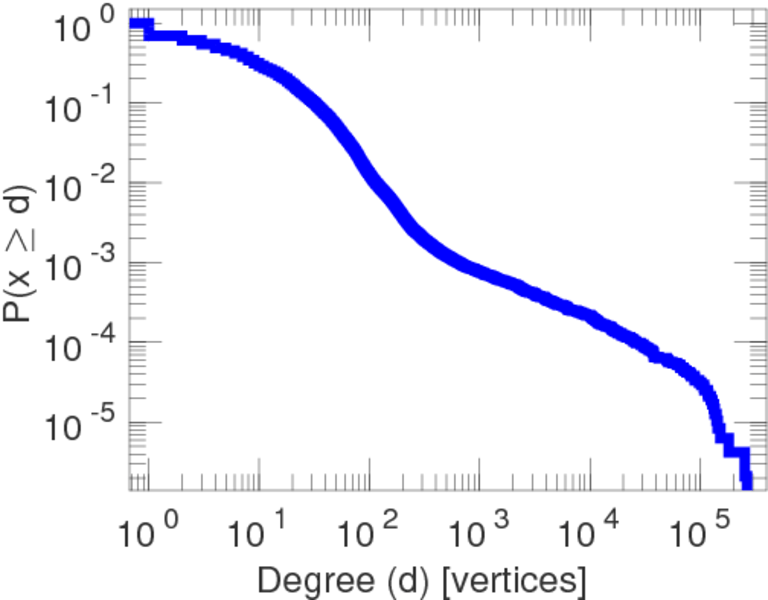
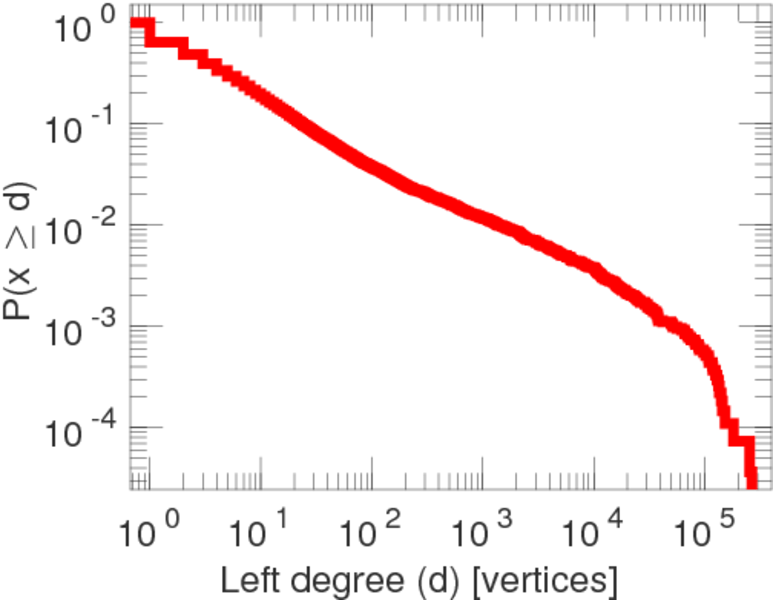
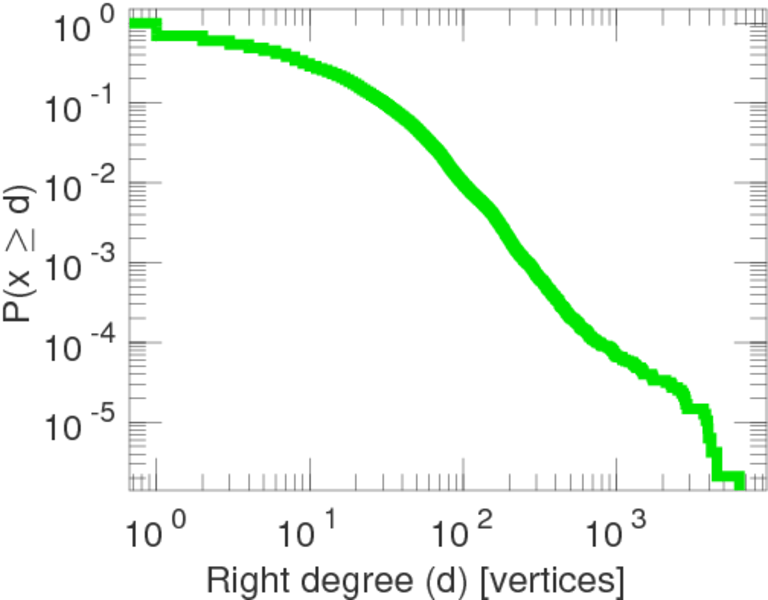
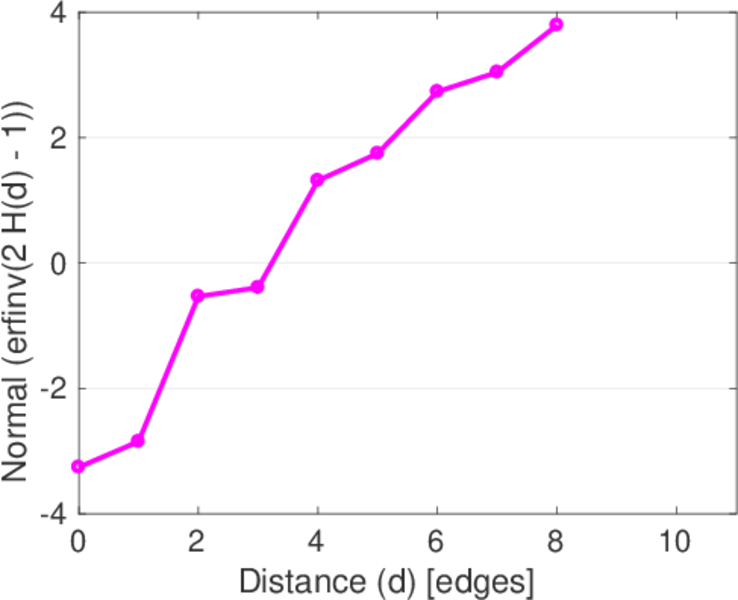
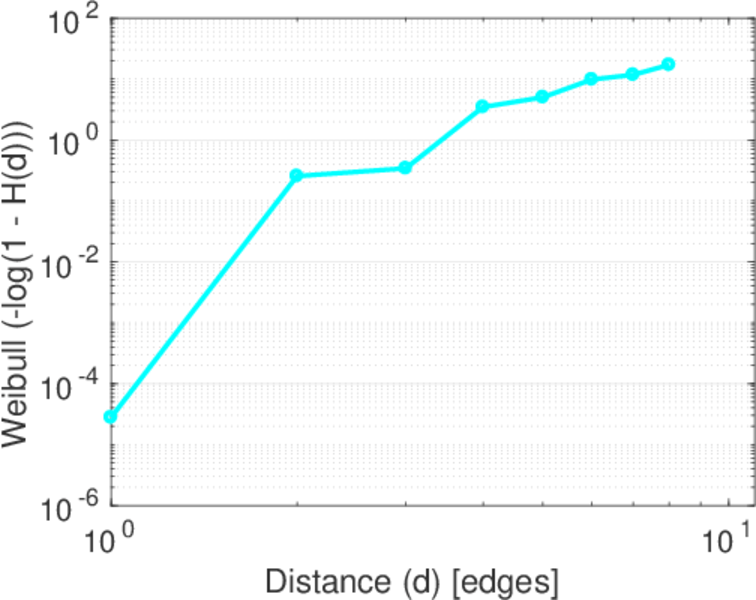
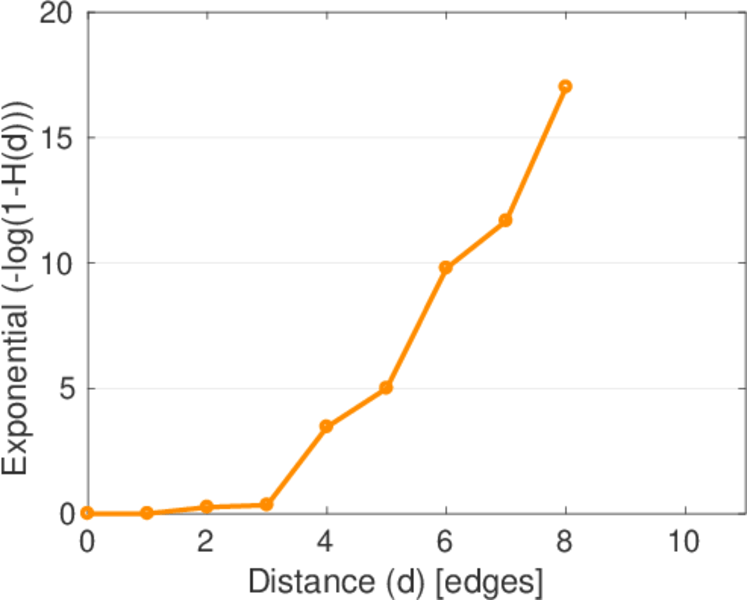
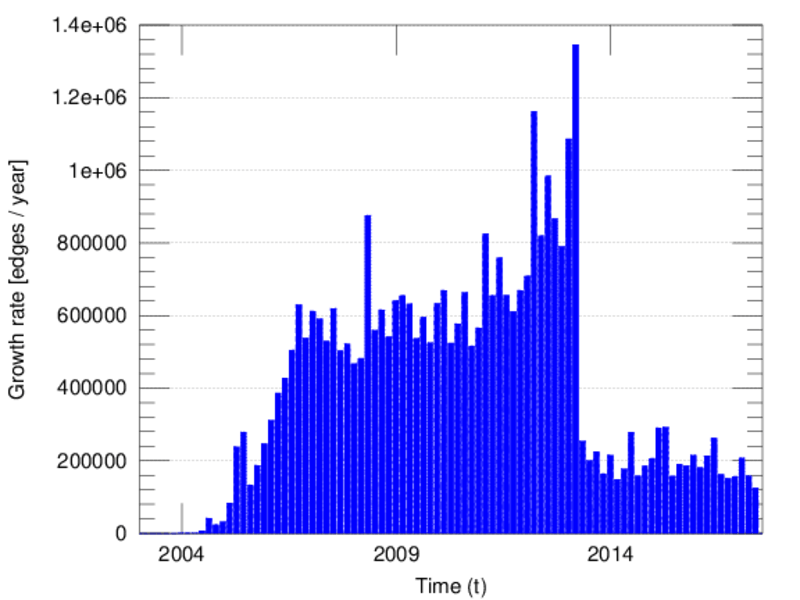
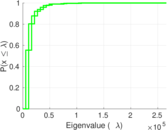
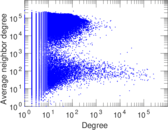
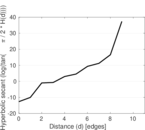
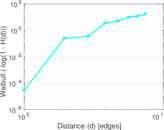
Plots


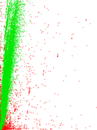
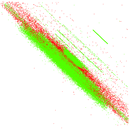


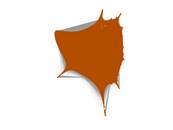


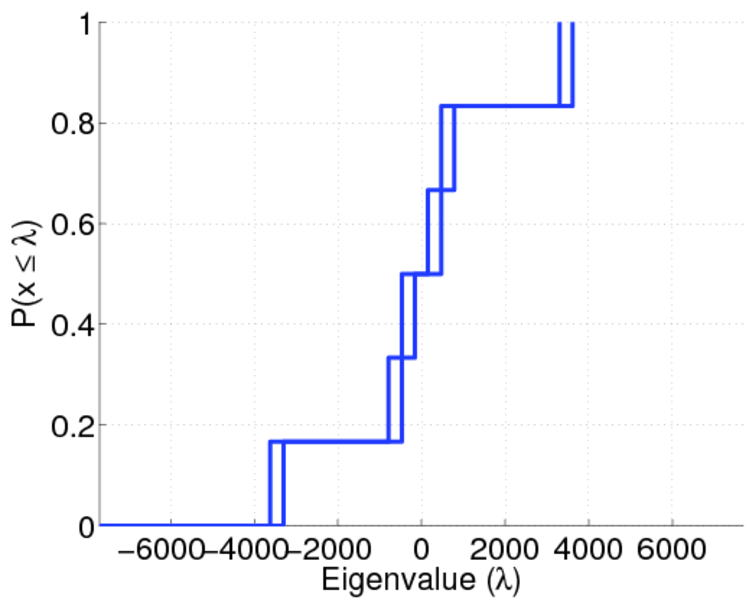
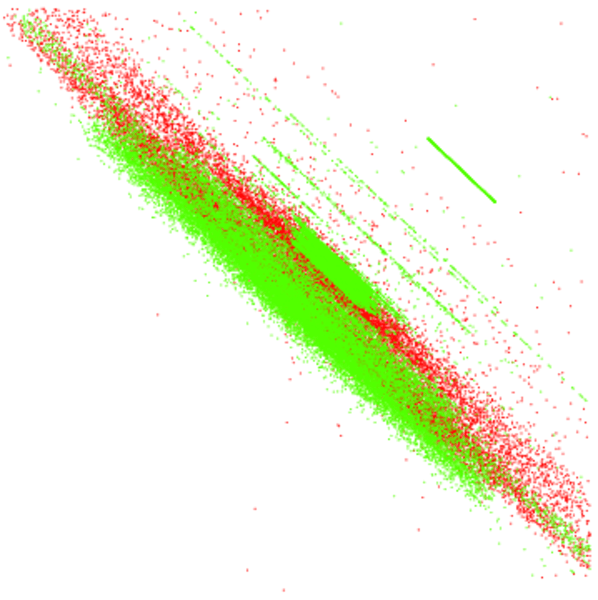
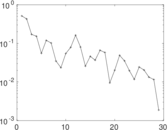
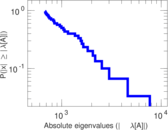
Matrix decompositions plots
Downloads
References
|
[1]
|
Jérôme Kunegis.
KONECT – The Koblenz Network Collection.
In Proc. Int. Conf. on World Wide Web Companion, pages
1343–1350, 2013.
[ http ]
|
|
[2]
|
Wikimedia Foundation.
Wikimedia downloads.
http://dumps.wikimedia.org/, January 2010.
|
 KONECT ‣ Networks ‣
Buy Me a Coffee
KONECT ‣ Networks ‣
Buy Me a Coffee