Wikipedia edits (sl)
This is the bipartite edit network of the Slovenian Wikipedia. It contains
users and pages from the Slovenian Wikipedia, connected by edit events. Each
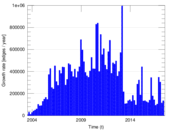
edge represents an edit. The dataset includes the timestamp of each edit.
Metadata
Statistics
| Size | n = | 395,975
|
| Left size | n1 = | 26,292
|
| Right size | n2 = | 369,683
|
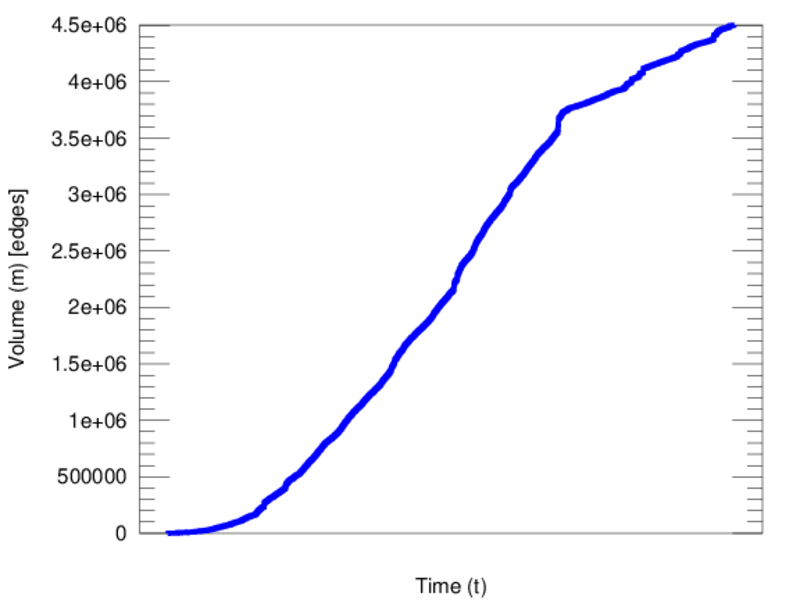
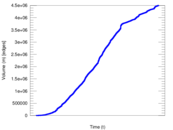
| Volume | m = | 4,501,672
|
| Unique edge count | m̿ = | 2,119,168
|
| Wedge count | s = | 48,843,904,125
|
| Square count | q = | 76,520,405,838
|
| 4-Tour count | T4 = | 807,547,076,744
|
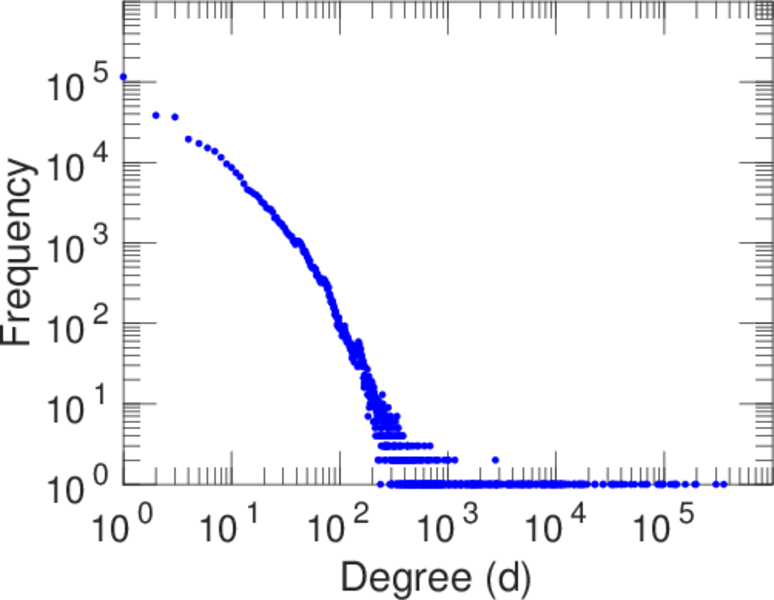
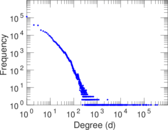
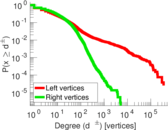
| Maximum degree | dmax = | 354,943
|
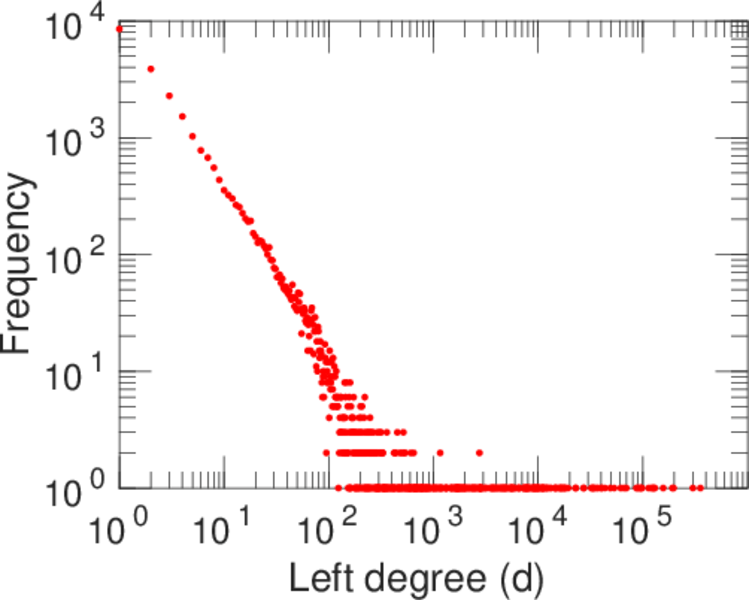
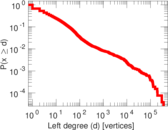
| Maximum left degree | d1max = | 354,943
|
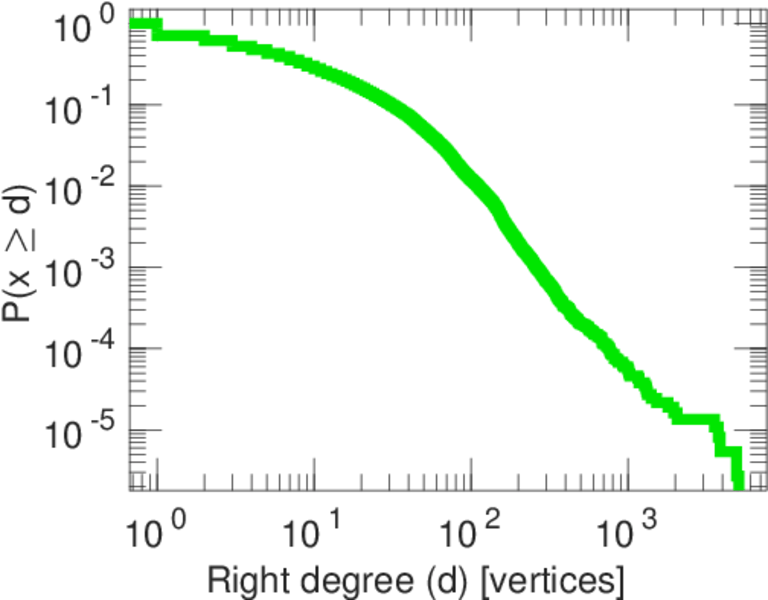
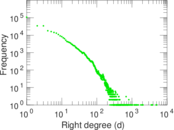
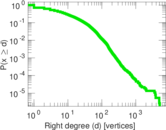
| Maximum right degree | d2max = | 5,086
|
| Average degree | d = | 22.737 2
|
| Average left degree | d1 = | 171.218
|
| Average right degree | d2 = | 12.177 1
|
| Fill | p = | 0.000 218 028
|
| Average edge multiplicity | m̃ = | 2.124 26
|
| Size of LCC | N = | 393,219
|
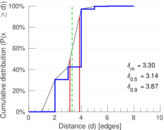
| Diameter | δ = | 11
|
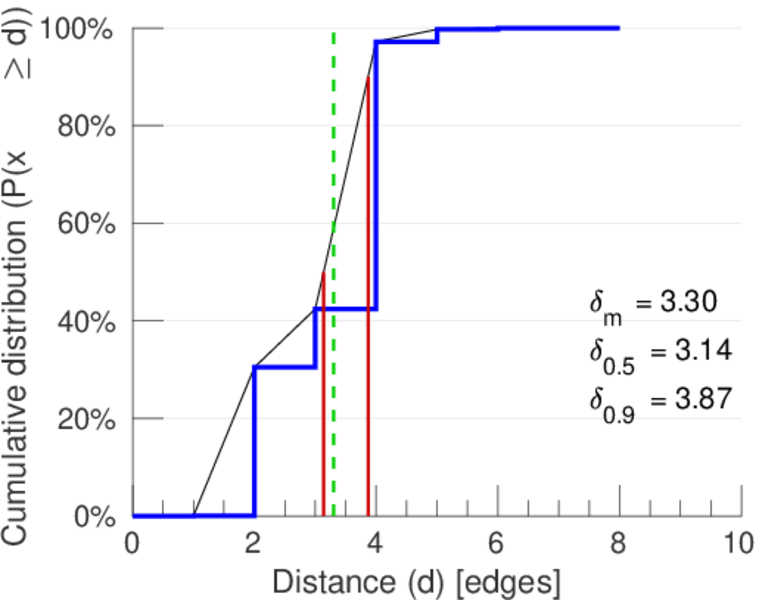
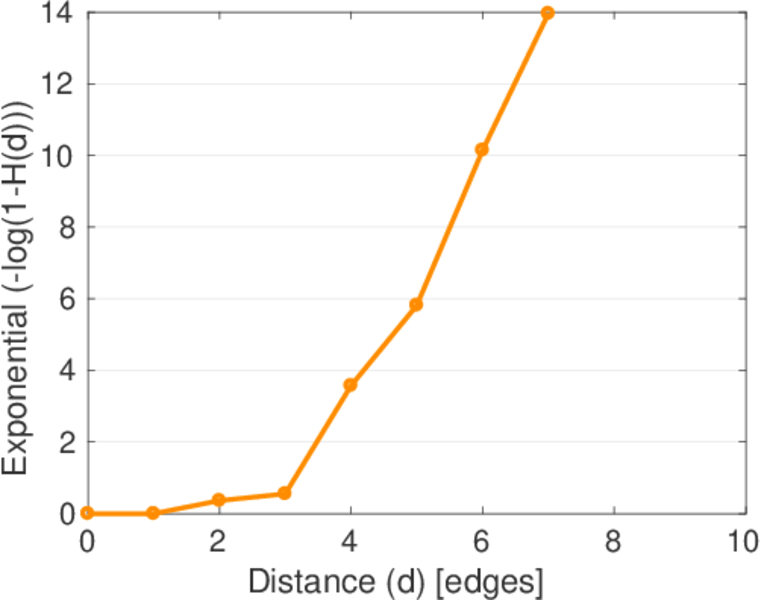
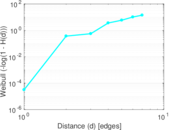
| 50-Percentile effective diameter | δ0.5 = | 3.138 40
|
| 90-Percentile effective diameter | δ0.9 = | 3.868 67
|
| Median distance | δM = | 4
|
| Mean distance | δm = | 3.302 36
|
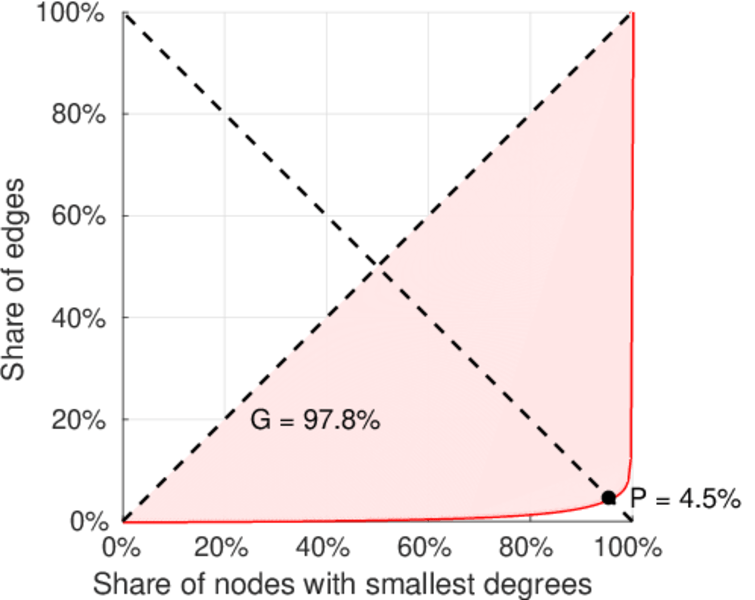
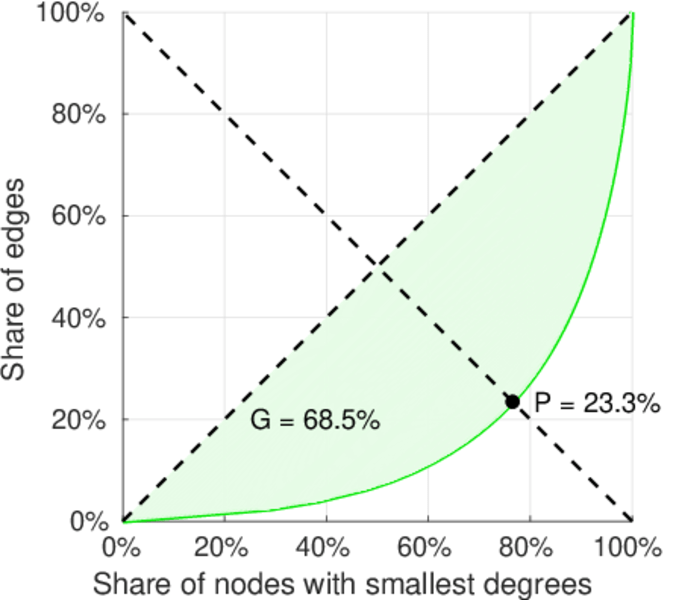
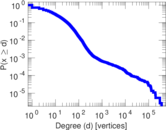
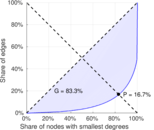
| Gini coefficient | G = | 0.835 585
|
| Balanced inequality ratio | P = | 0.165 174
|
| Left balanced inequality ratio | P1 = | 0.044 801 8
|
| Right balanced inequality ratio | P2 = | 0.233 079
|
| Relative edge distribution entropy | Her = | 0.714 967
|
| Tail power law exponent | γt = | 3.241 00
|
| Tail power law exponent with p | γ3 = | 3.241 00
|
| p-value | p = | 0.000 00
|
| Left tail power law exponent with p | γ3,1 = | 1.841 00
|
| Left p-value | p1 = | 0.000 00
|
| Right tail power law exponent with p | γ3,2 = | 4.801 00
|
| Right p-value | p2 = | 0.000 00
|
| Degree assortativity | ρ = | −0.142 905
|
| Degree assortativity p-value | pρ = | 0.000 00
|
| Algebraic connectivity | a = | 0.095 531 1
|
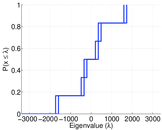
| Spectral separation | |λ1[A] / λ2[A]| = | 1.276 93
|
| Controllability | C = | 350,988
|
| Relative controllability | Cr = | 0.887 620
|
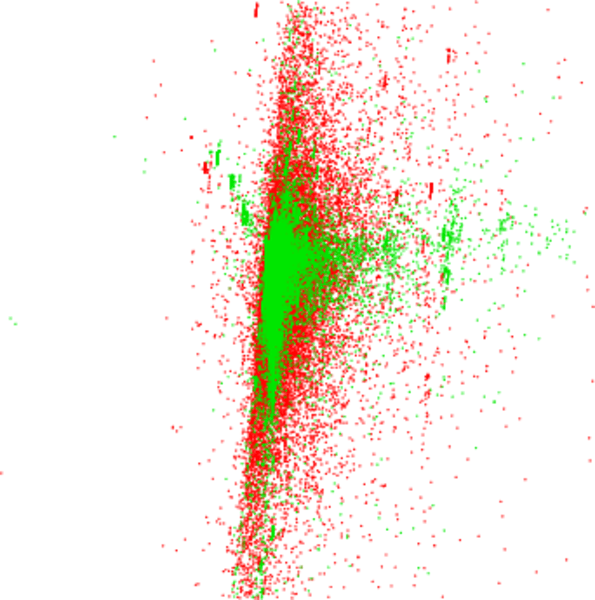
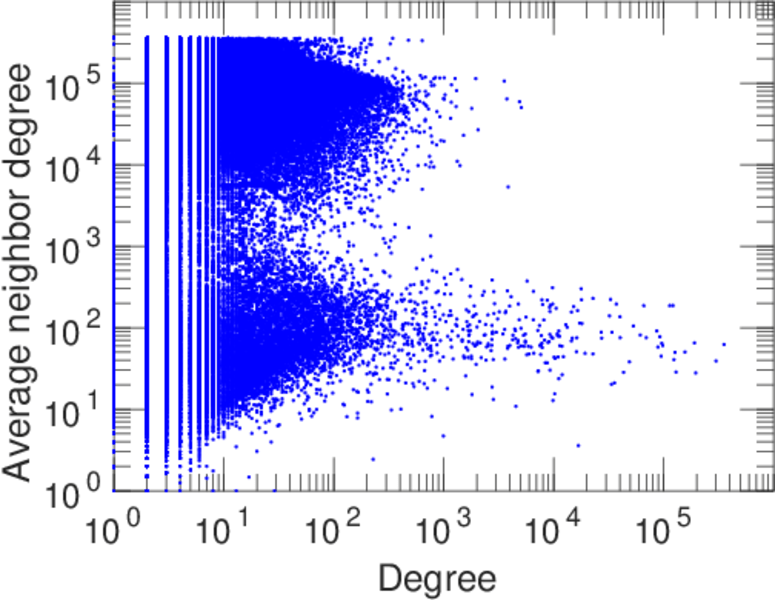
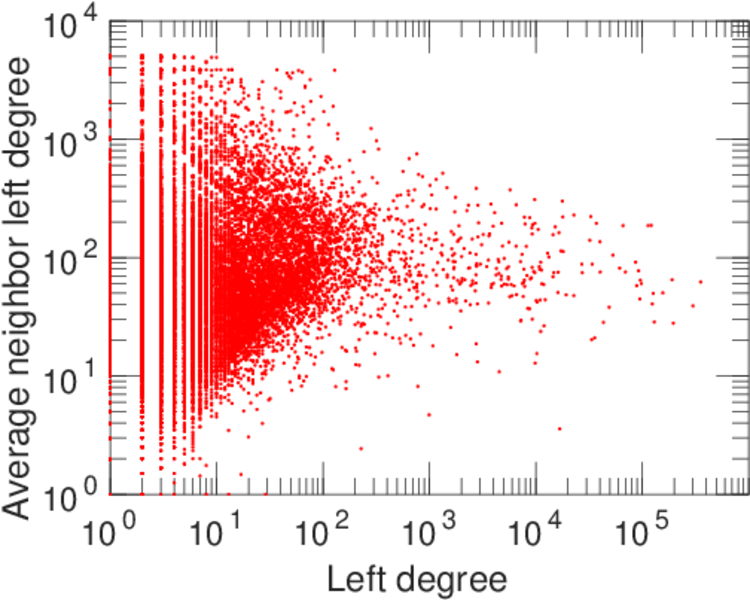
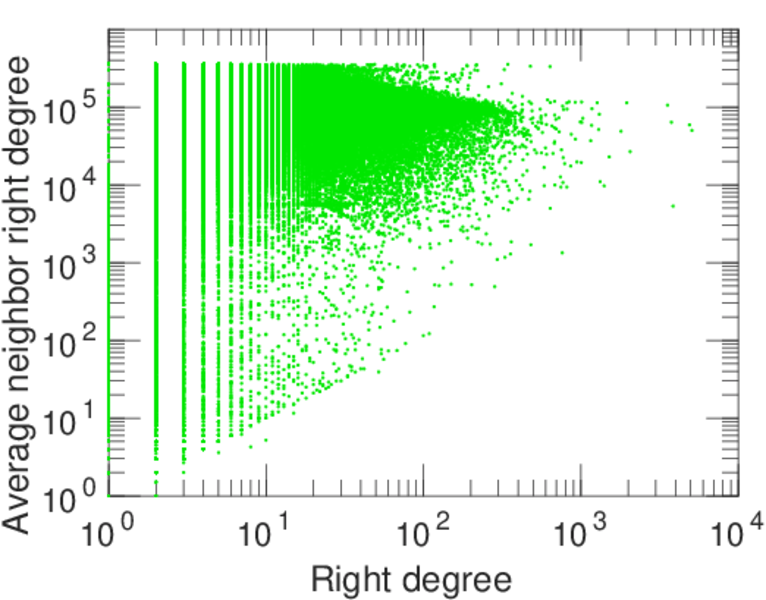
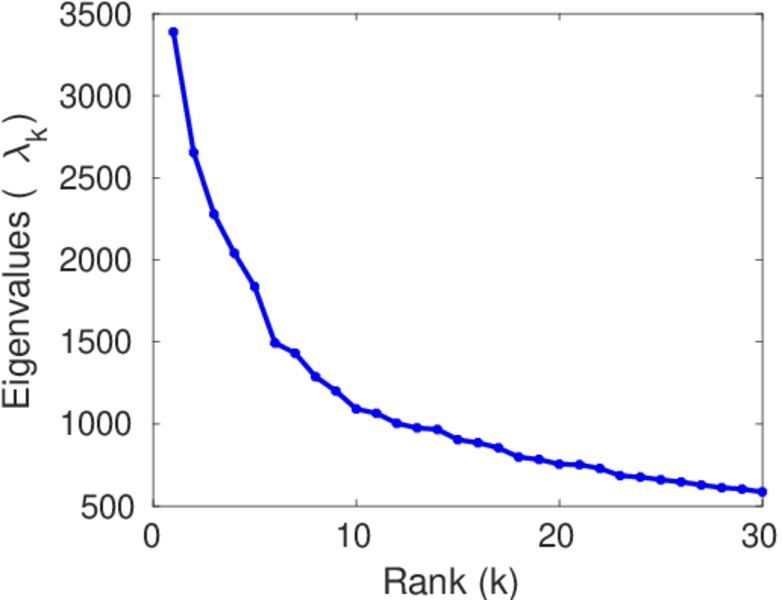
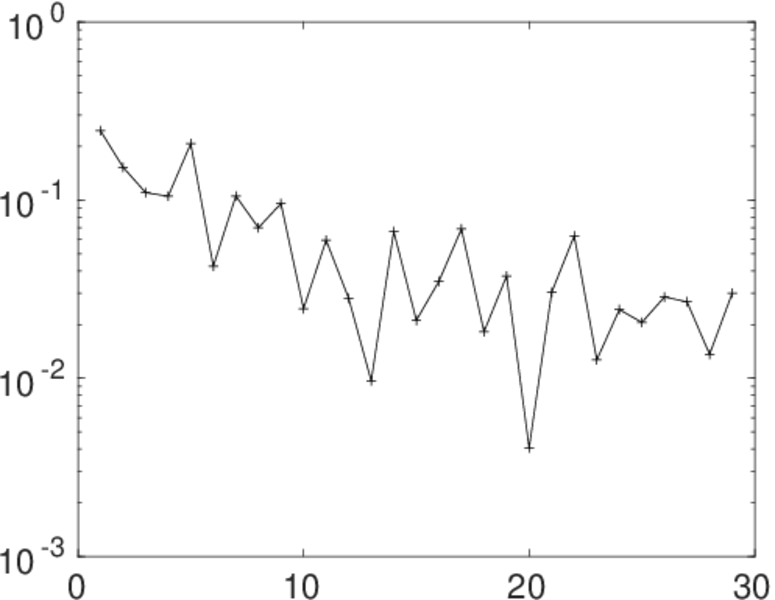
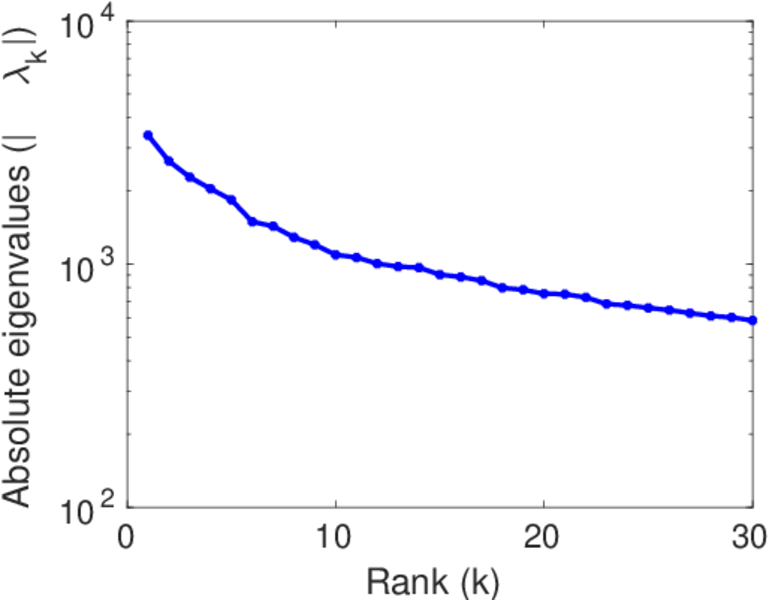
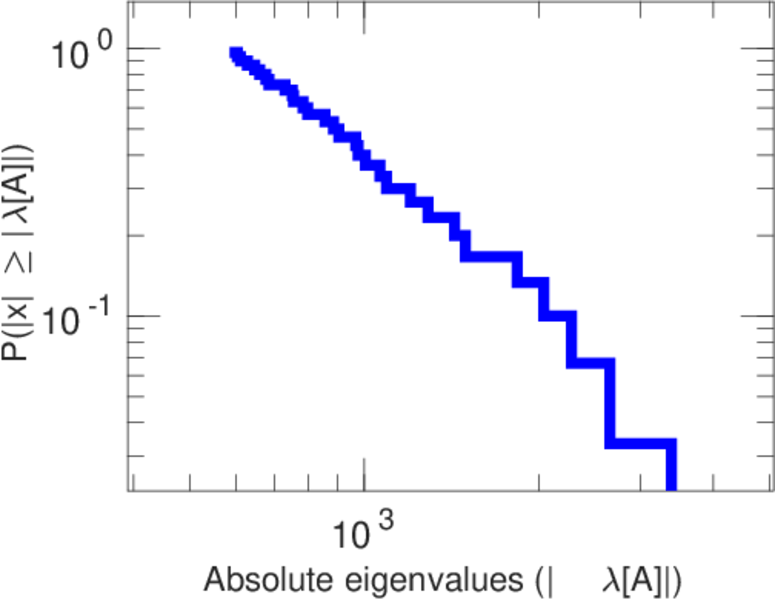
Plots


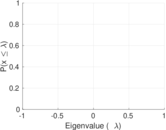
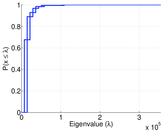
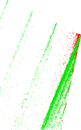
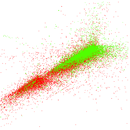


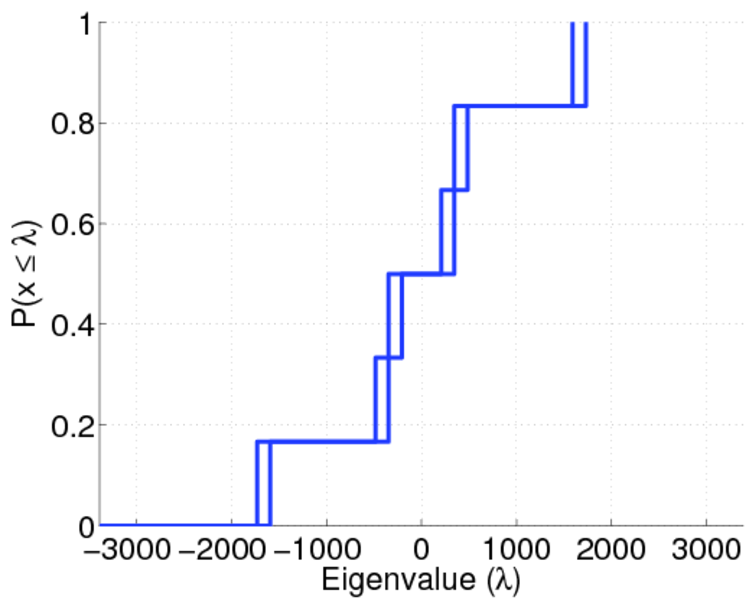
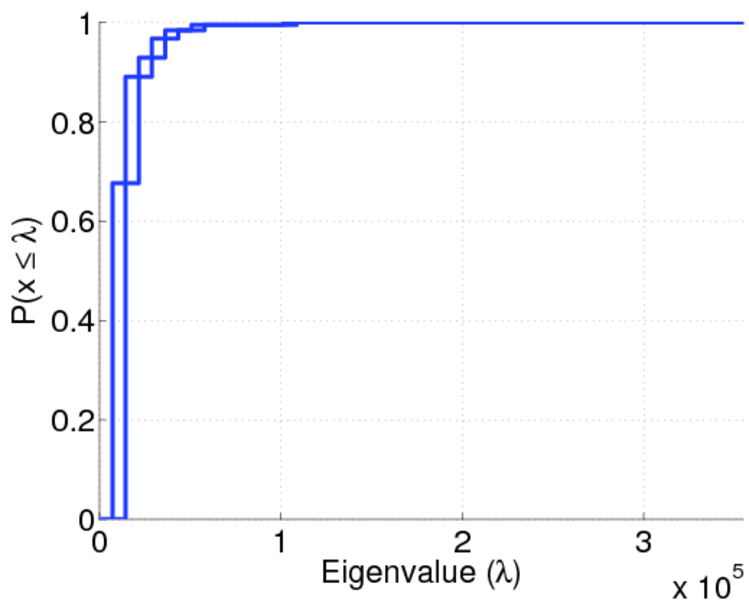
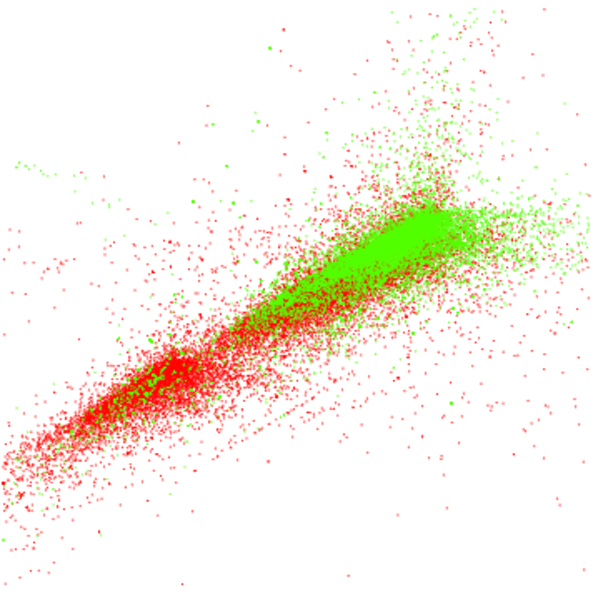
Matrix decompositions plots


Downloads
References
|
[1]
|
Jérôme Kunegis.
KONECT – The Koblenz Network Collection.
In Proc. Int. Conf. on World Wide Web Companion, pages
1343–1350, 2013.
[ http ]
|
|
[2]
|
Wikimedia Foundation.
Wikimedia downloads.
http://dumps.wikimedia.org/, January 2010.
|
 KONECT ‣ Networks ‣
Buy Me a Coffee
KONECT ‣ Networks ‣
Buy Me a Coffee