Wikipedia edits (war)
This is the bipartite edit network of the Waray Wikipedia. It contains users
and pages from the Waray Wikipedia, connected by edit events. Each edge
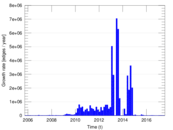
represents an edit. The dataset includes the timestamp of each edit.
Metadata
Statistics
| Size | n = | 2,877,072
|
| Left size | n1 = | 3,050
|
| Right size | n2 = | 2,874,022
|
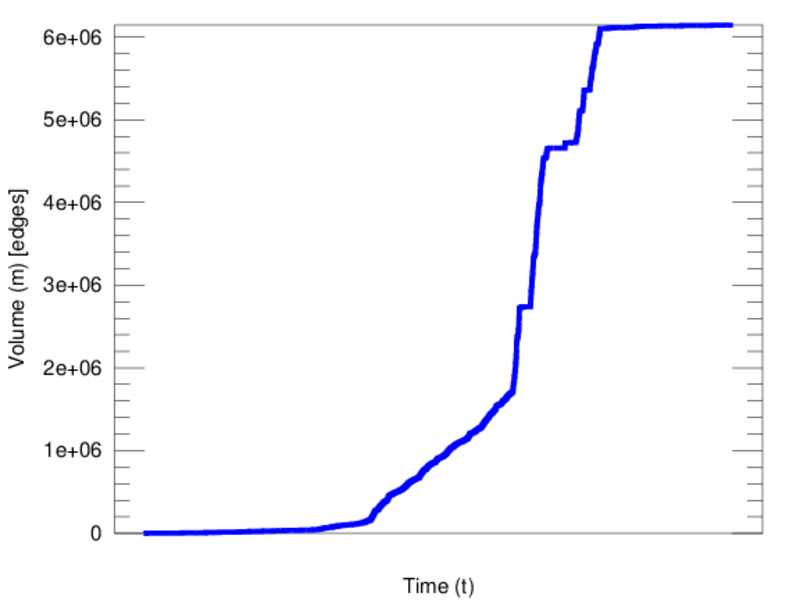
| Volume | m = | 6,145,080
|
| Unique edge count | m̿ = | 5,143,659
|
| Wedge count | s = | 4,144,698,774,052
|
| Claw count | z = | 3,396,947,893,824,874,496
|
| Cross count | x = | 2.222 9 × 1024
|
| Maximum degree | dmax = | 3,013,716
|
| Maximum left degree | d1max = | 3,013,716
|
| Maximum right degree | d2max = | 1,591
|
| Average degree | d = | 4.271 76
|
| Average left degree | d1 = | 2,014.78
|
| Average right degree | d2 = | 2.138 15
|
| Fill | p = | 0.000 586 789
|
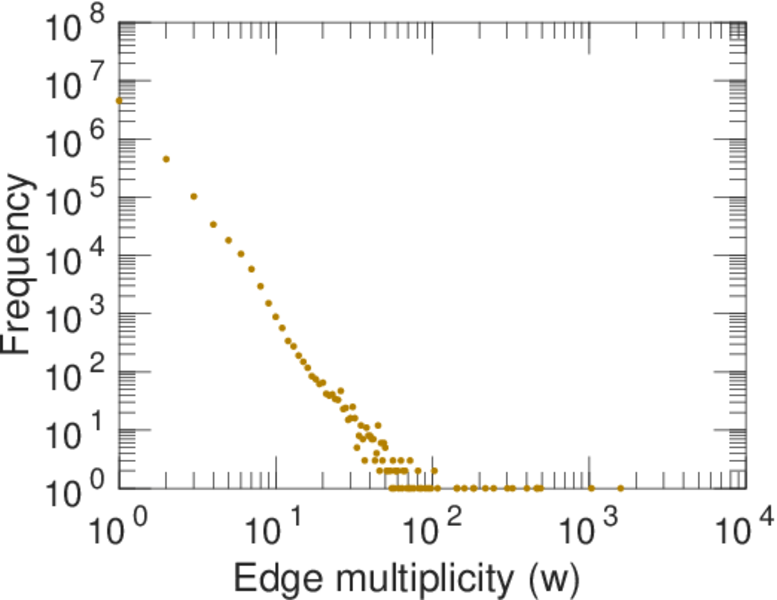
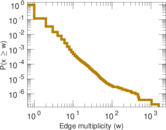
| Average edge multiplicity | m̃ = | 1.194 69
|
| Size of LCC | N = | 2,873,122
|
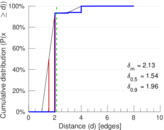
| Diameter | δ = | 12
|
| 50-Percentile effective diameter | δ0.5 = | 1.535 92
|
| 90-Percentile effective diameter | δ0.9 = | 1.964 66
|
| Median distance | δM = | 2
|
| Mean distance | δm = | 2.128 39
|
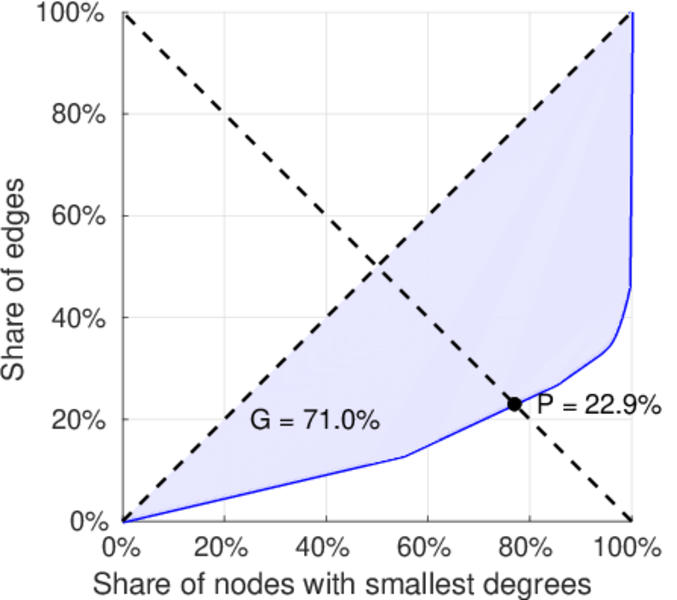
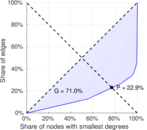
| Gini coefficient | G = | 0.710 560
|
| Balanced inequality ratio | P = | 0.228 310
|
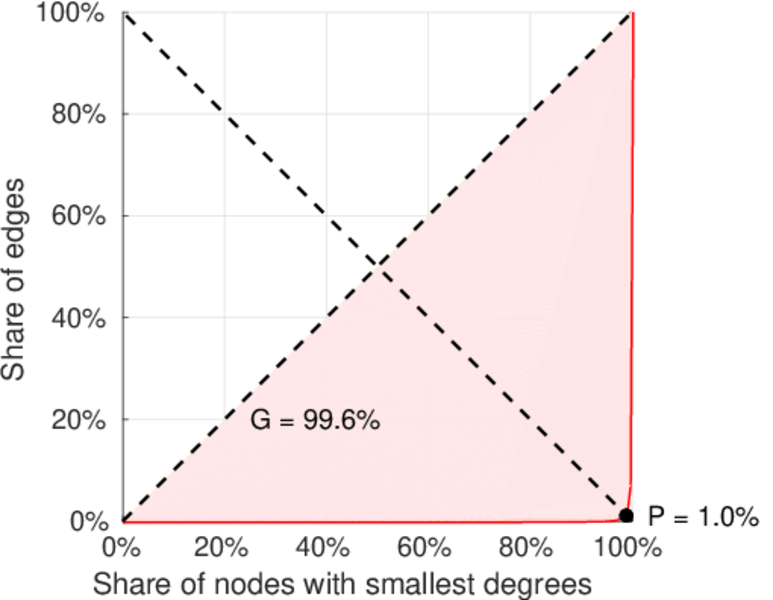
| Left balanced inequality ratio | P1 = | 0.009 783 92
|
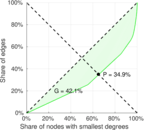
| Right balanced inequality ratio | P2 = | 0.349 013
|
| Relative edge distribution entropy | Her = | 0.603 669
|
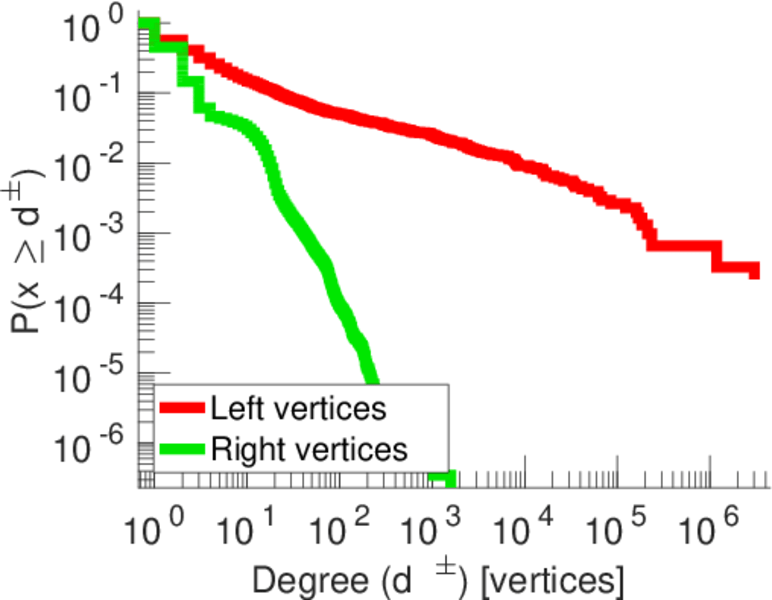
| Power law exponent | γ = | 3.648 37
|
| Tail power law exponent | γt = | 4.911 00
|
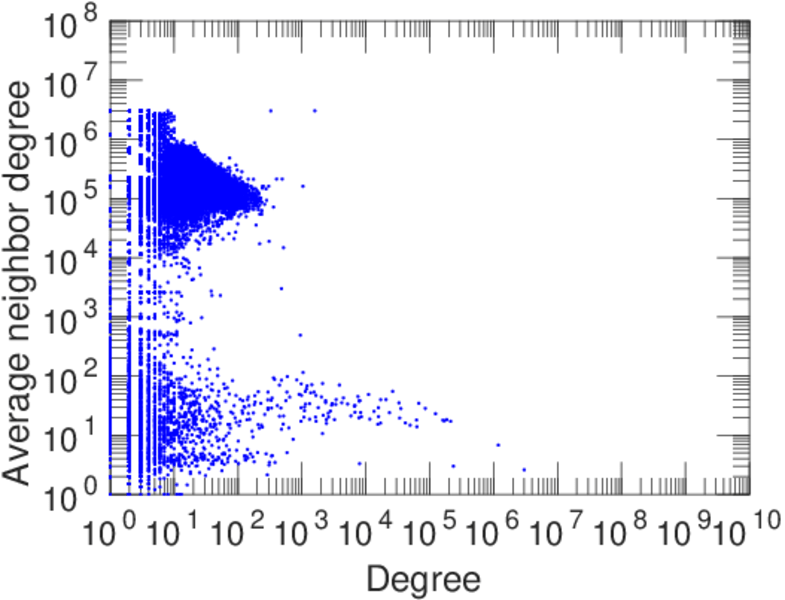
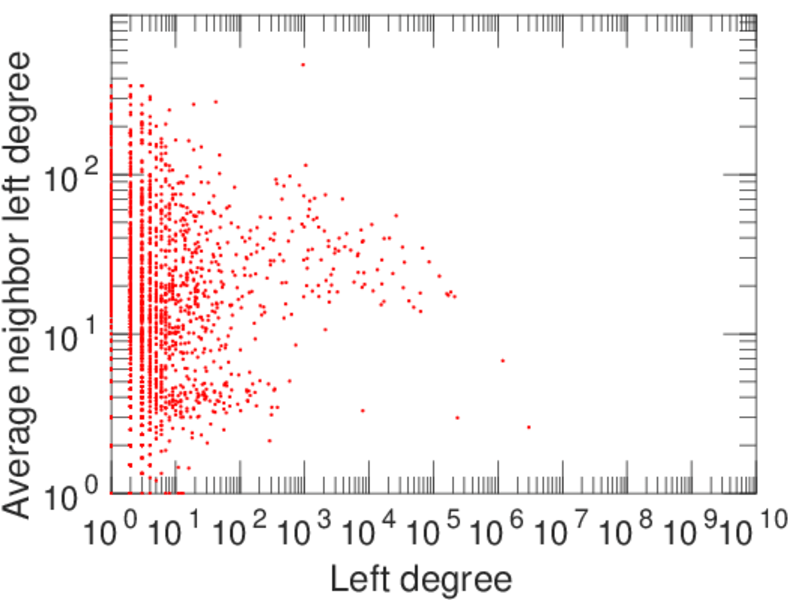
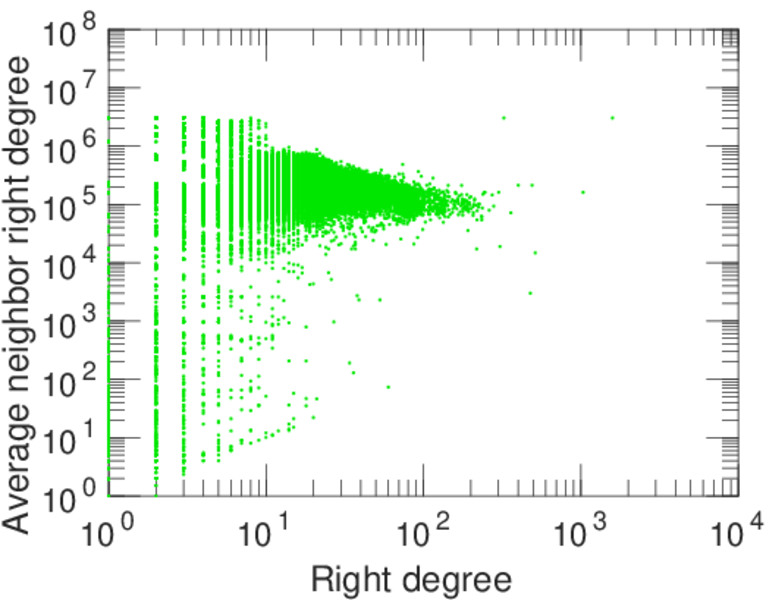
| Degree assortativity | ρ = | −0.628 441
|
| Degree assortativity p-value | pρ = | 0.000 00
|
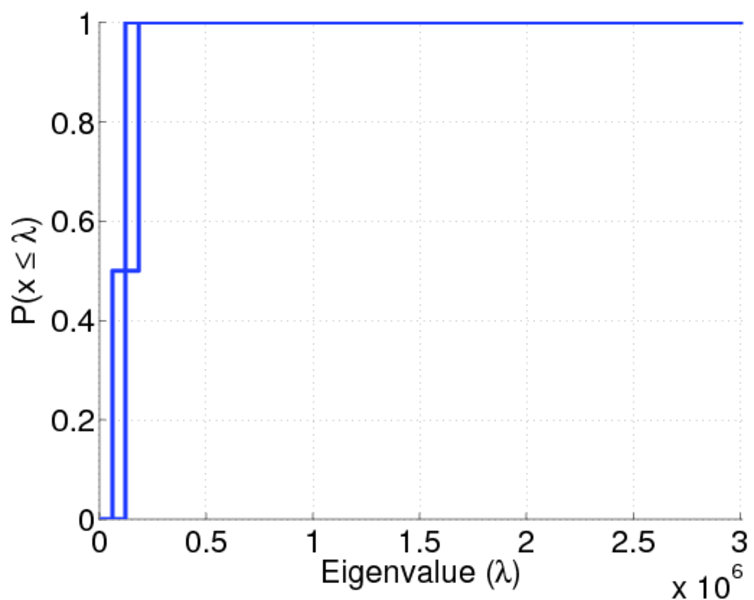
| Spectral norm | α = | 2,565.68
|
| Algebraic connectivity | a = | 0.039 600 9
|
| Spectral separation | |λ1[A] / λ2[A]| = | 1.469 92
|
| Controllability | C = | 2,868,046
|
| Relative controllability | Cr = | 0.997 962
|
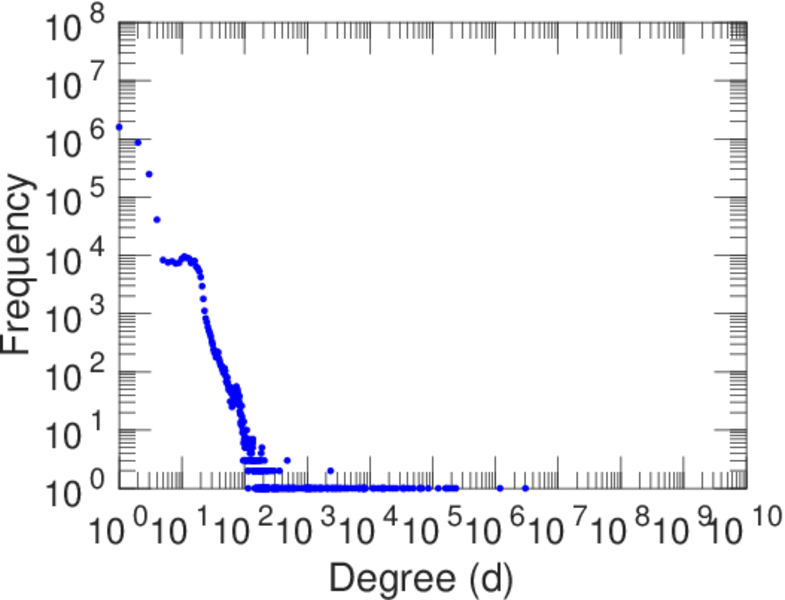
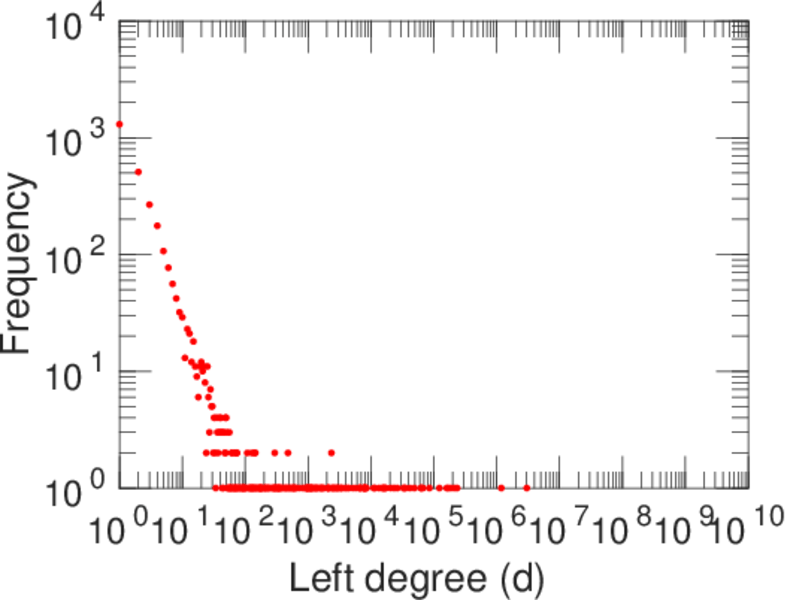
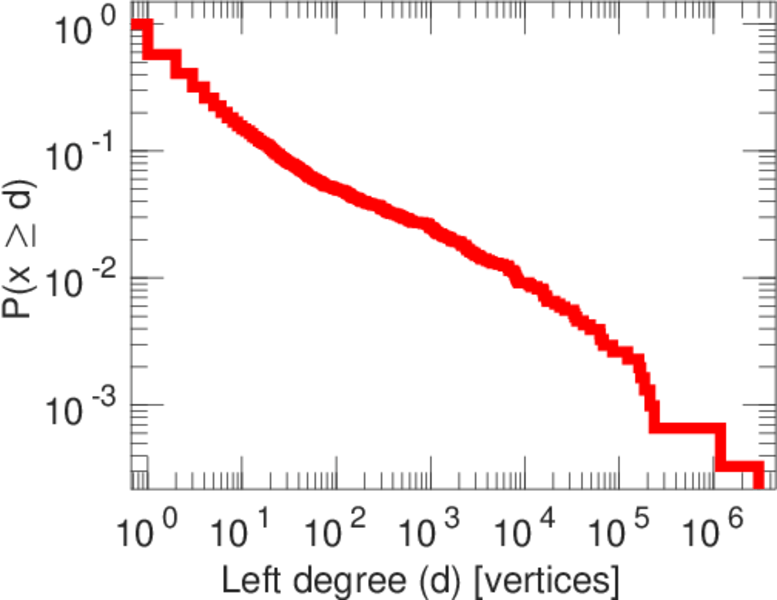
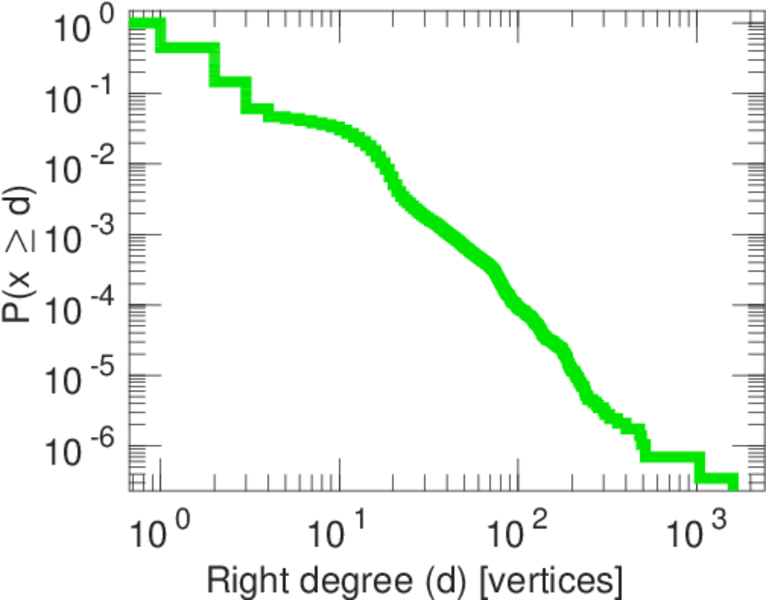
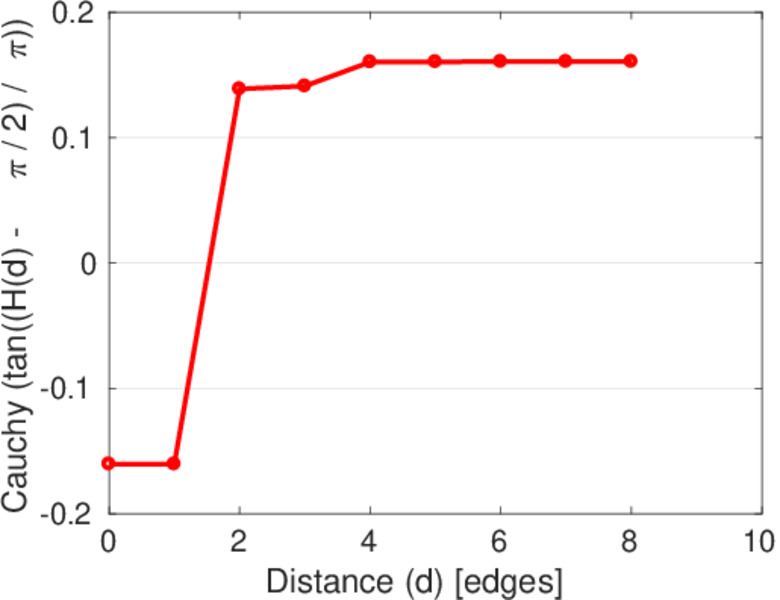
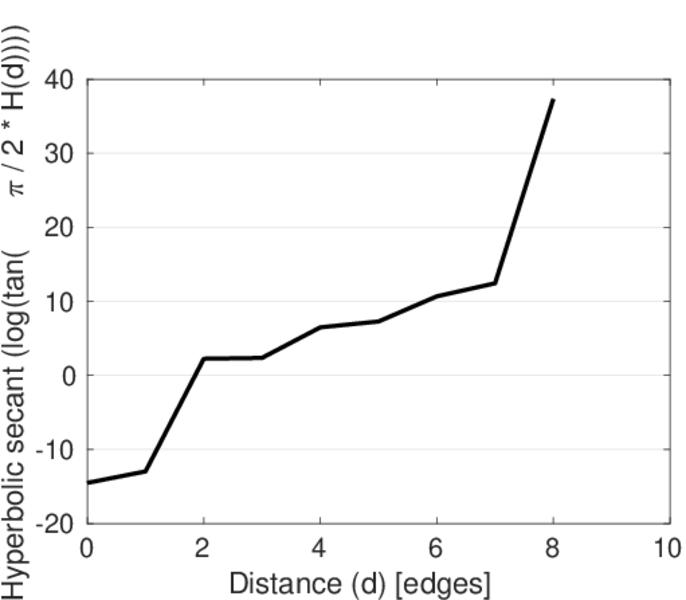
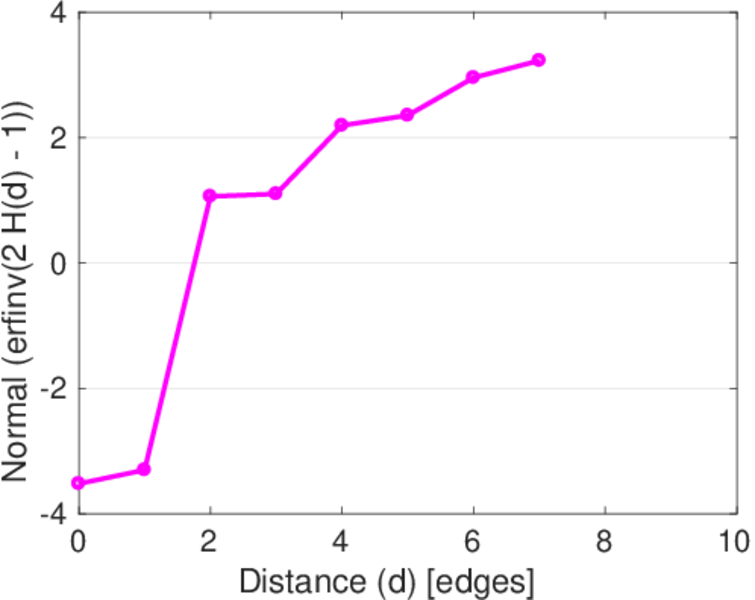
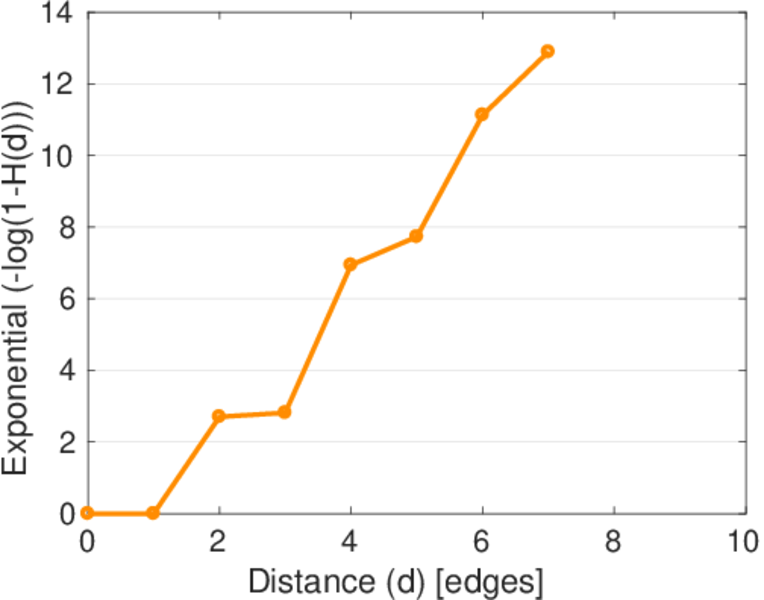
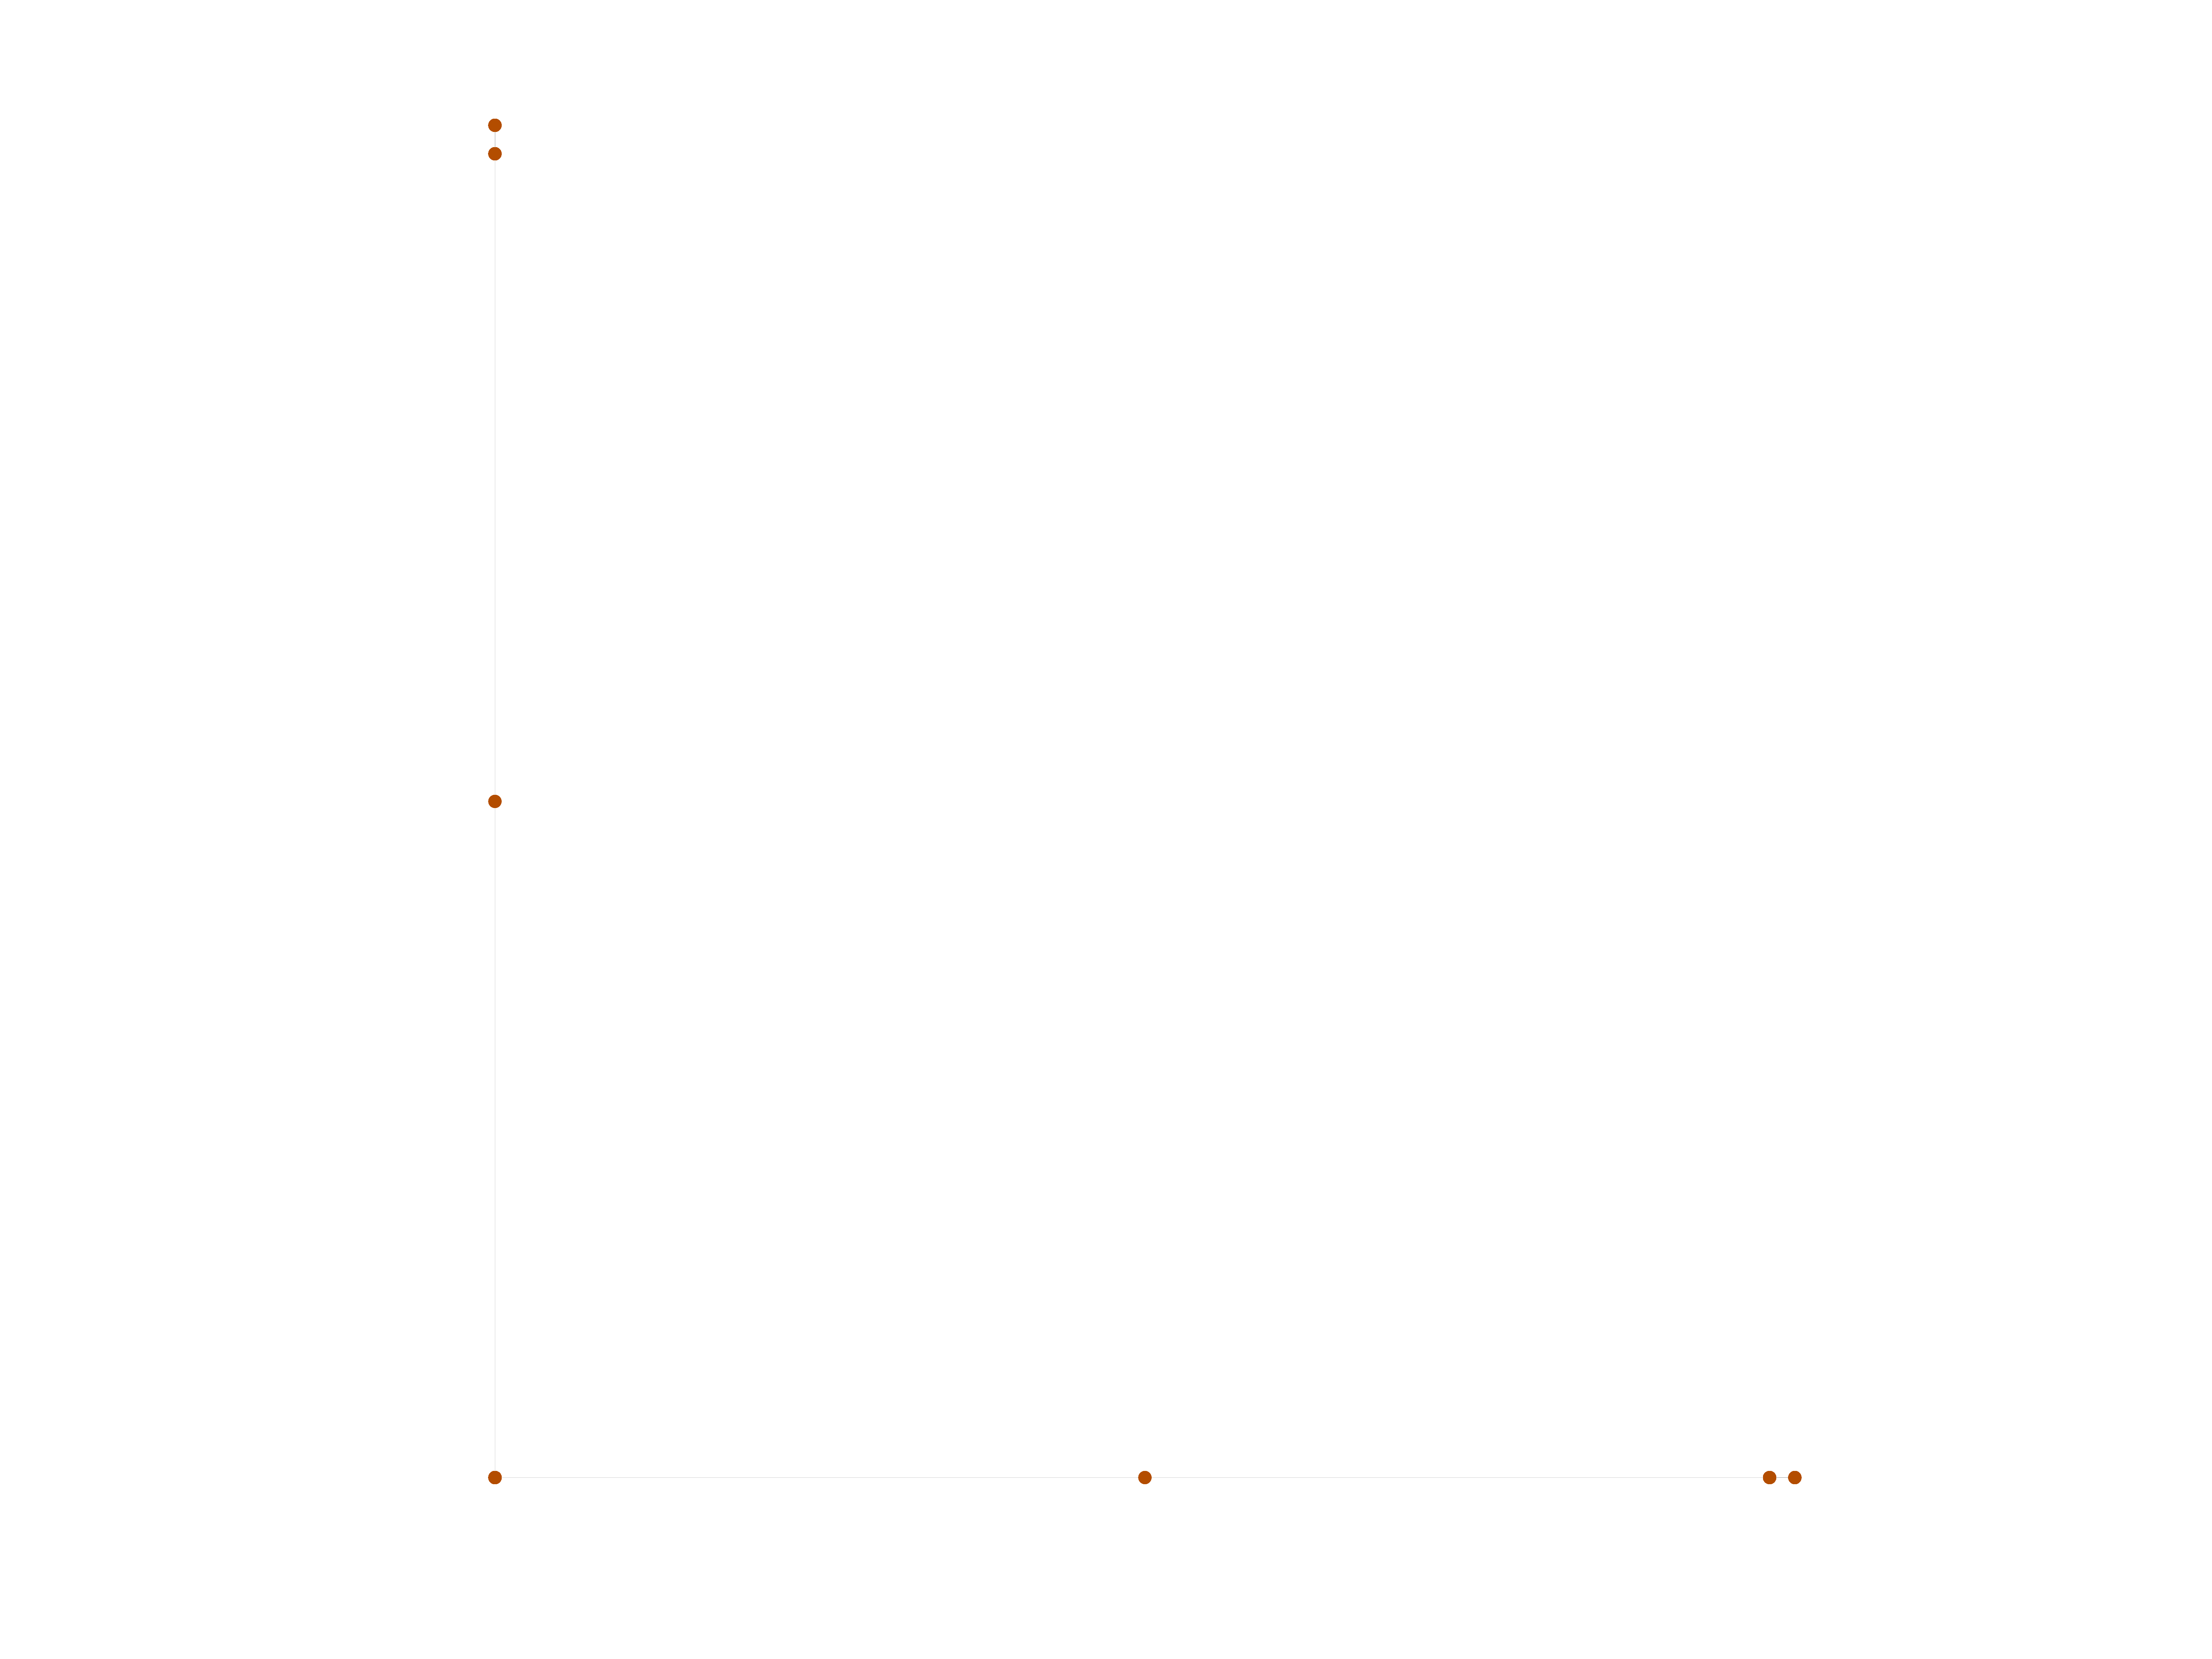
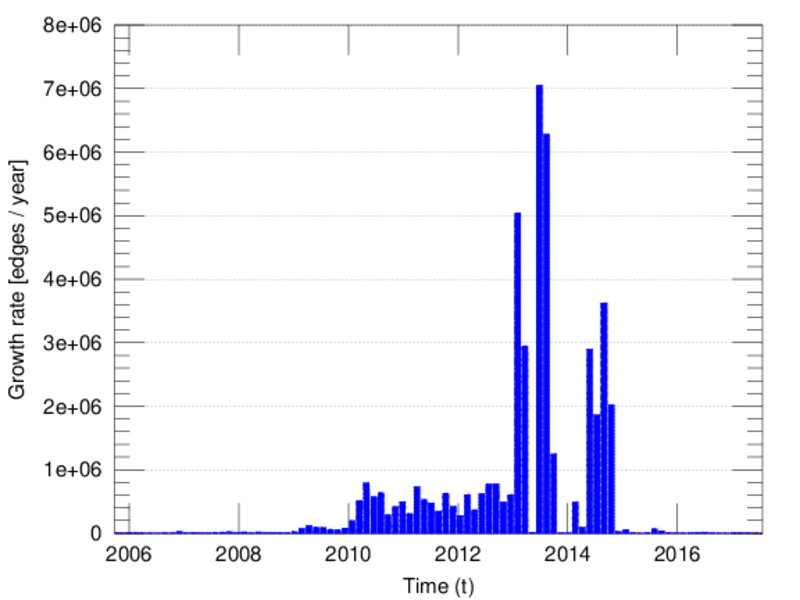
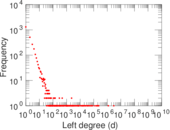
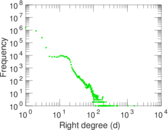
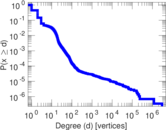
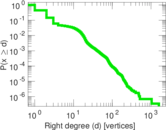
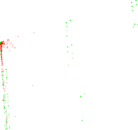
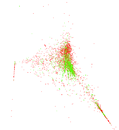
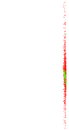
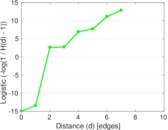
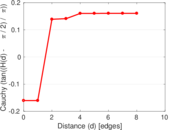
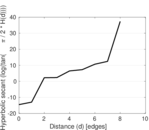
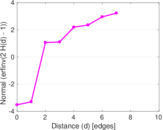
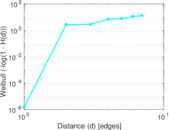
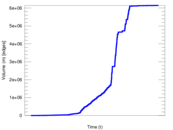
Plots


Downloads
References
|
[1]
|
Jérôme Kunegis.
KONECT – The Koblenz Network Collection.
In Proc. Int. Conf. on World Wide Web Companion, pages
1343–1350, 2013.
[ http ]
|
|
[2]
|
Wikimedia Foundation.
Wikimedia downloads.
http://dumps.wikimedia.org/, January 2010.
|
 KONECT ‣ Networks ‣
Buy Me a Coffee
KONECT ‣ Networks ‣
Buy Me a Coffee