Wiktionary edits (zh)
This is the bipartite edit network of the Chinese Wiktionary. It contains users
and pages from the Chinese Wiktionary, connected by edit events. Each edge
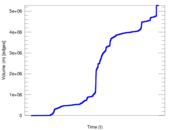
represents an edit. The dataset includes the timestamp of each edit.
Metadata
Statistics
| Size | n = | 1,347,094
|
| Left size | n1 = | 3,654
|
| Right size | n2 = | 1,343,440
|
| Volume | m = | 5,276,371
|
| Unique edge count | m̿ = | 3,548,435
|
| Wedge count | s = | 874,615,402,251
|
| Claw count | z = | 235,288,162,833,947,008
|
| Cross count | x = | 5.540 87 × 1022
|
| Maximum degree | dmax = | 1,728,017
|
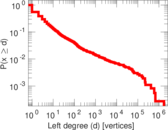
| Maximum left degree | d1max = | 1,728,017
|
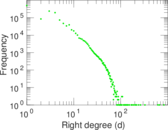
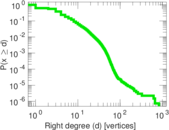
| Maximum right degree | d2max = | 829
|
| Average degree | d = | 7.833 71
|
| Average left degree | d1 = | 1,444.00
|
| Average right degree | d2 = | 3.927 51
|
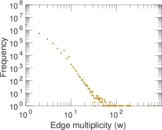
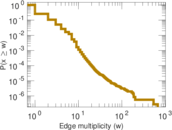
| Average edge multiplicity | m̃ = | 1.486 96
|
| Size of LCC | N = | 1,345,205
|
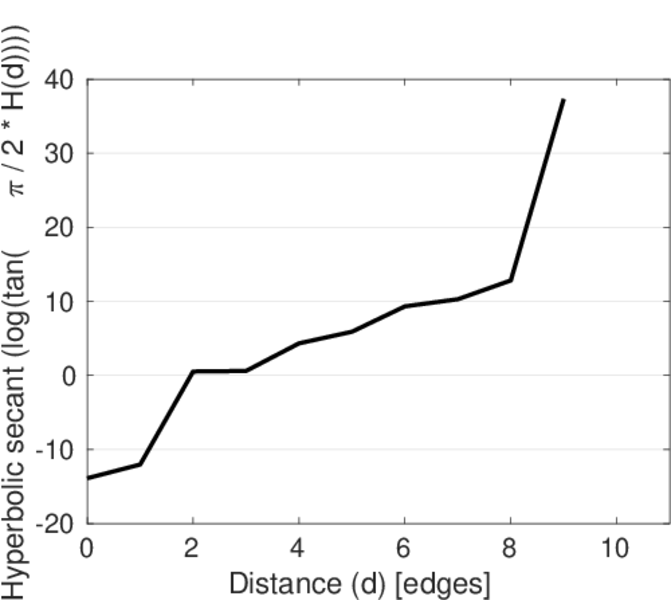
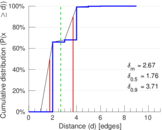
| Diameter | δ = | 12
|
| 50-Percentile effective diameter | δ0.5 = | 1.757 90
|
| 90-Percentile effective diameter | δ0.9 = | 3.706 28
|
| Median distance | δM = | 2
|
| Mean distance | δm = | 2.670 73
|
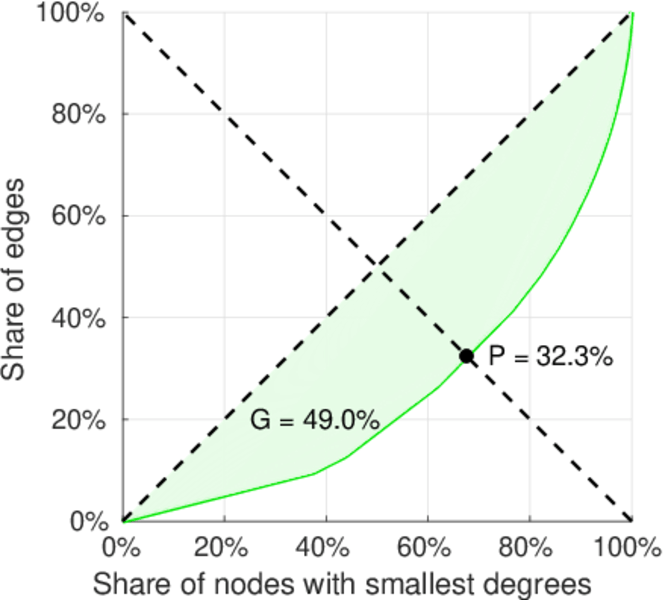
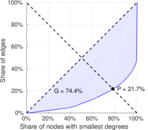
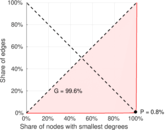
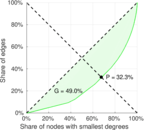
| Gini coefficient | G = | 0.744 500
|
| Balanced inequality ratio | P = | 0.217 175
|
| Left balanced inequality ratio | P1 = | 0.007 820 91
|
| Right balanced inequality ratio | P2 = | 0.322 995
|
| Relative edge distribution entropy | Her = | 0.630 936
|
| Power law exponent | γ = | 2.410 19
|
| Tail power law exponent with p | γ3 = | 4.611 00
|
| p-value | p = | 0.000 00
|
| Left tail power law exponent with p | γ3,1 = | 1.461 00
|
| Left p-value | p1 = | 0.010 000 0
|
| Right tail power law exponent with p | γ3,2 = | 4.811 00
|
| Right p-value | p2 = | 0.000 00
|
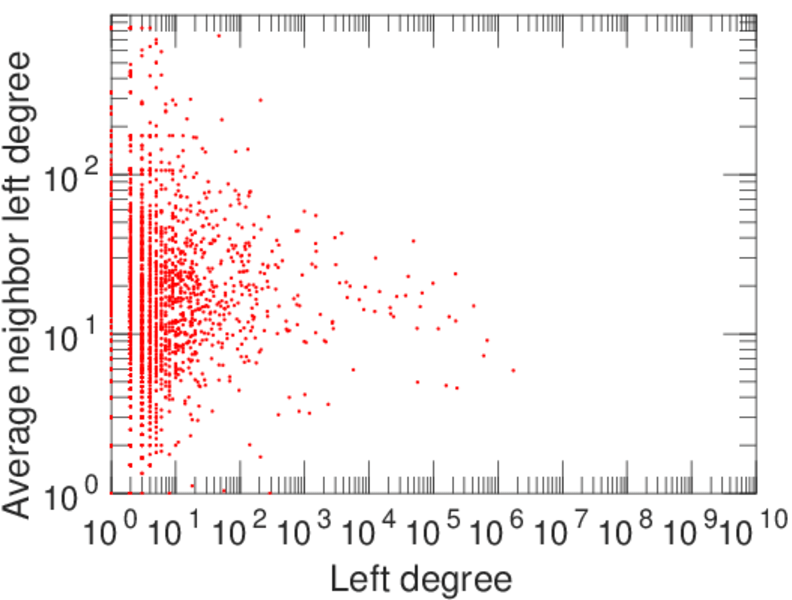
| Degree assortativity | ρ = | −0.363 993
|
| Degree assortativity p-value | pρ = | 0.000 00
|
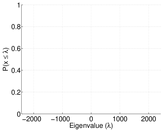
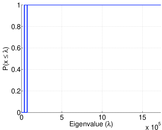
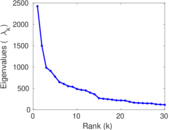
| Spectral norm | α = | 2,423.62
|
| Controllability | C = | 1,340,010
|
| Relative controllability | Cr = | 0.995 342
|
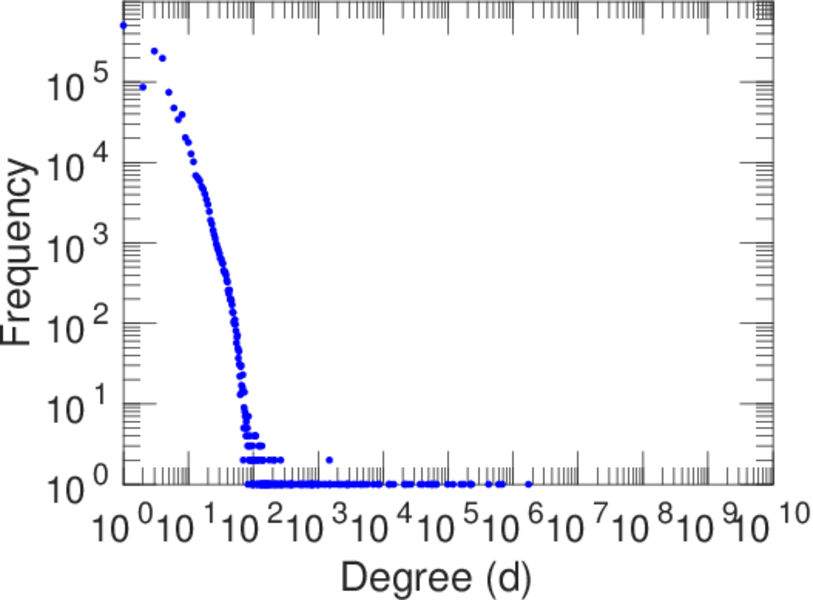
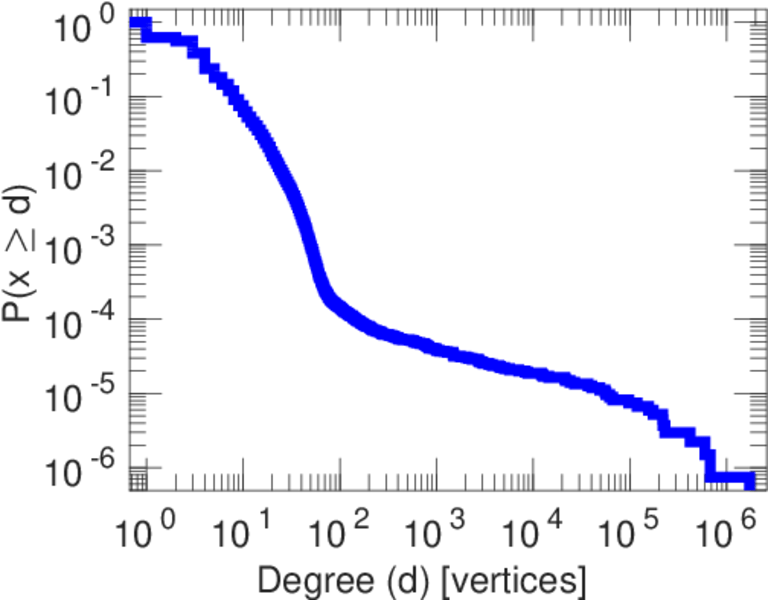
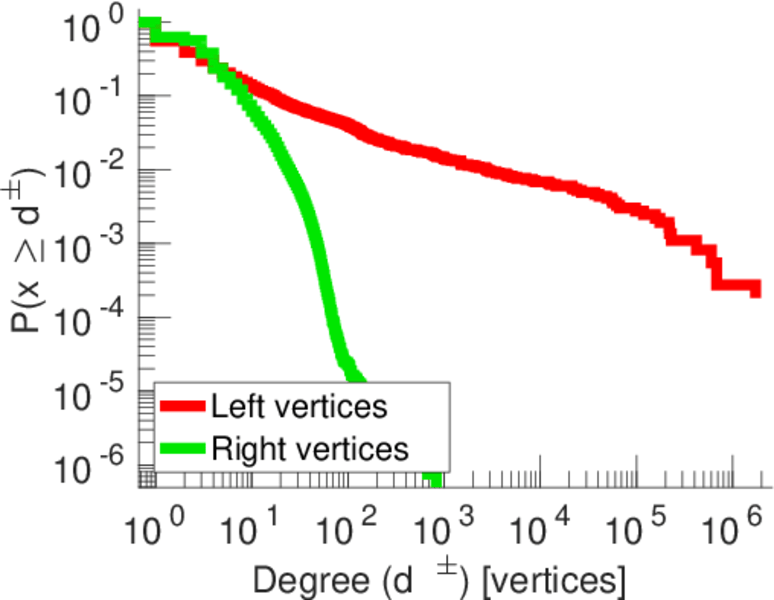
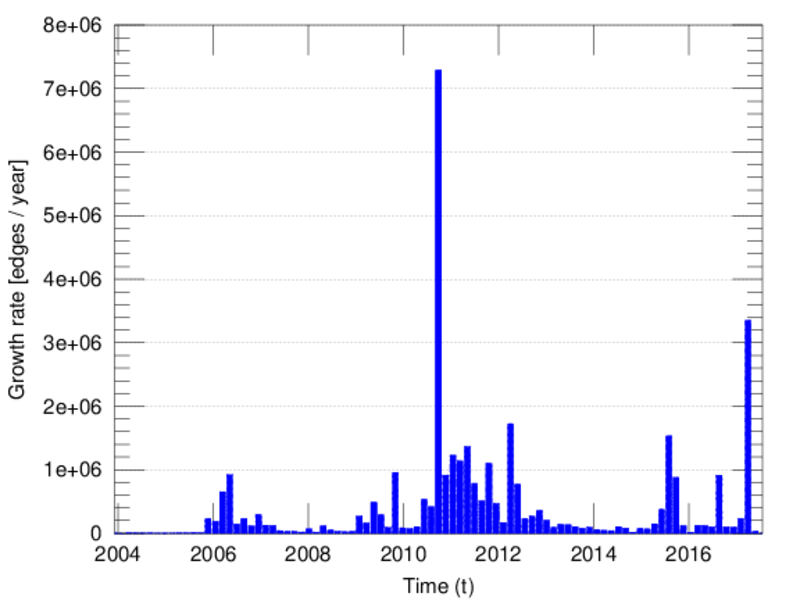
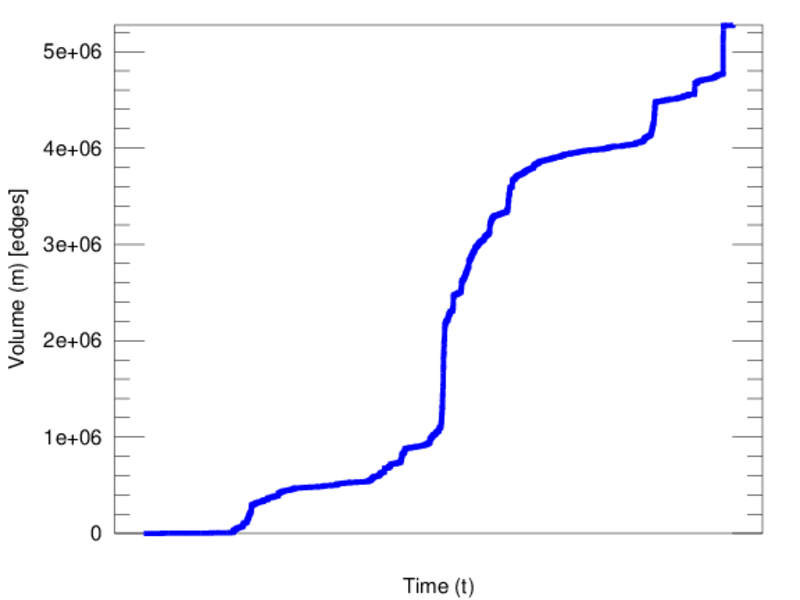
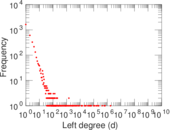
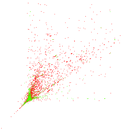
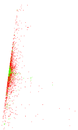
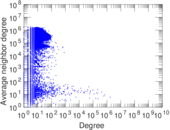
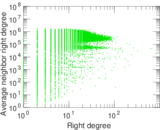
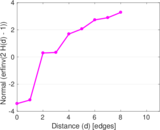
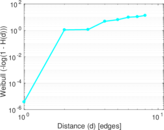
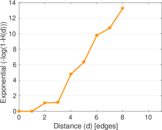
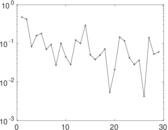
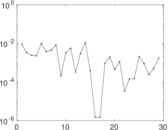
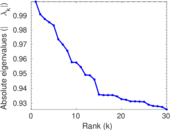
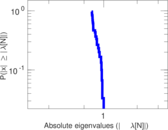
Plots


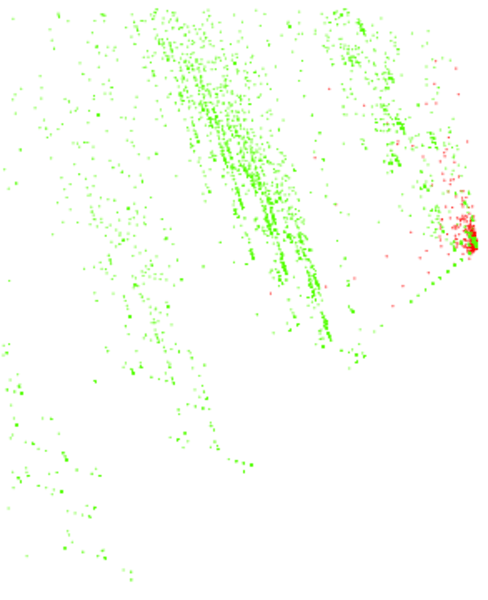
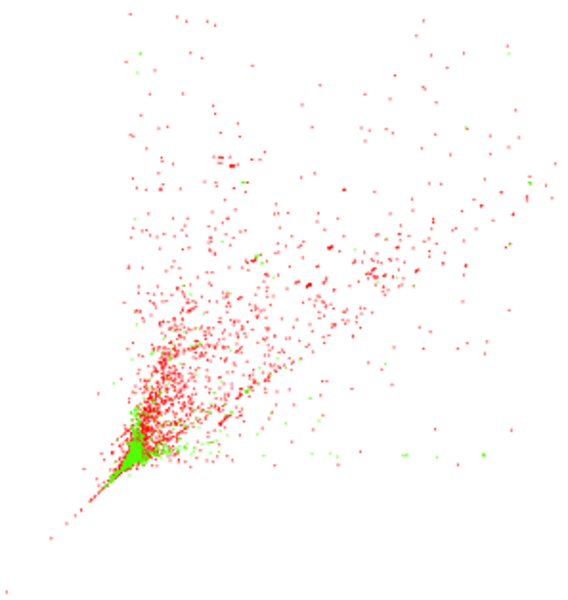
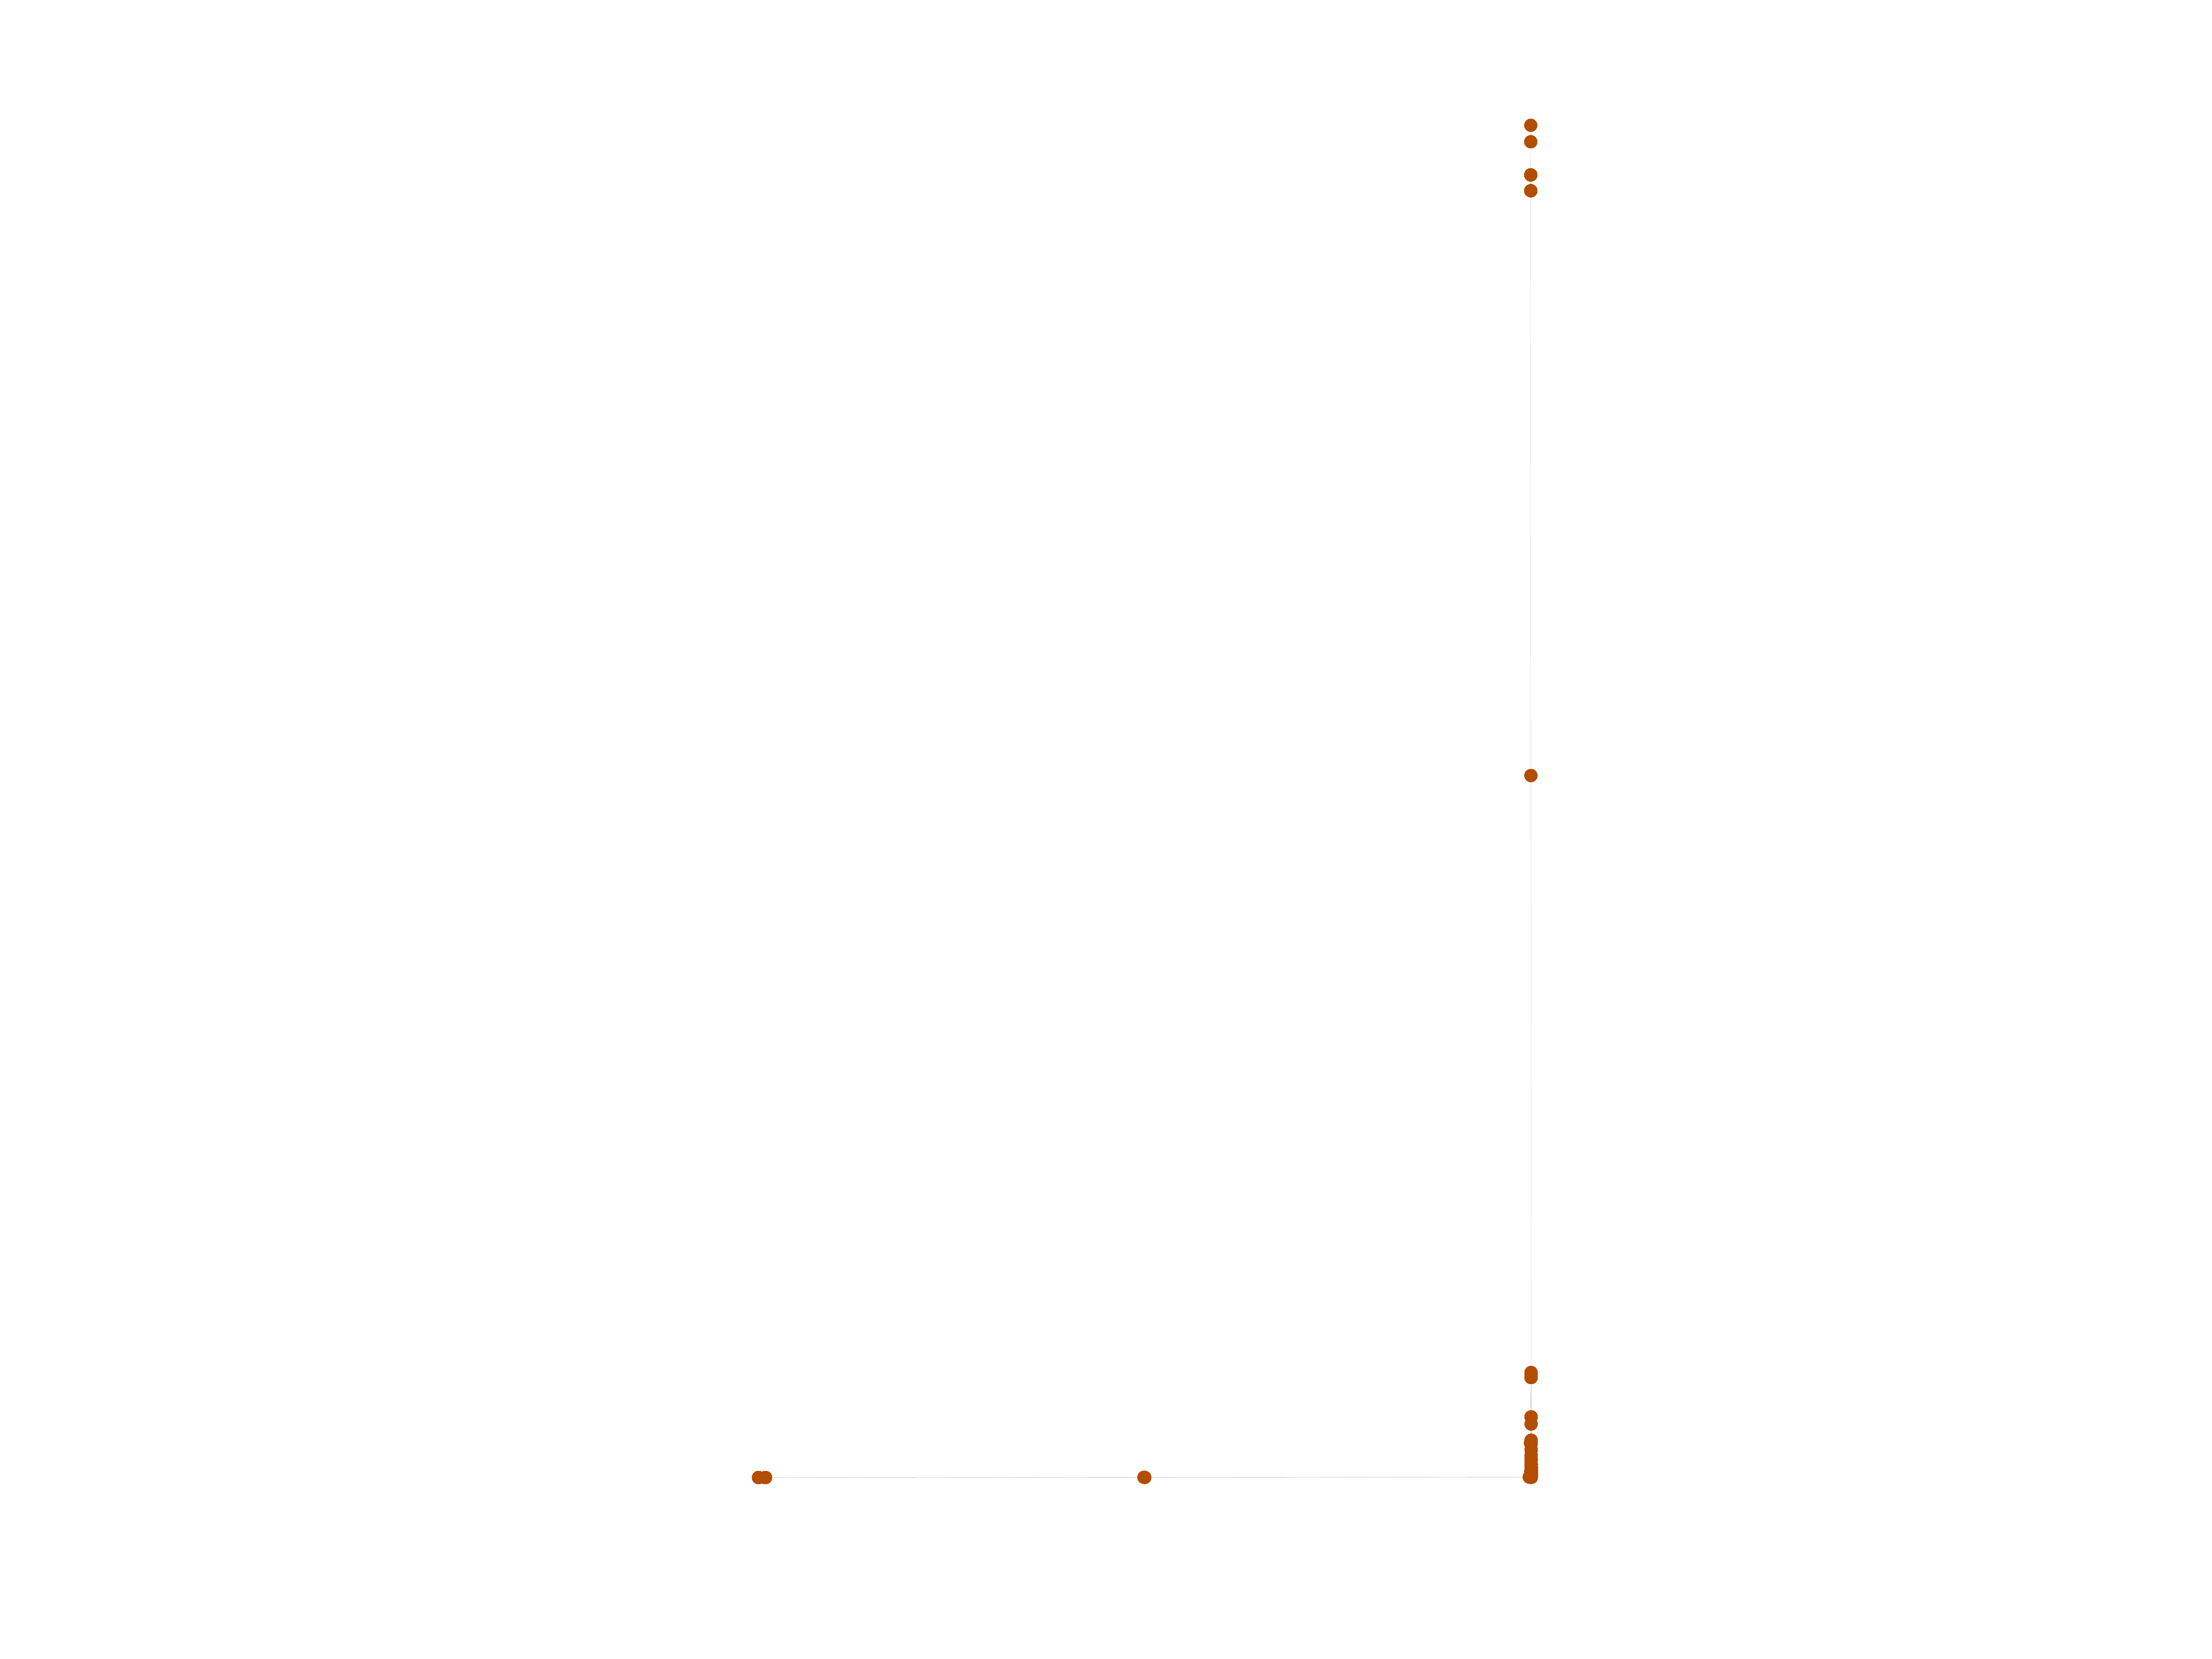
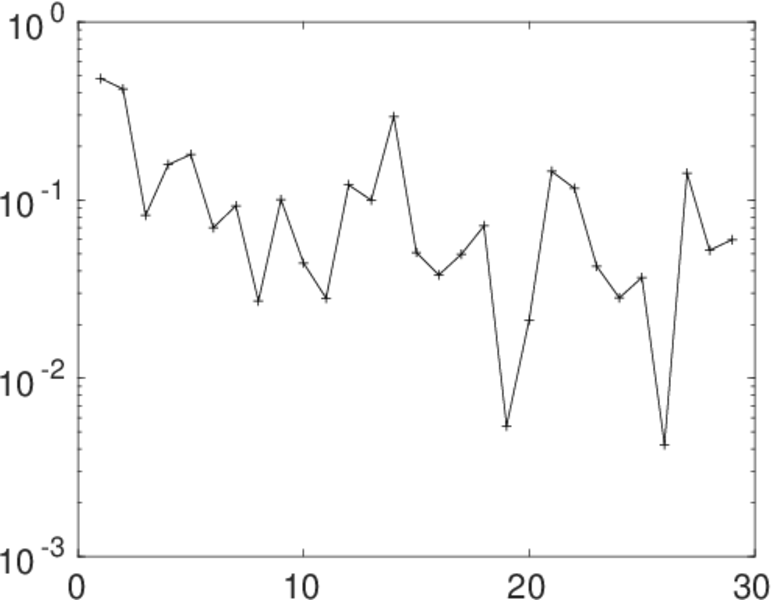
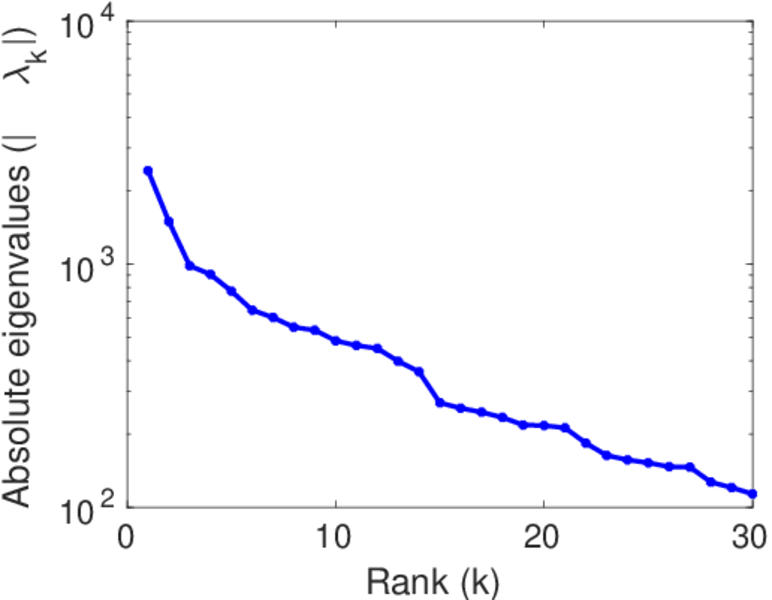
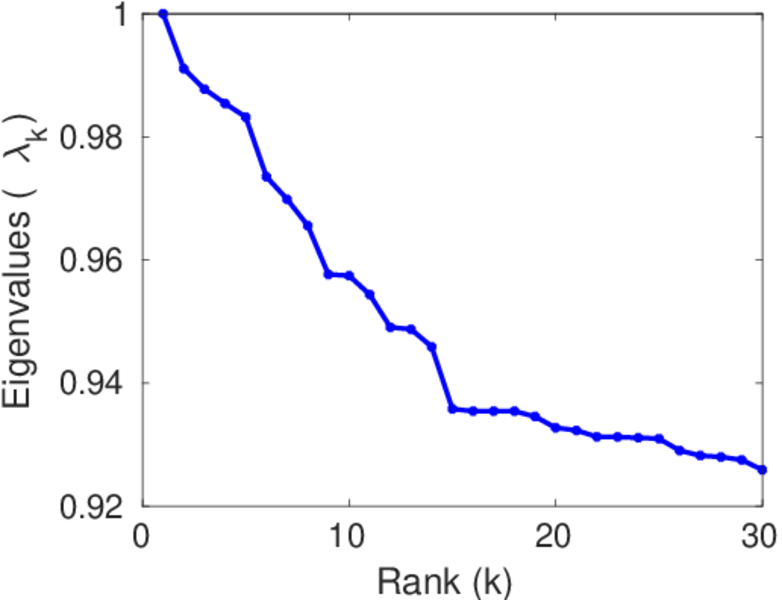
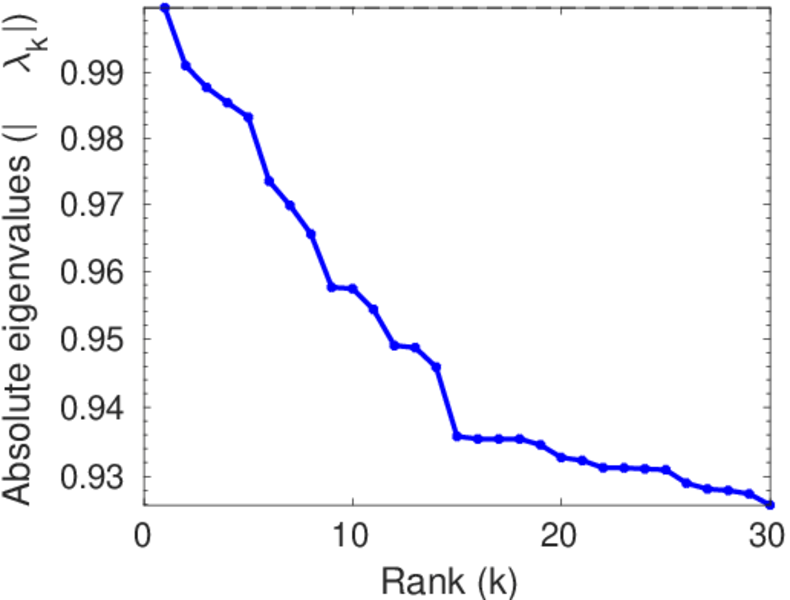
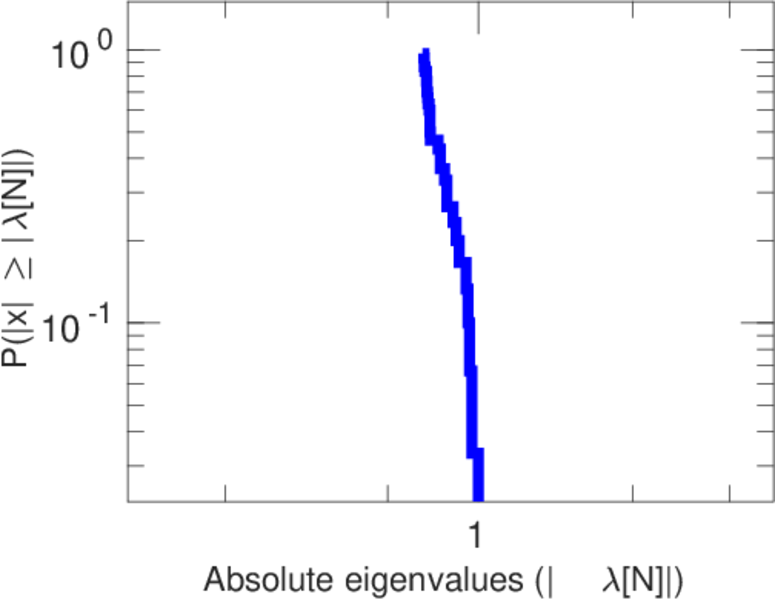
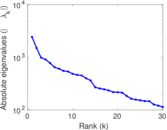
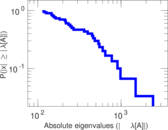
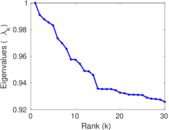
Matrix decompositions plots
Downloads
References
|
[1]
|
Jérôme Kunegis.
KONECT – The Koblenz Network Collection.
In Proc. Int. Conf. on World Wide Web Companion, pages
1343–1350, 2013.
[ http ]
|
|
[2]
|
Wikimedia Foundation.
Wikimedia downloads.
http://dumps.wikimedia.org/, January 2010.
|
 KONECT ‣ Networks ‣
Buy Me a Coffee
KONECT ‣ Networks ‣
Buy Me a Coffee