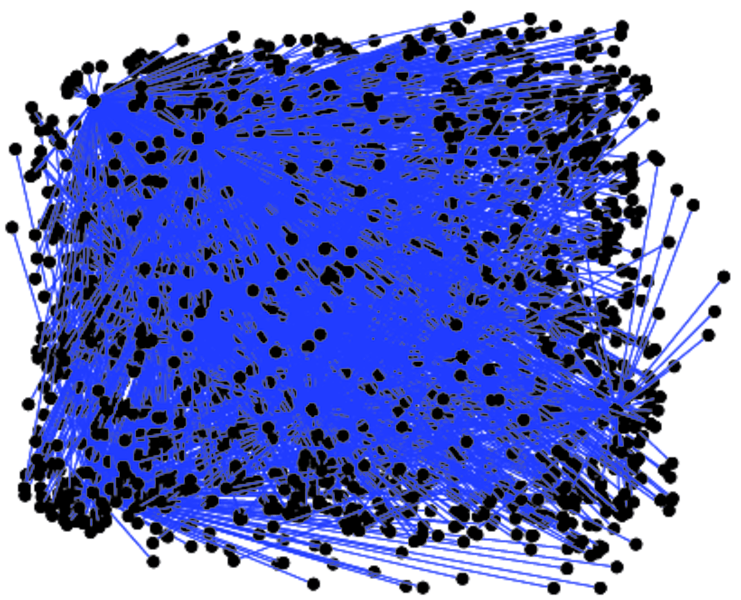
Facebook (NIPS)
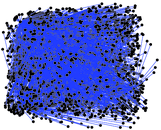
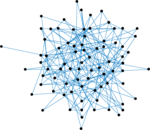
This directed networks contains Facebook user–user friendships. A node
represents a user. An edge indicates that the user represented by the left node
is a friend of the user represented by the right node.
Metadata
Statistics
| Size | n = | 2,888
|
| Volume | m = | 2,981
|
| Loop count | l = | 0
|
| Wedge count | s = | 759,641
|
| Claw count | z = | 160,449,784
|
| Cross count | x = | 27,585,555,395
|
| Triangle count | t = | 91
|
| Square count | q = | 1,261
|
| 4-Tour count | T4 = | 3,054,614
|
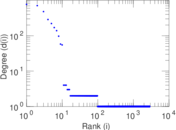
| Maximum degree | dmax = | 769
|
| Average degree | d = | 2.064 40
|
| Fill | p = | 0.000 715 069
|
| Size of LCC | N = | 2,888
|
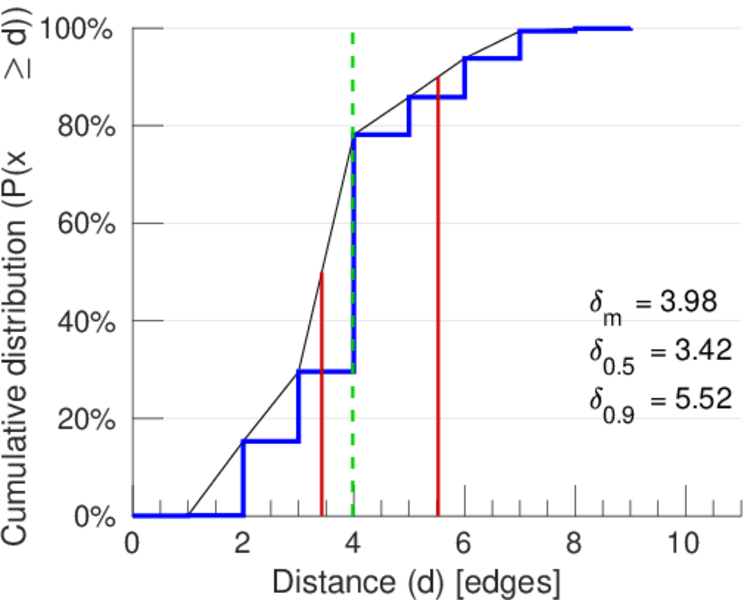
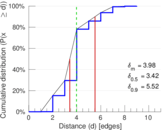
| Diameter | δ = | 9
|
| 50-Percentile effective diameter | δ0.5 = | 3.420 92
|
| 90-Percentile effective diameter | δ0.9 = | 5.524 62
|
| Median distance | δM = | 4
|
| Mean distance | δm = | 3.980 79
|
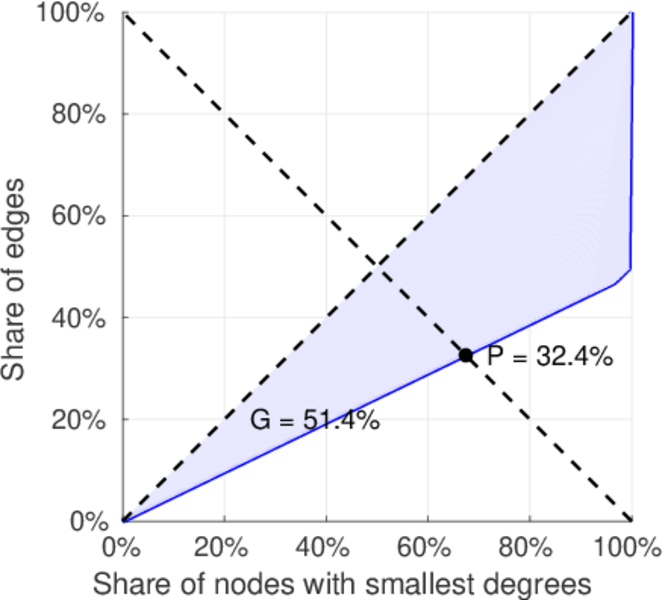
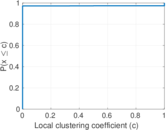
| Gini coefficient | G = | 0.514 083
|
| Balanced inequality ratio | P = | 0.324 388
|
| Relative edge distribution entropy | Her = | 0.708 747
|
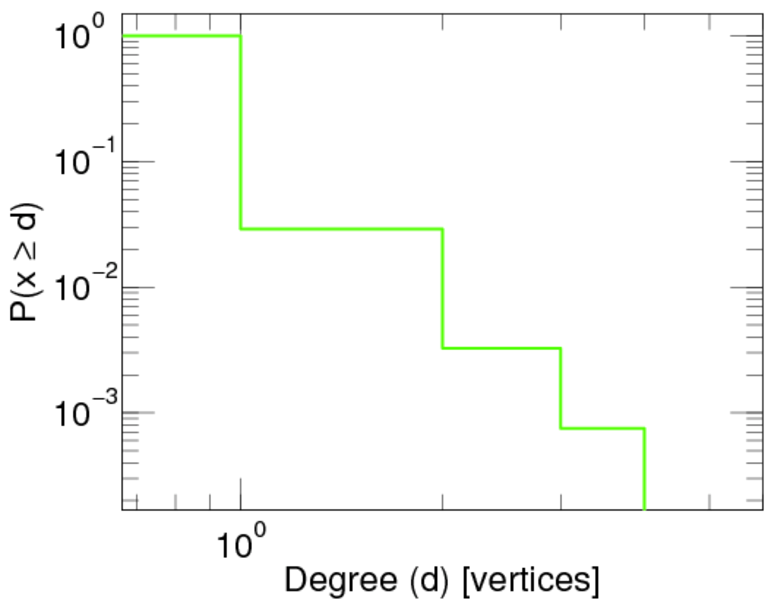
| Power law exponent | γ = | 25.589 3
|
| Tail power law exponent | γt = | 4.521 00
|
| Tail power law exponent with p | γ3 = | 4.521 00
|
| p-value | p = | 0.000 00
|
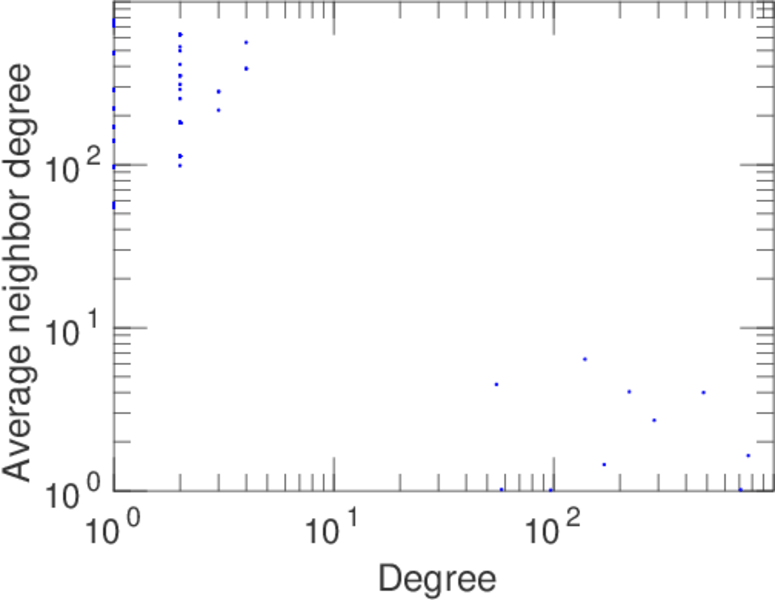
| Degree assortativity | ρ = | −0.668 214
|
| Degree assortativity p-value | pρ = | 0.000 00
|
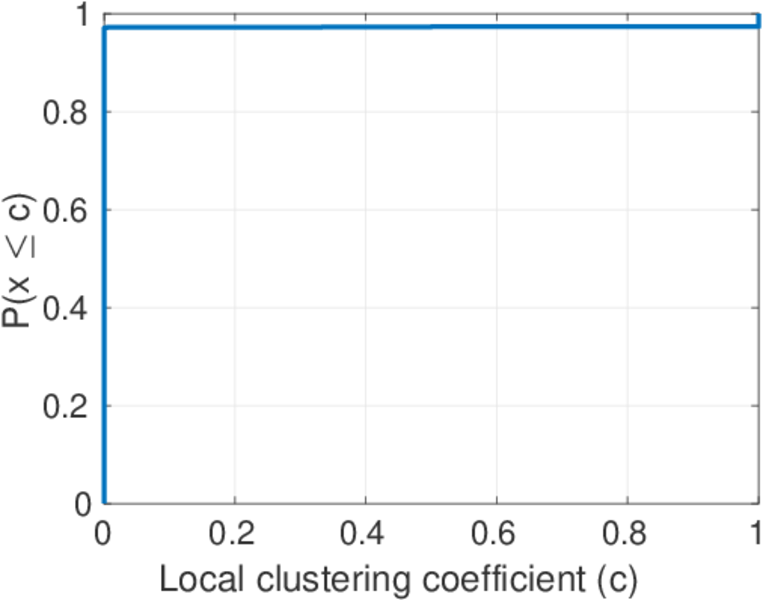
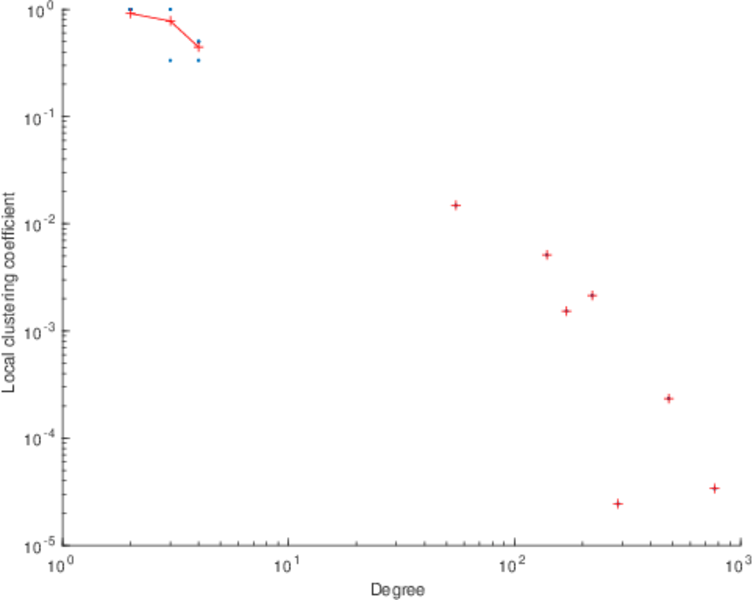
| Clustering coefficient | c = | 0.000 359 380
|
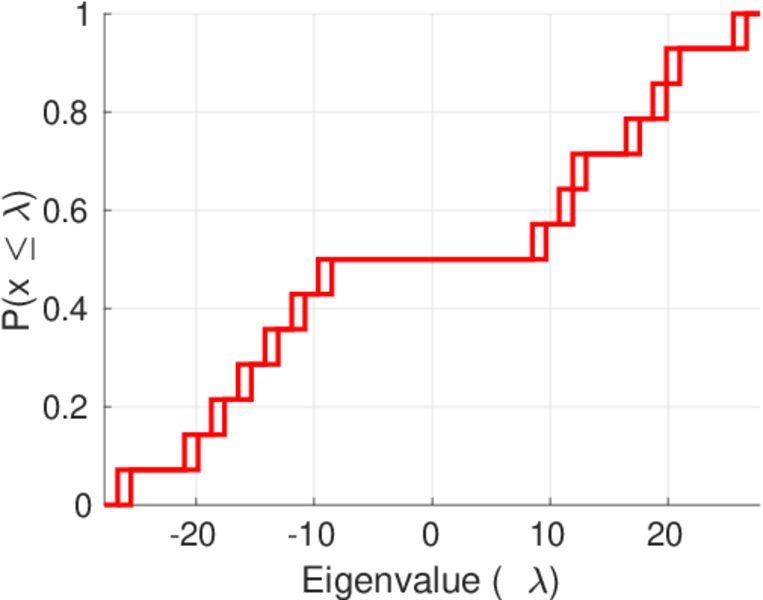
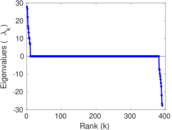
| Spectral norm | α = | 27.803 1
|
| Algebraic connectivity | a = | 0.002 377 13
|
| Spectral separation | |λ1[A] / λ2[A]| = | 1.002 52
|
| Non-bipartivity | bA = | 0.002 518 41
|
| Normalized non-bipartivity | bN = | 0.001 554 35
|
| Algebraic non-bipartivity | χ = | 0.003 114 08
|
| Spectral bipartite frustration | bK = | 0.000 377 116
|
| Controllability | C = | 2,868
|
| Relative controllability | Cr = | 0.993 075
|
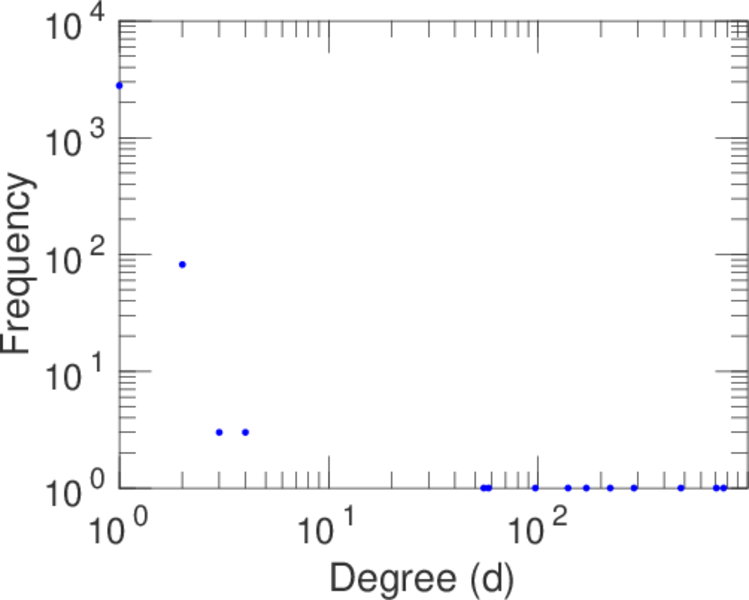
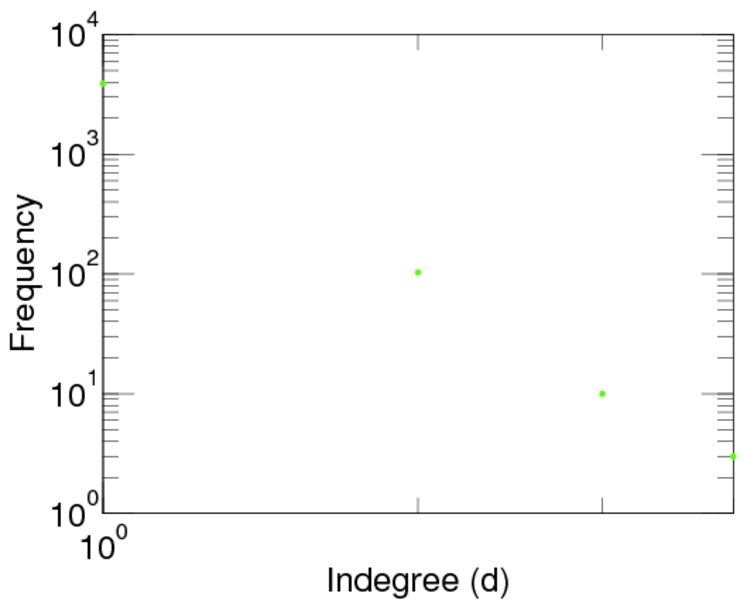
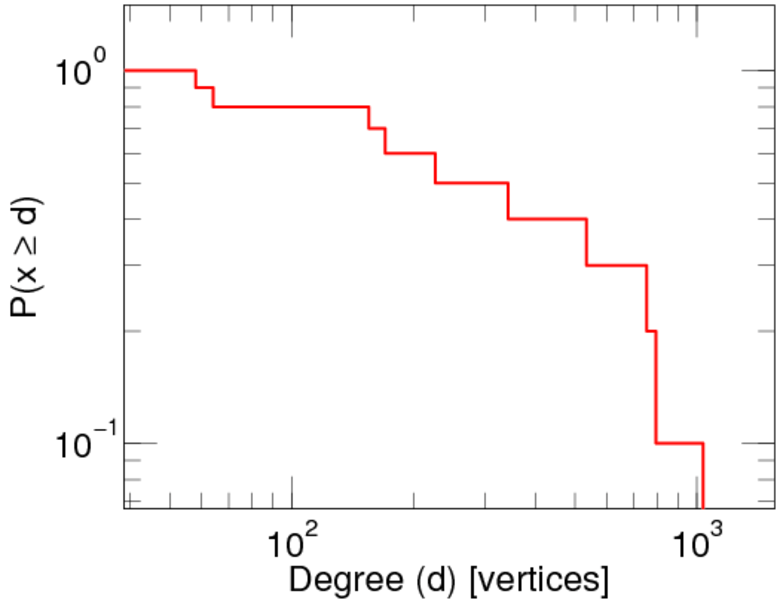
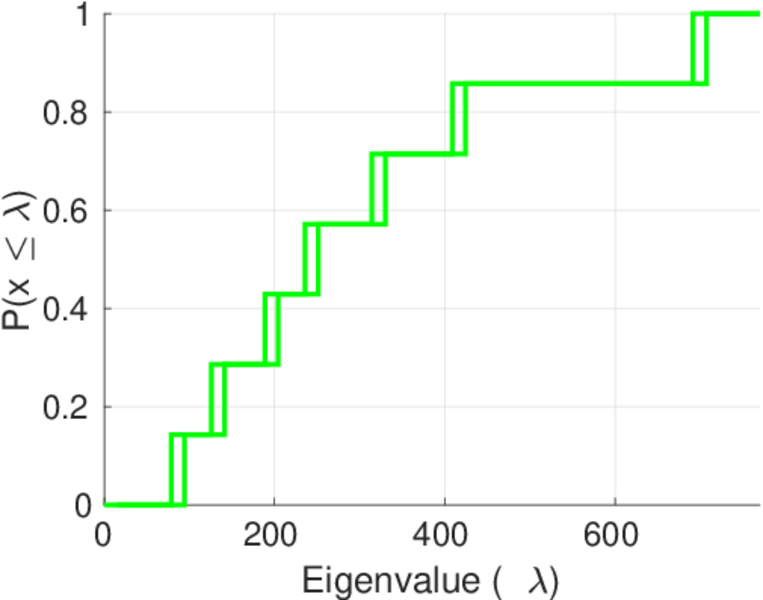
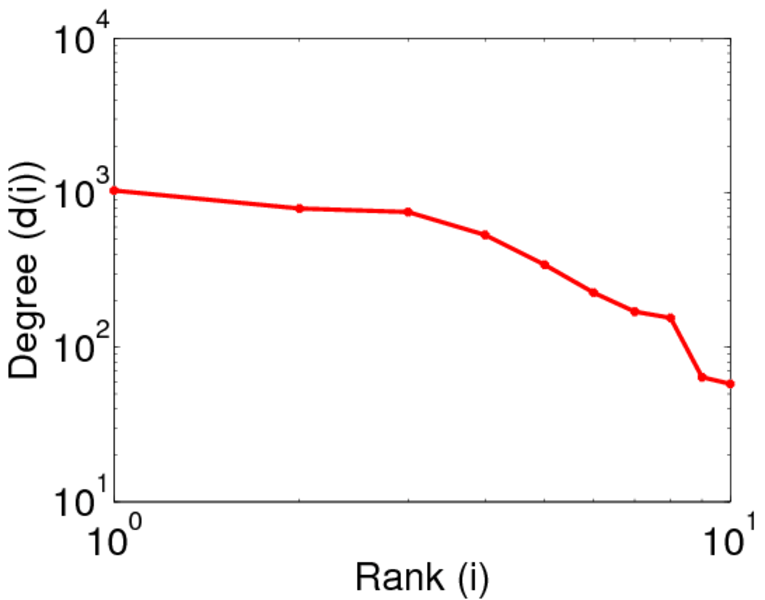
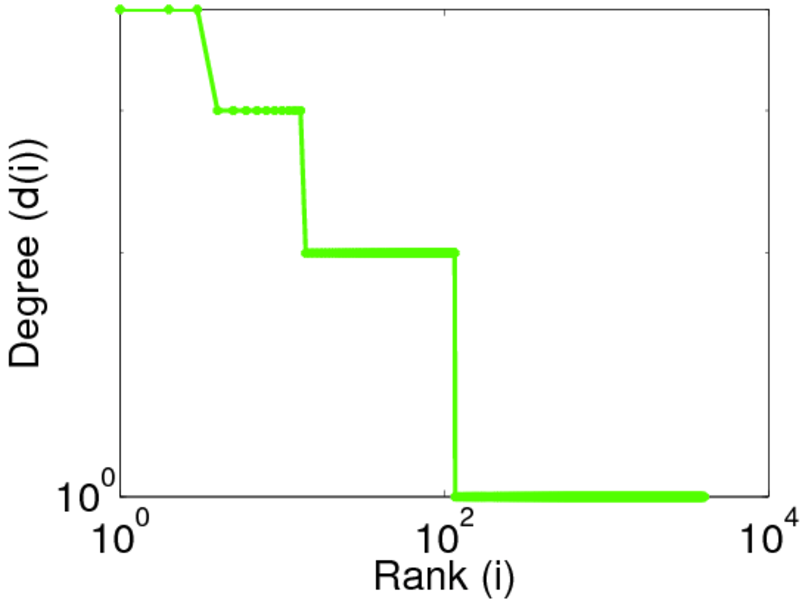
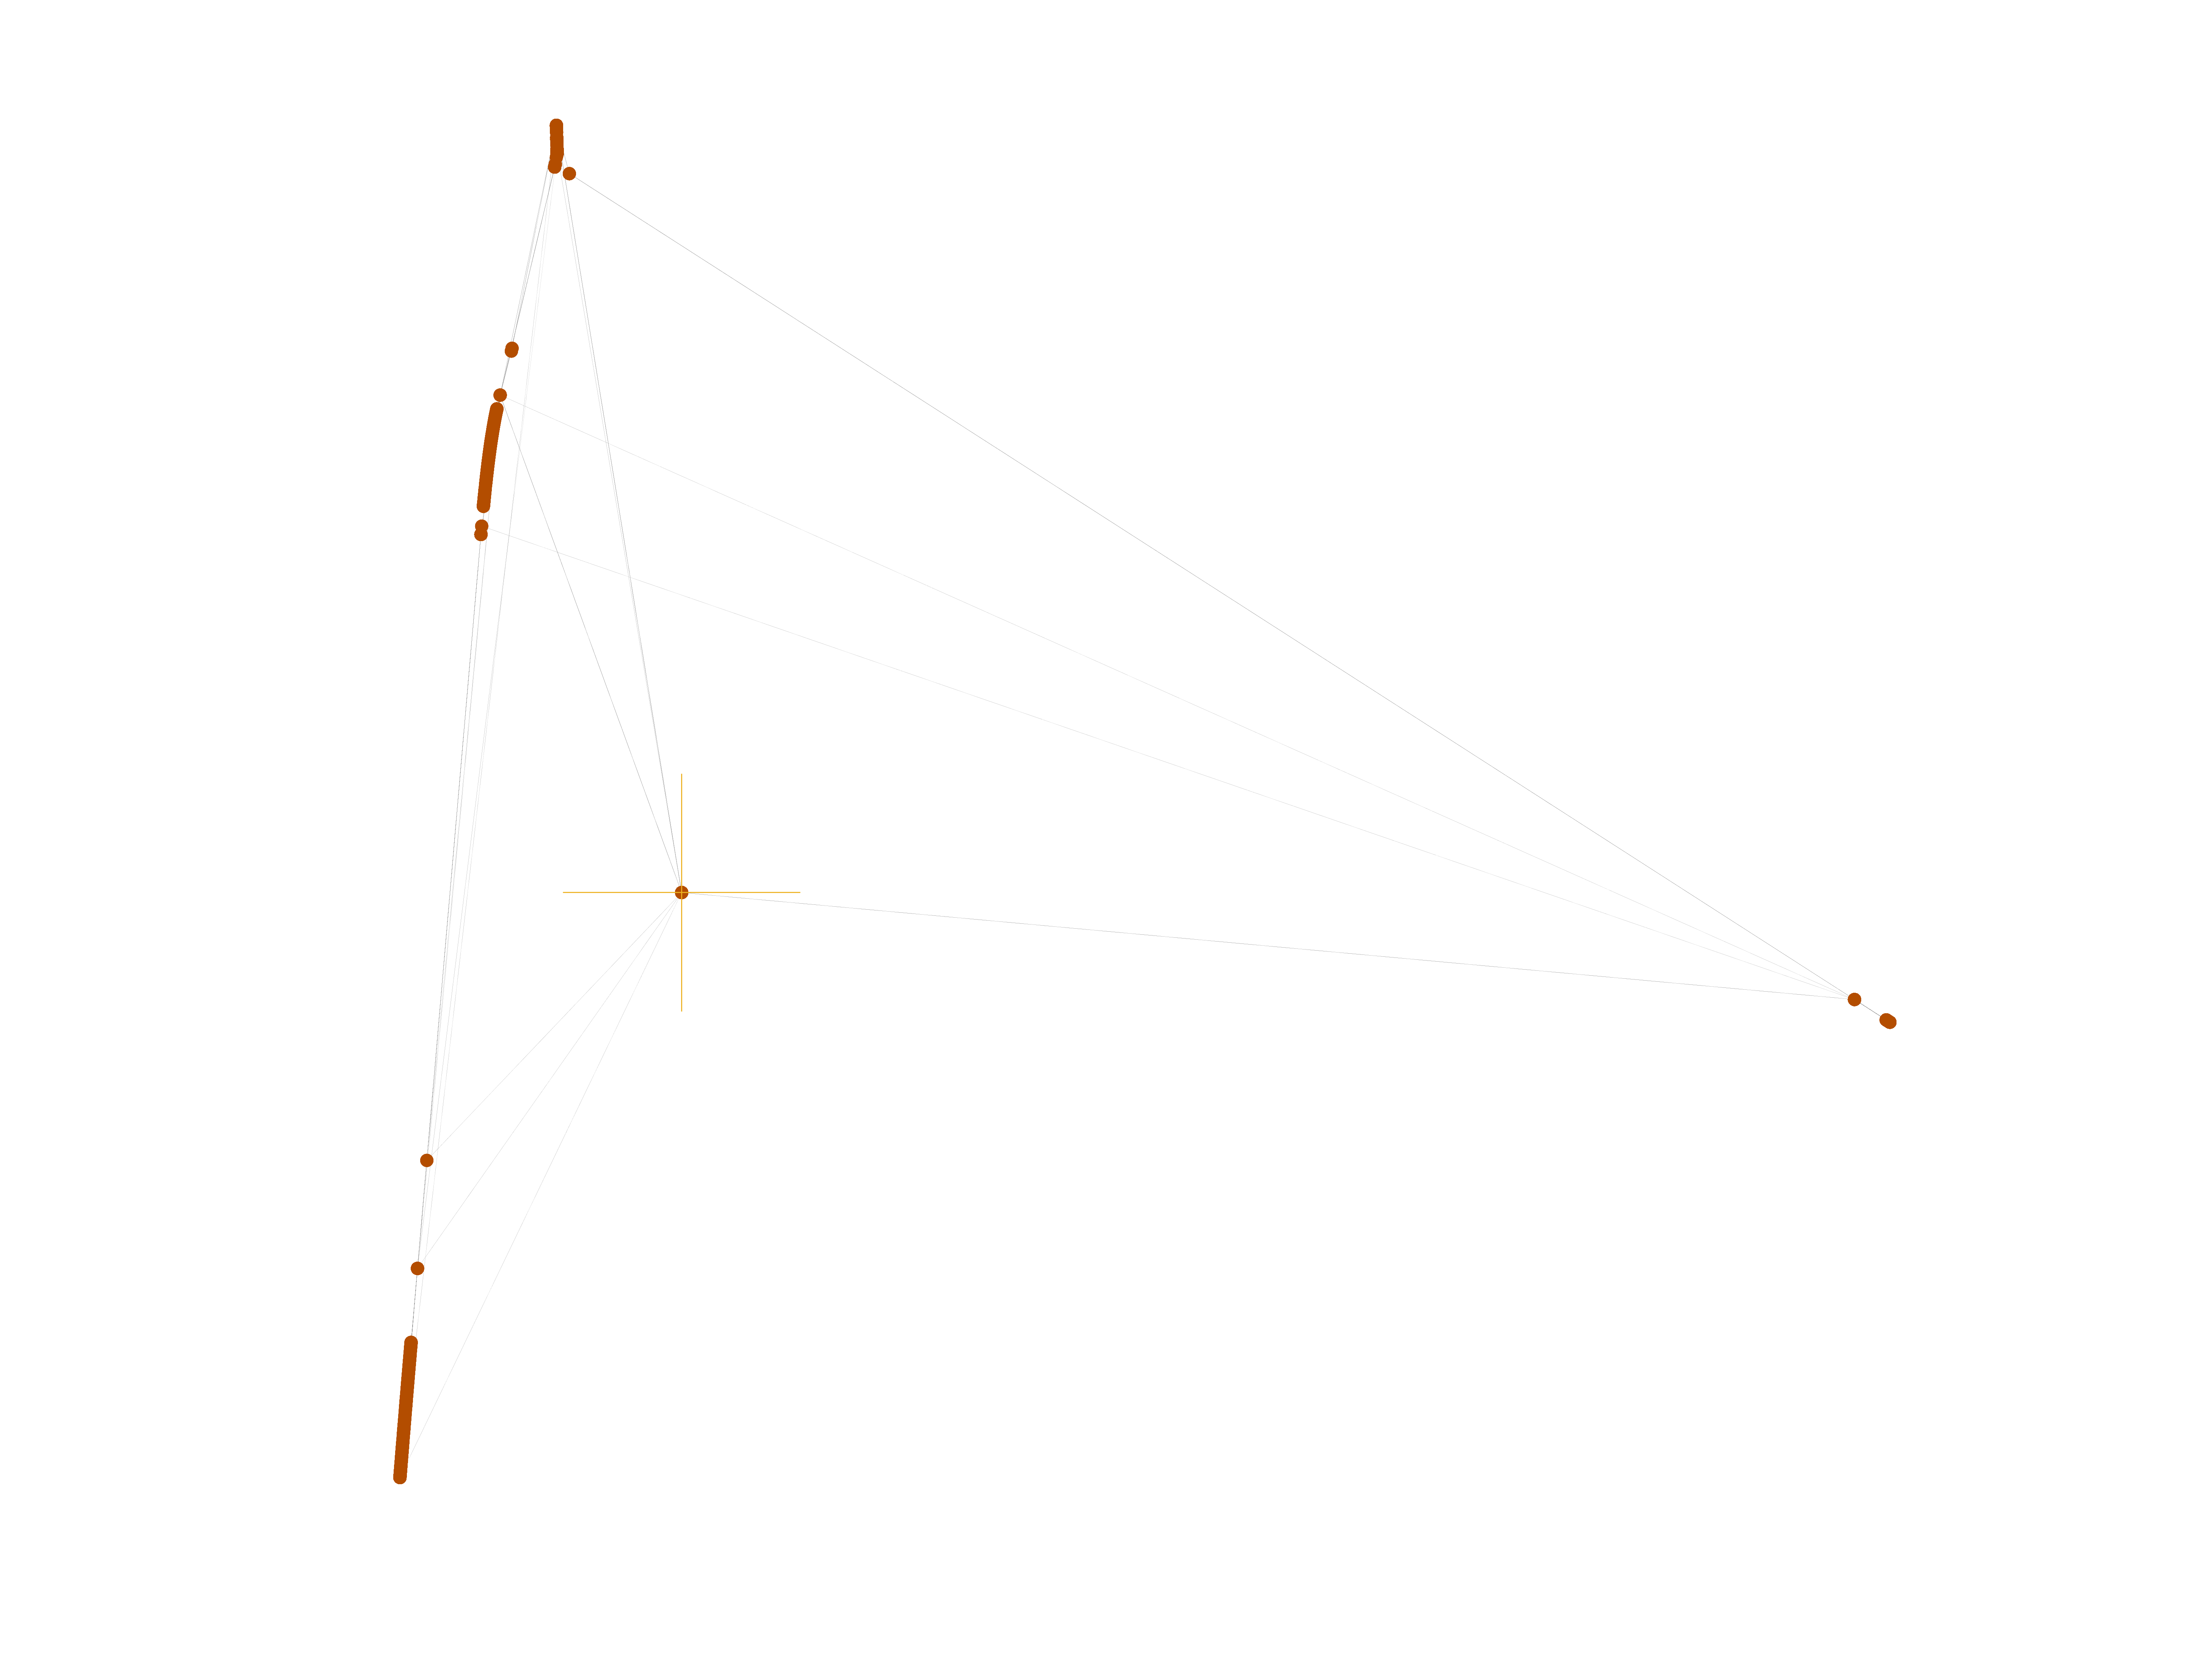
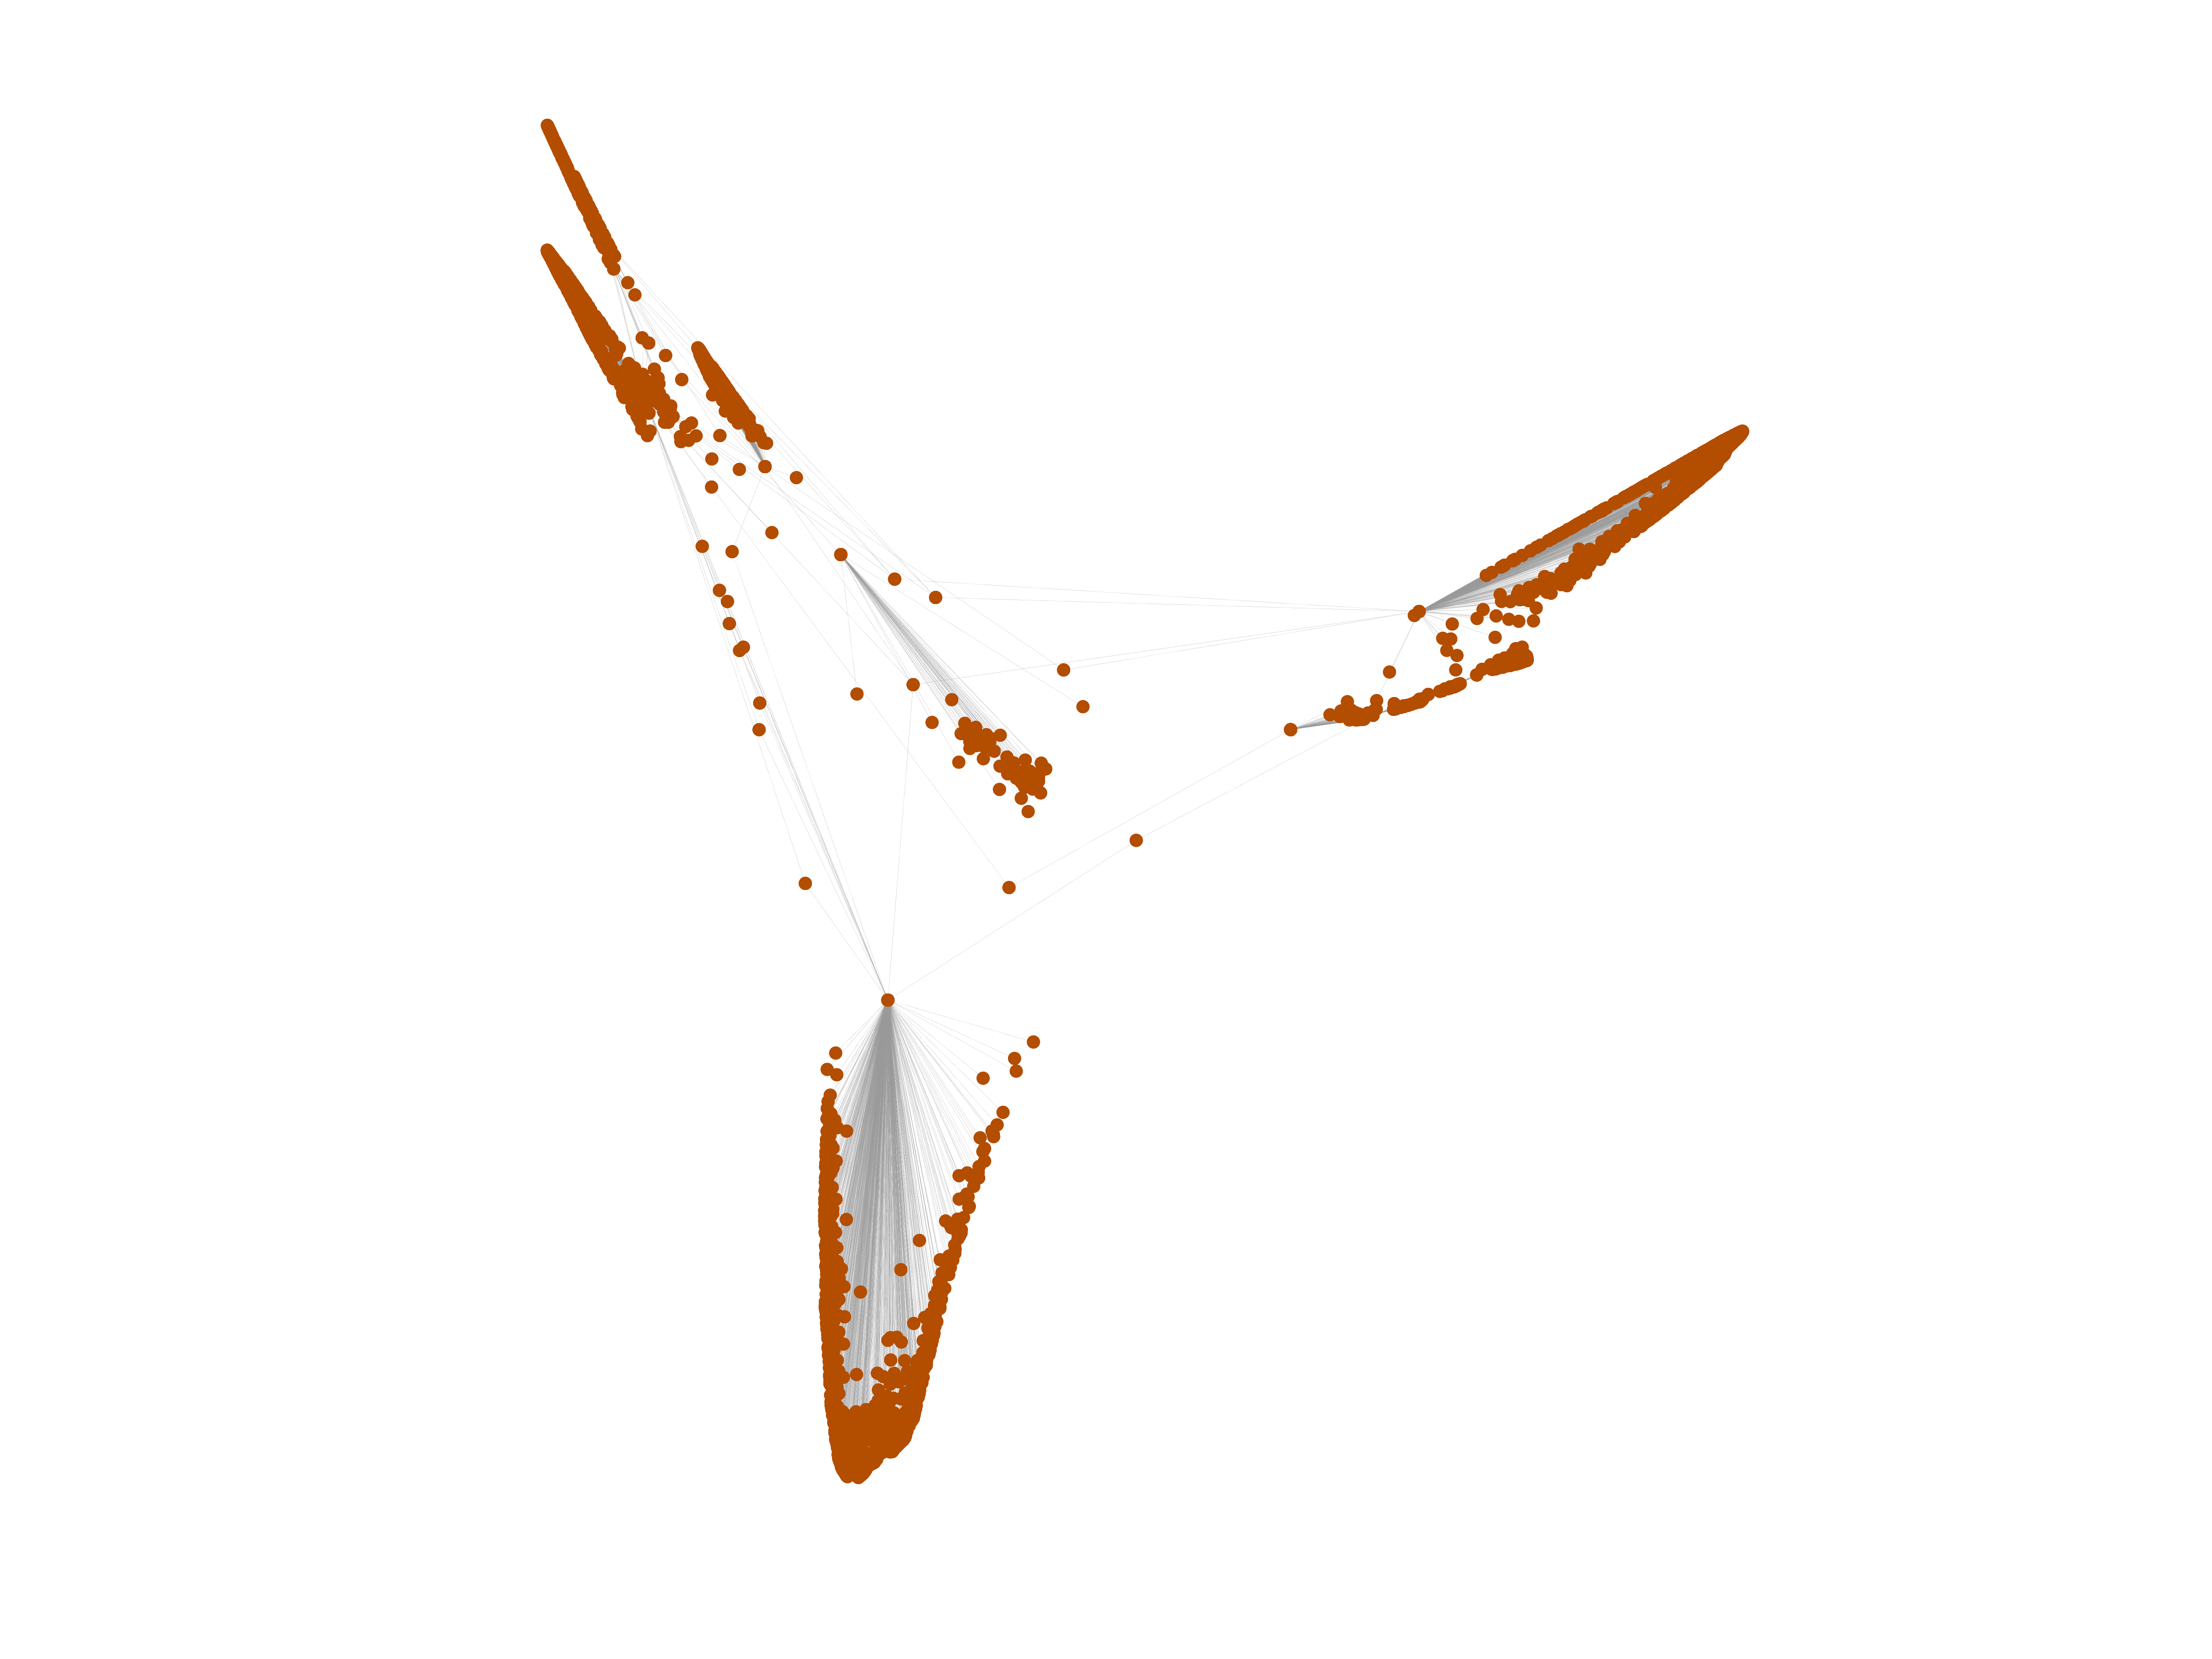
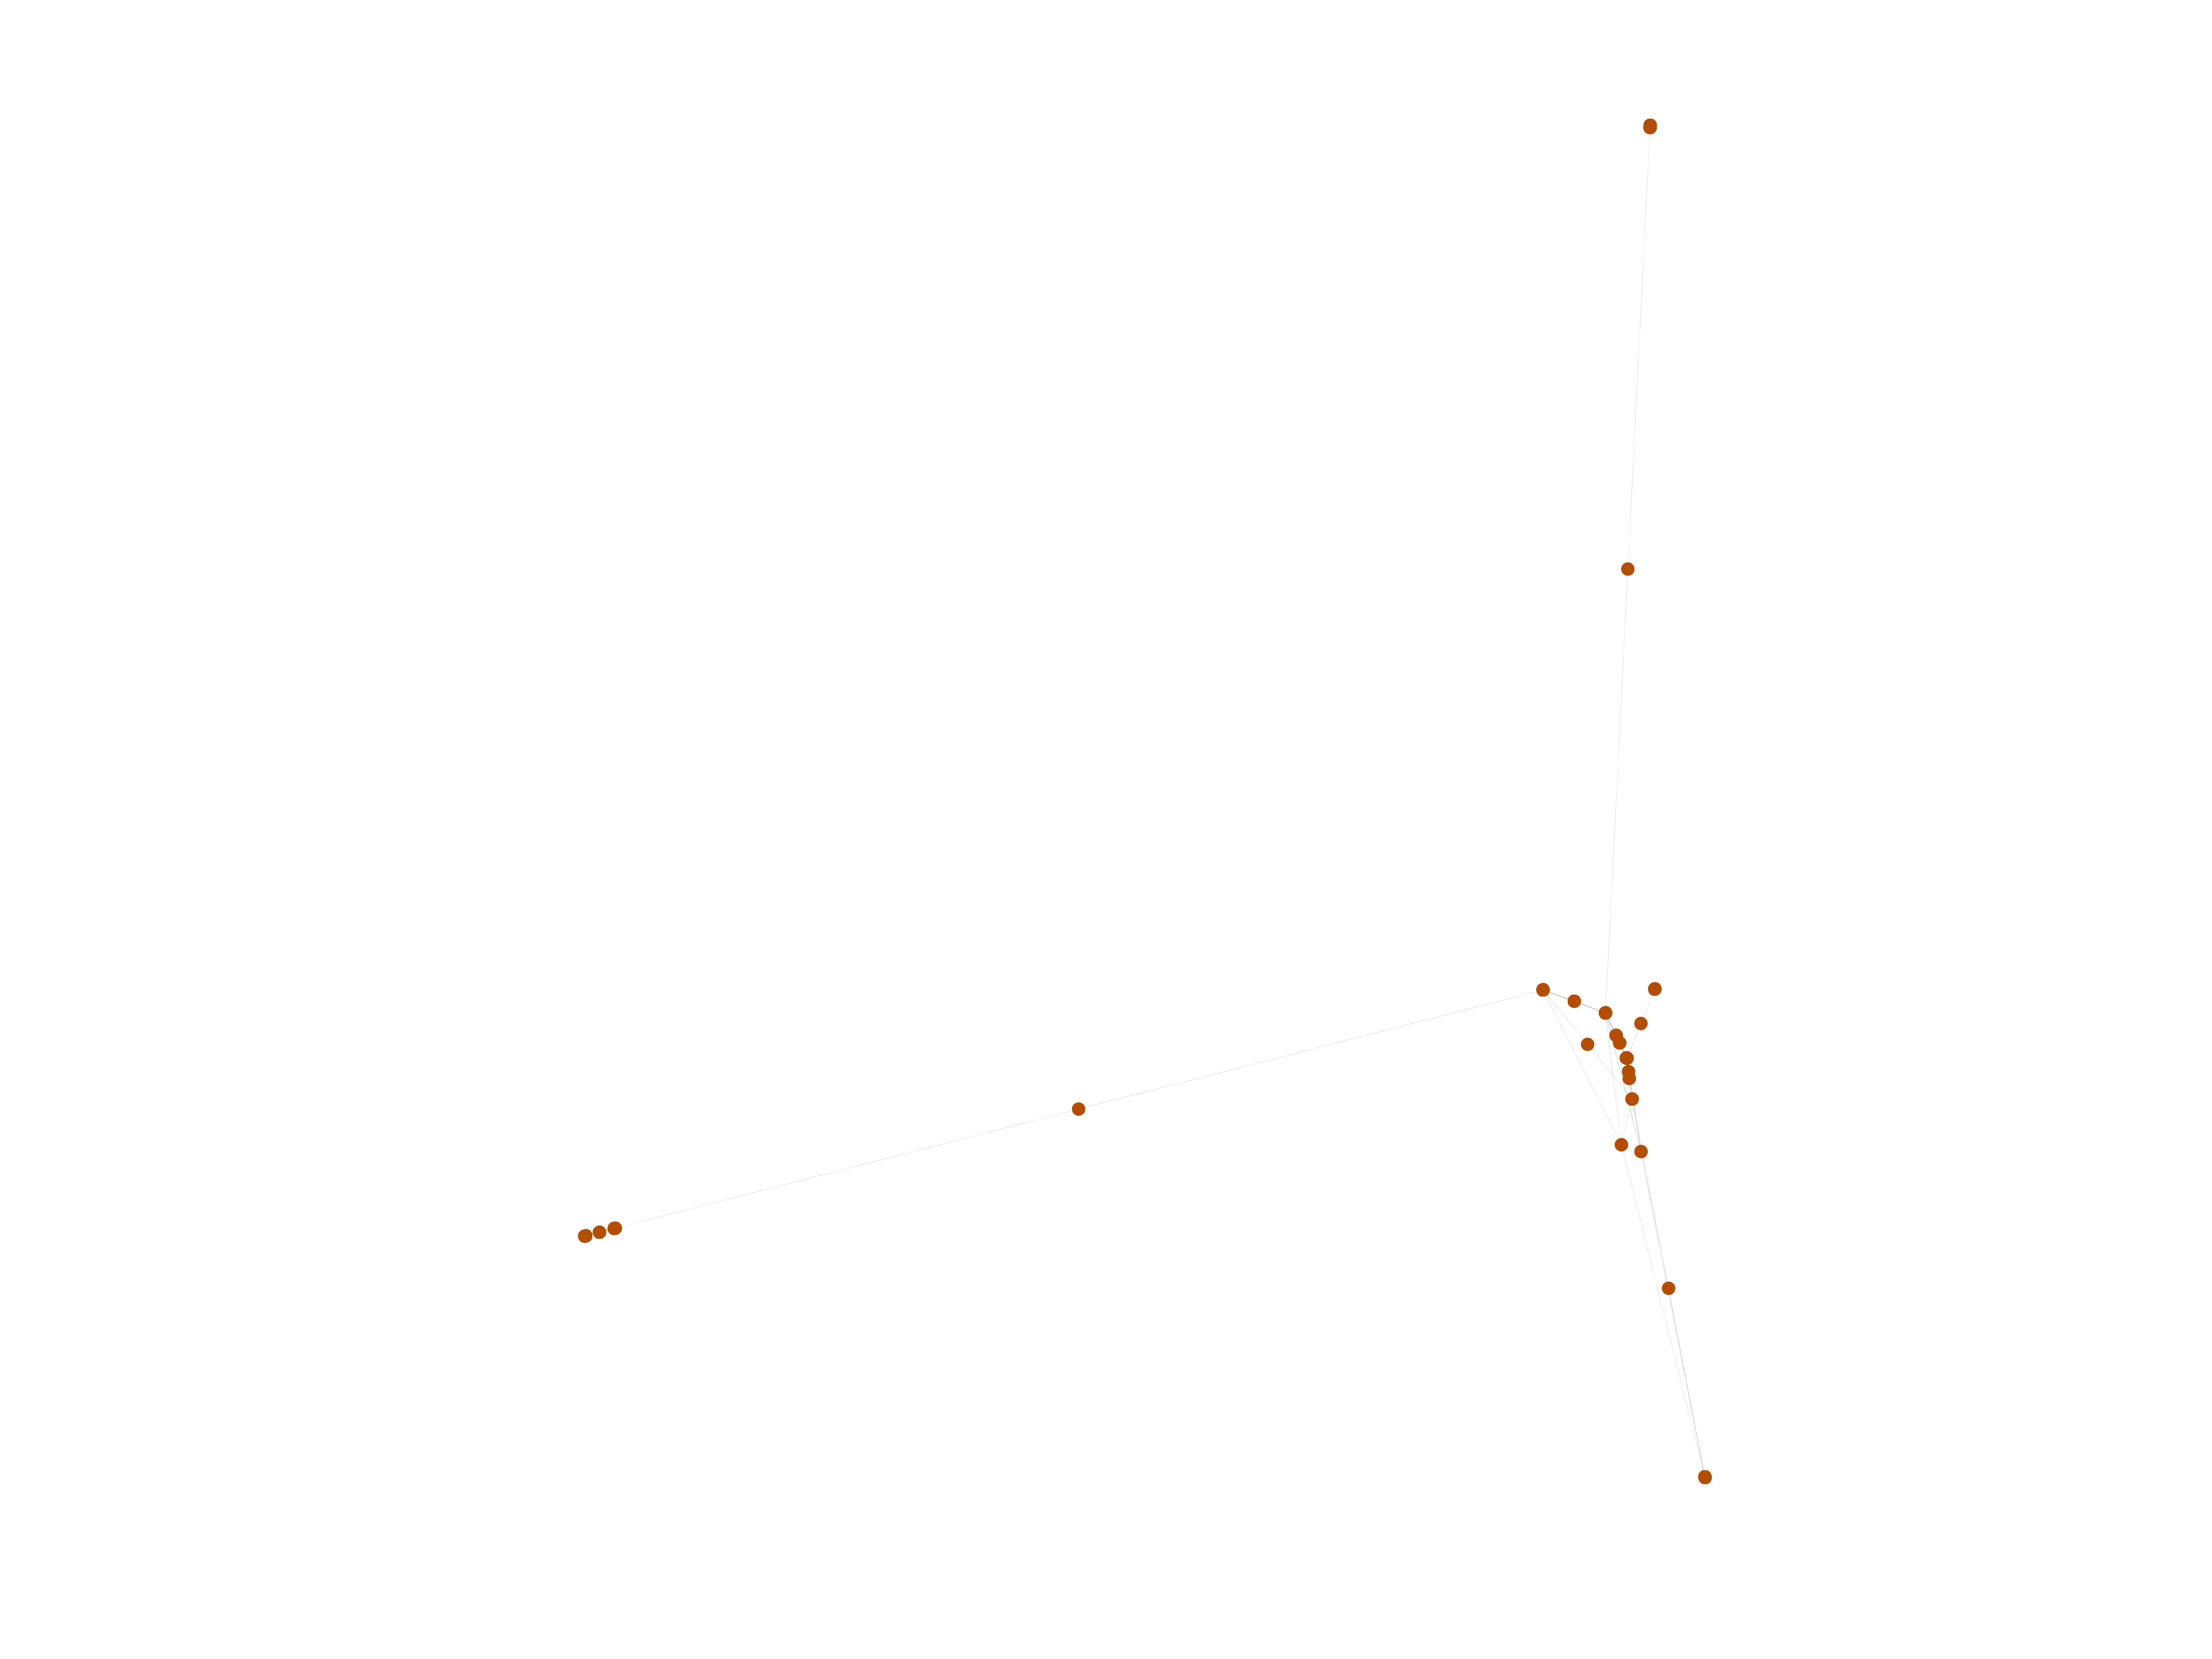
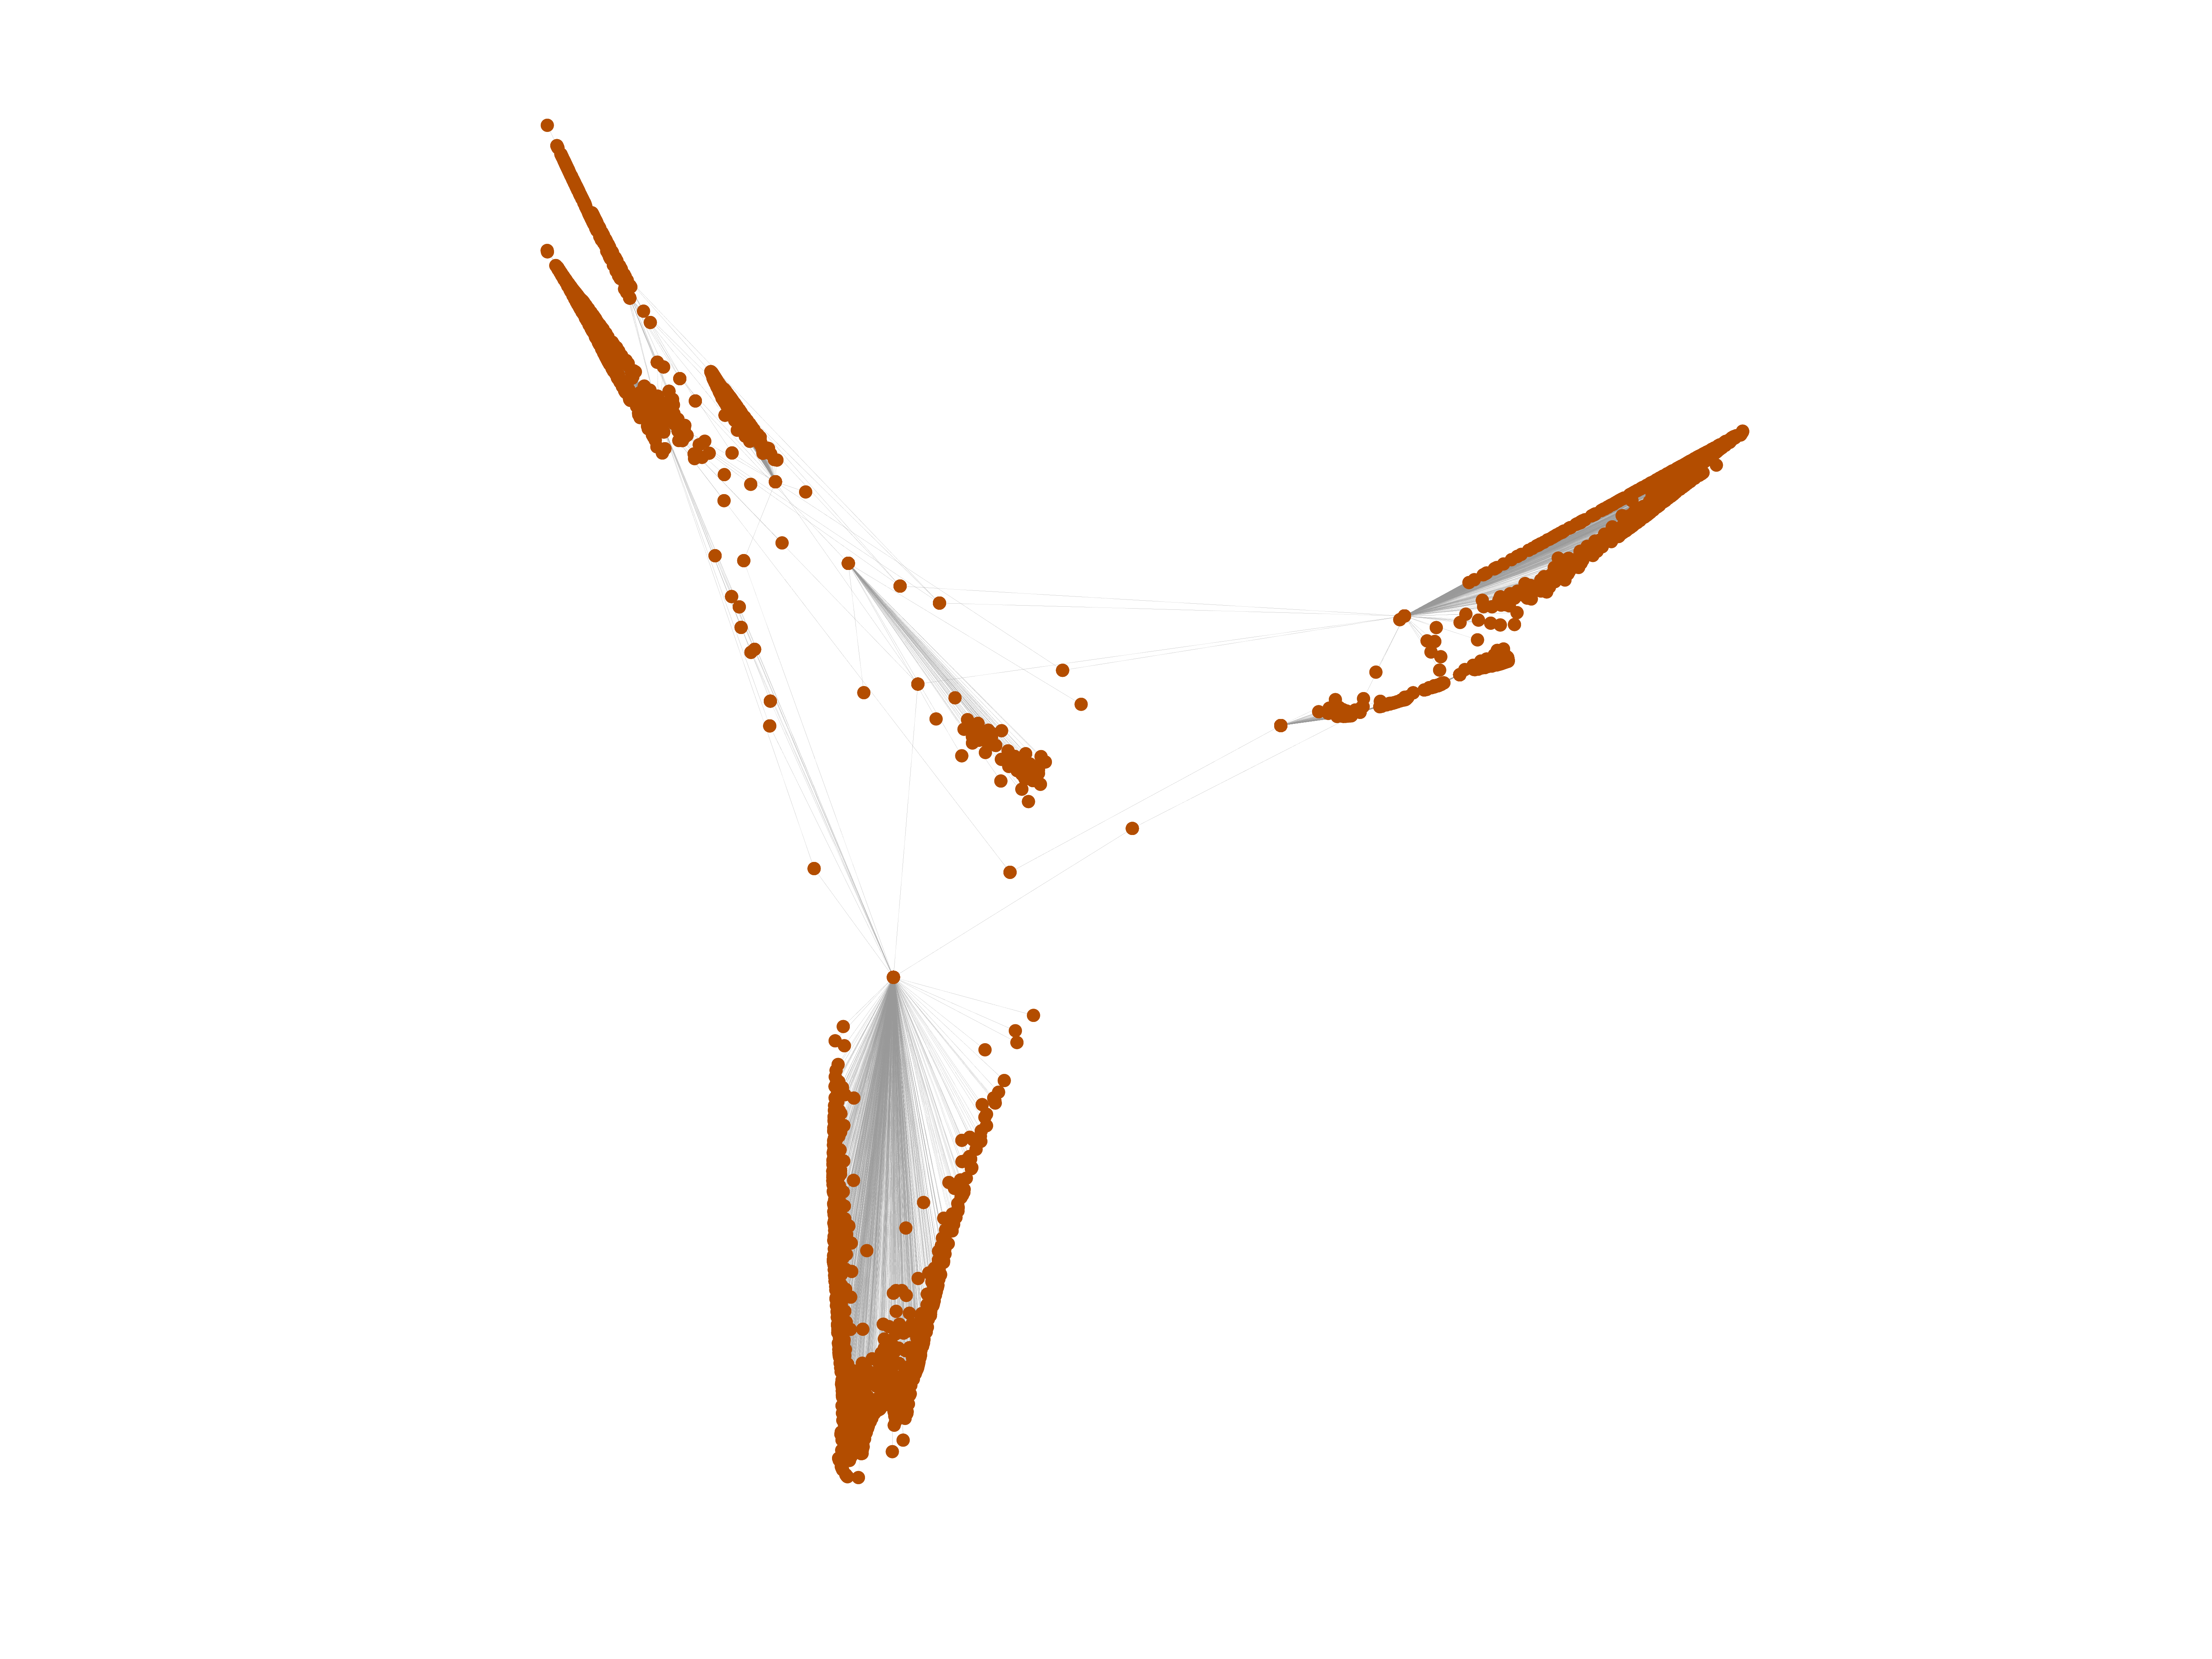
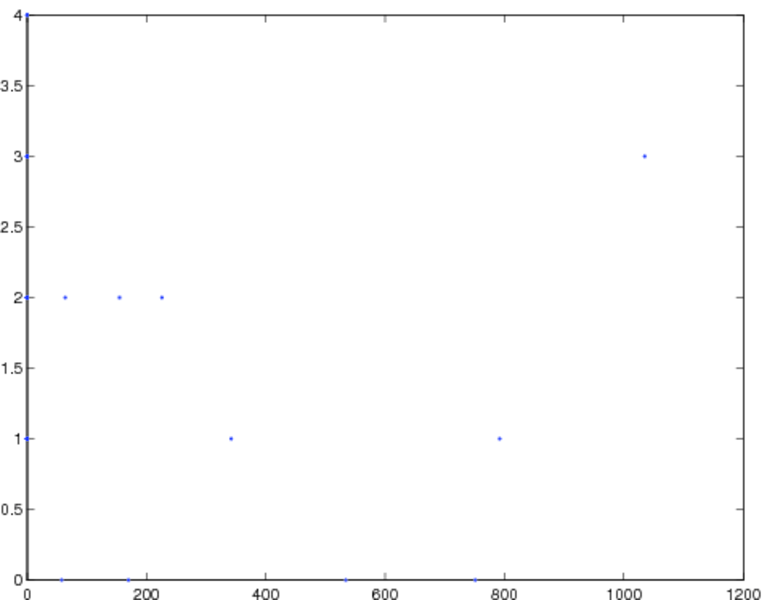
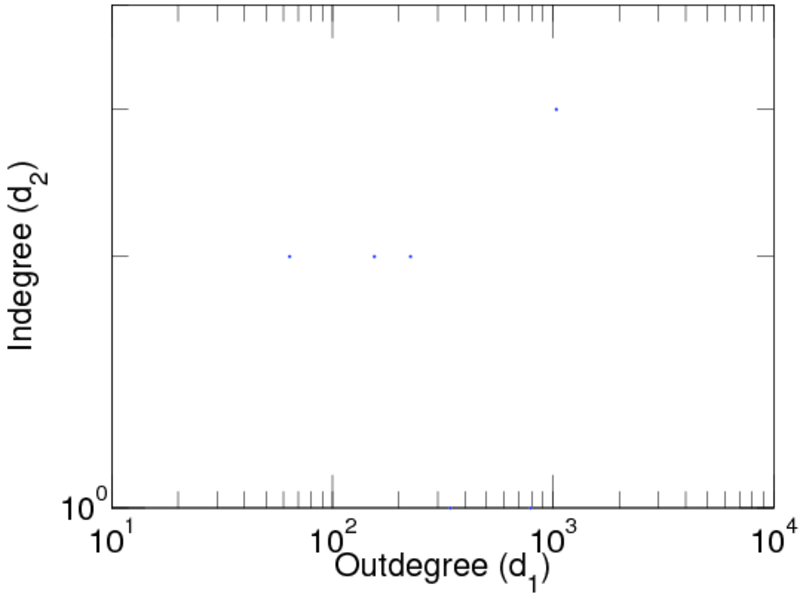
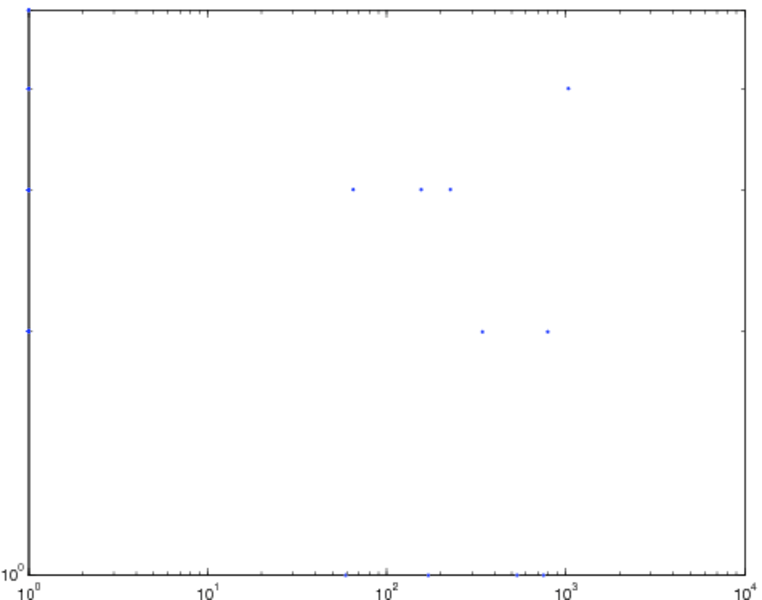
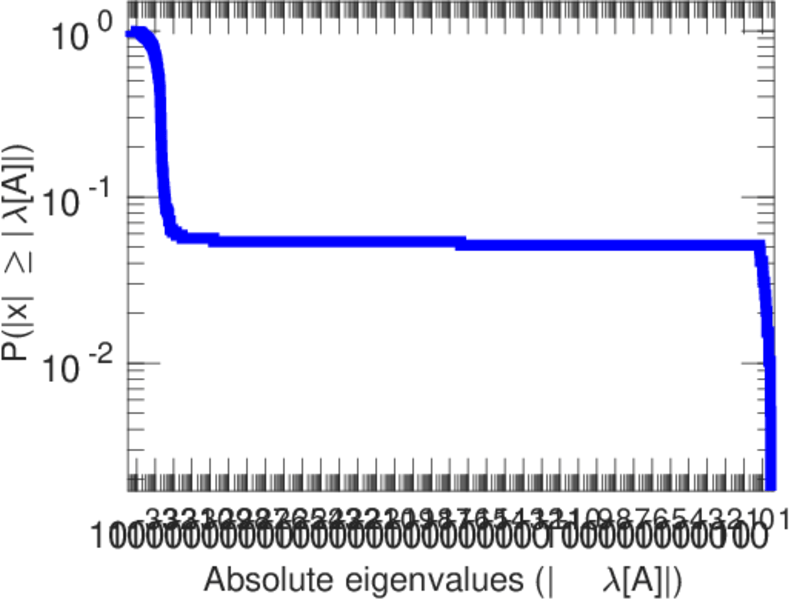
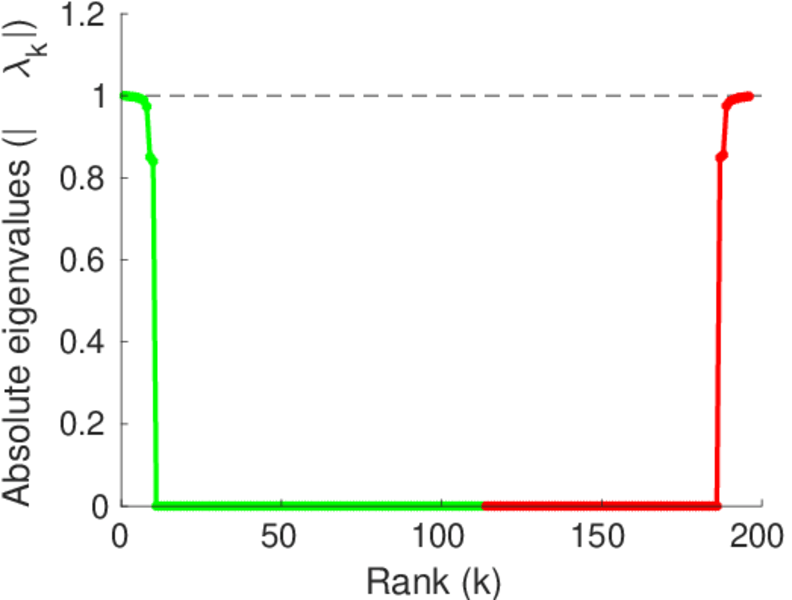
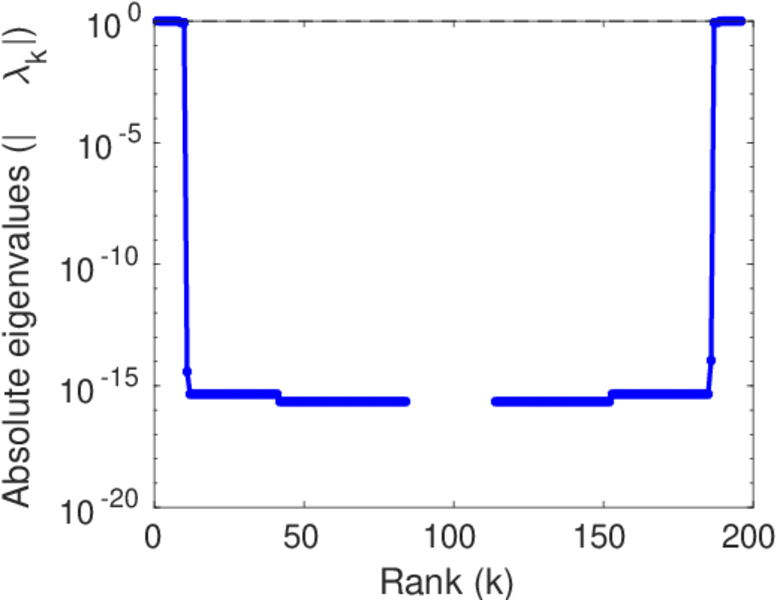
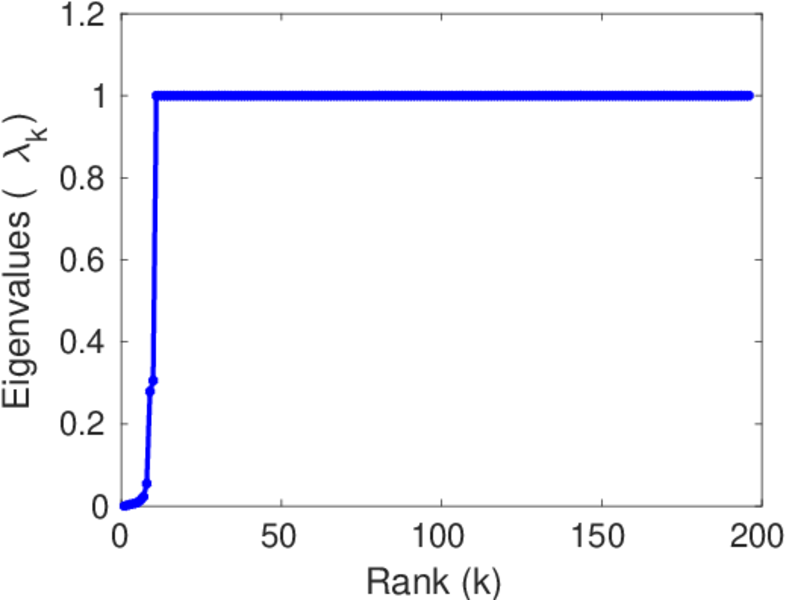
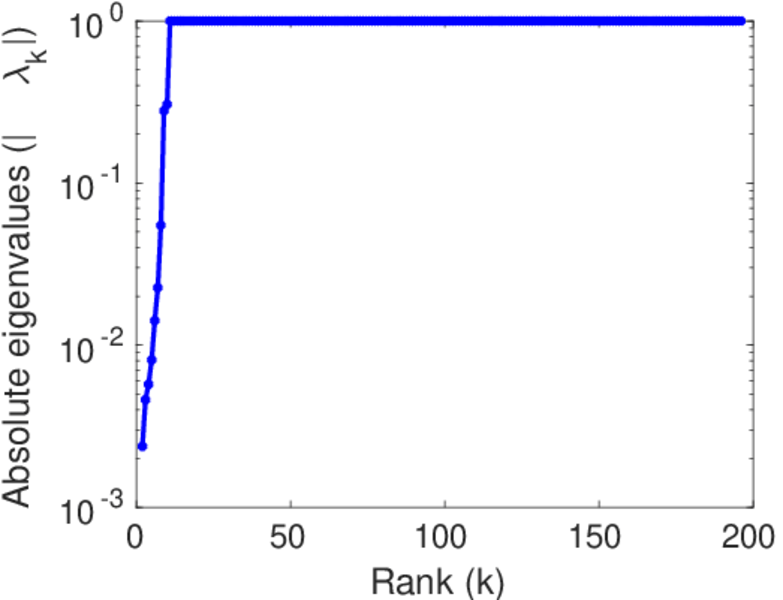
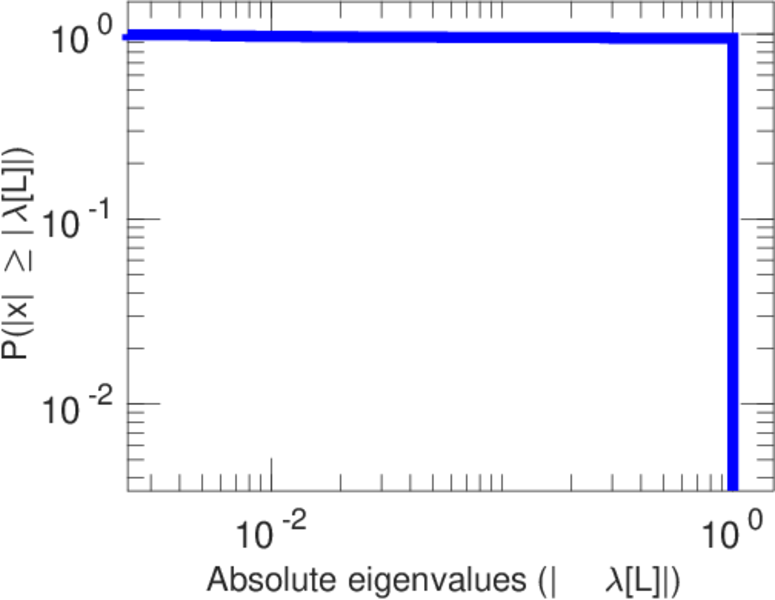
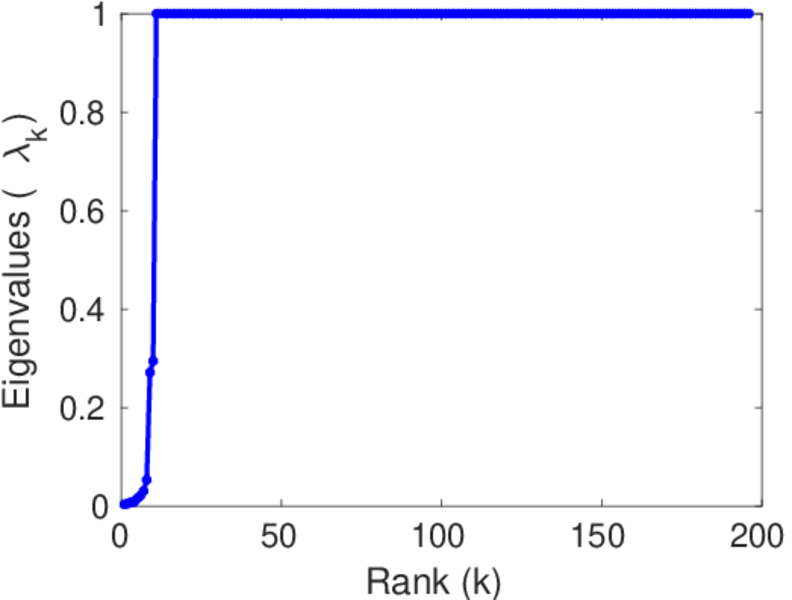
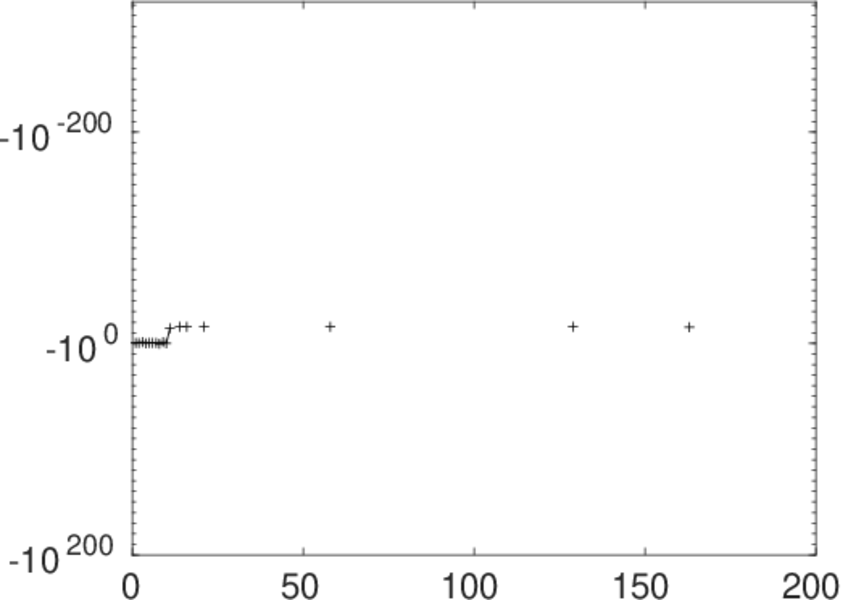
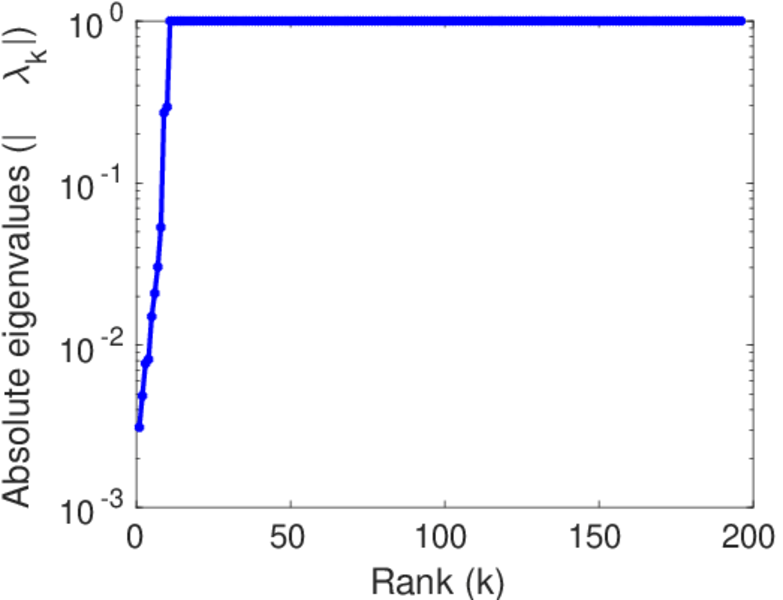
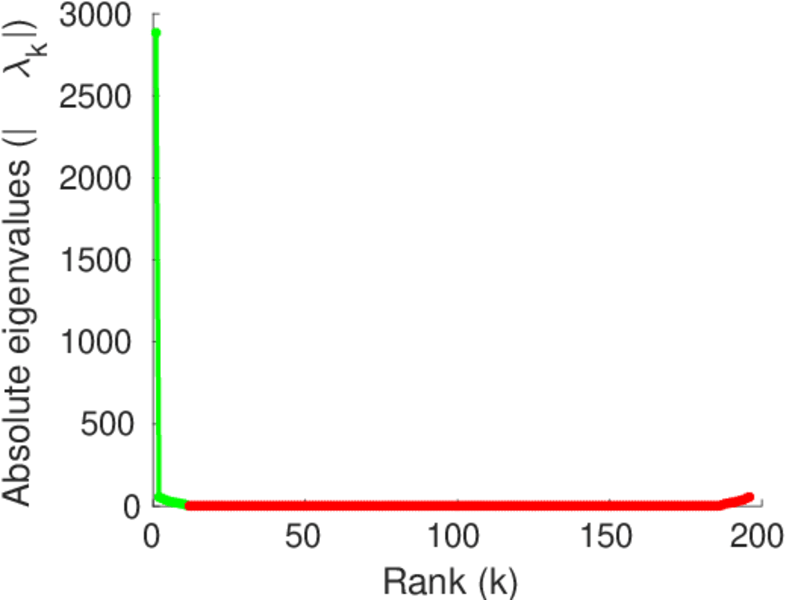
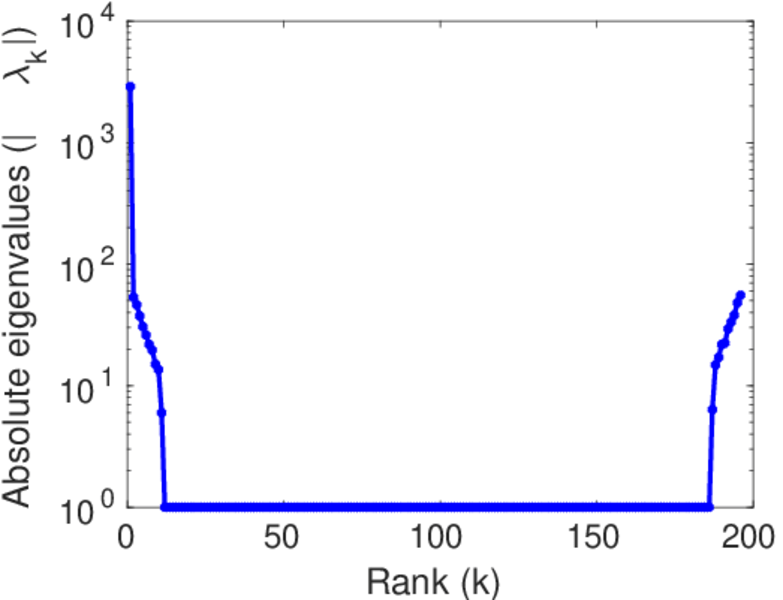
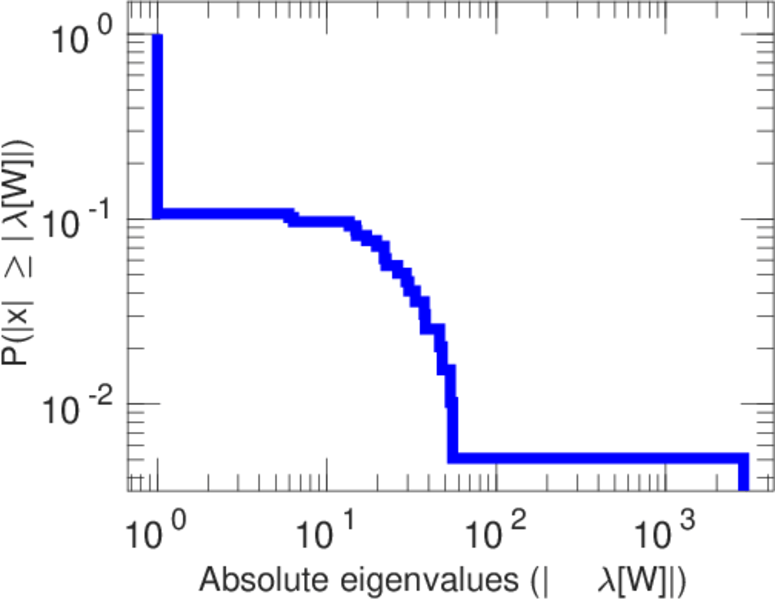
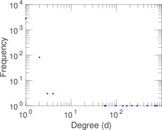
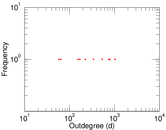
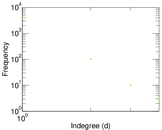
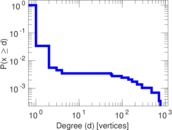
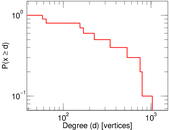
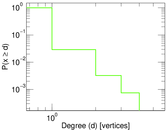
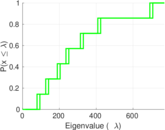
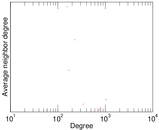
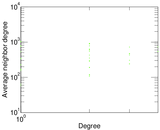
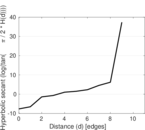
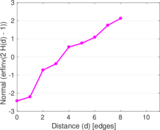
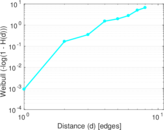
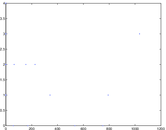
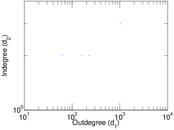
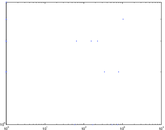
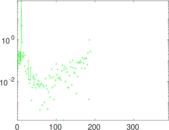
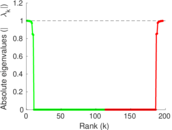
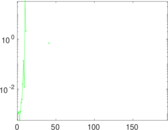
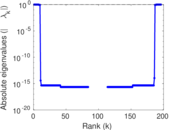
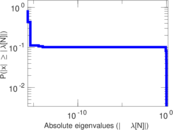
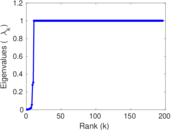
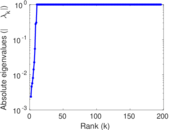
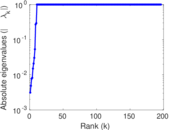
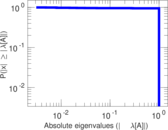
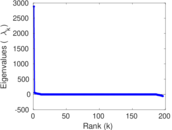
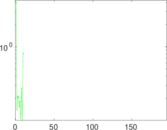
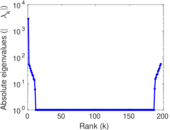
Plots

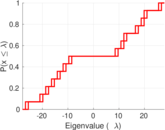


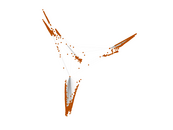

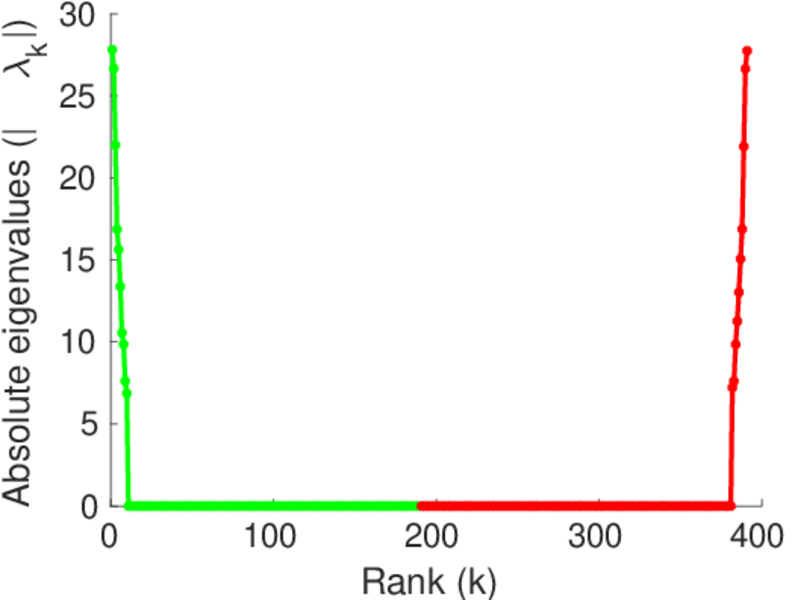
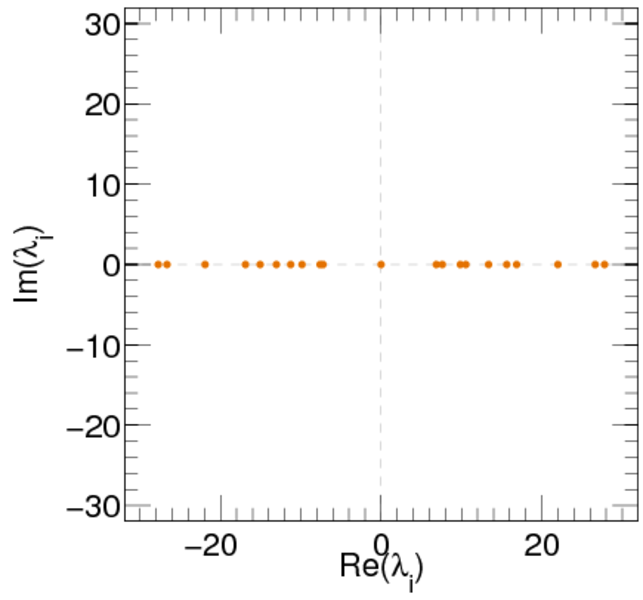
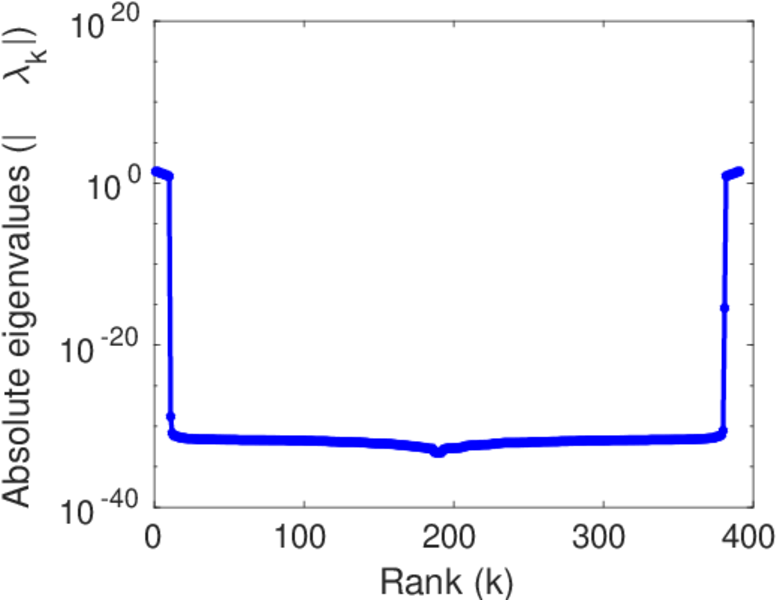
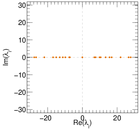
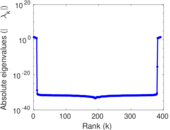
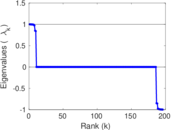
Matrix decompositions plots


Downloads
References
|
[1]
|
Jérôme Kunegis.
KONECT – The Koblenz Network Collection.
In Proc. Int. Conf. on World Wide Web Companion, pages
1343–1350, 2013.
[ http ]
|
|
[2]
|
Julian McAuley and Jure Leskovec.
Learning to discover social circles in ego networks.
In Adv. in Neural Inf. Process. Syst., pages 548–556. 2012.
|
 KONECT ‣ Networks ‣
Buy Me a Coffee
KONECT ‣ Networks ‣
Buy Me a Coffee