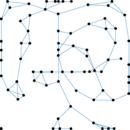
Twitter lists
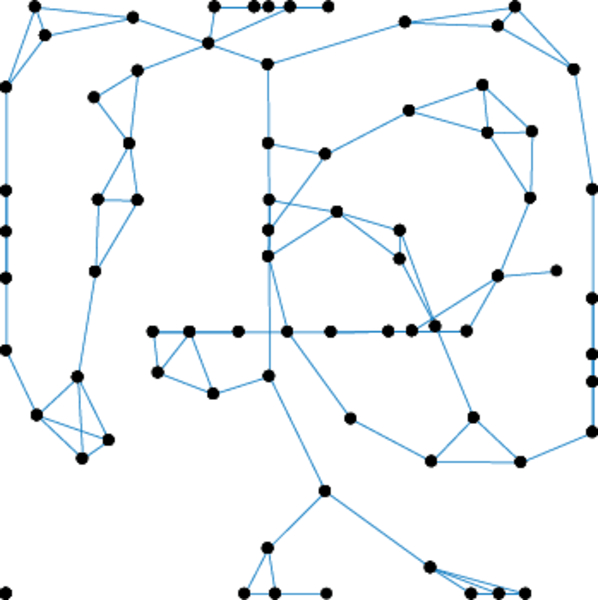
This directed networks contains Twitter user–user following information. A
node represents a user. An edge indicates that the user represented by the left
node follows the user represented by the right node.
Metadata
Statistics
| Size | n = | 23,370
|
| Volume | m = | 33,101
|
| Loop count | l = | 0
|
| Wedge count | s = | 1,231,177
|
| Claw count | z = | 43,439,459
|
| Cross count | x = | 1,457,090,152
|
| Triangle count | t = | 8,804
|
| Square count | q = | 165,762
|
| 4-Tour count | T4 = | 6,316,466
|
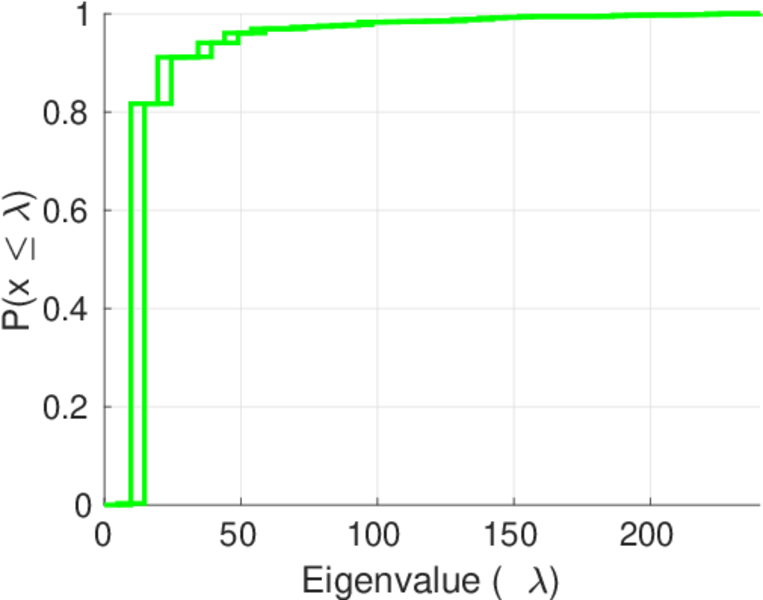
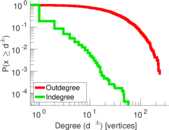
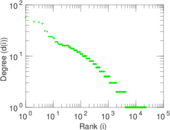
| Maximum degree | dmax = | 239
|
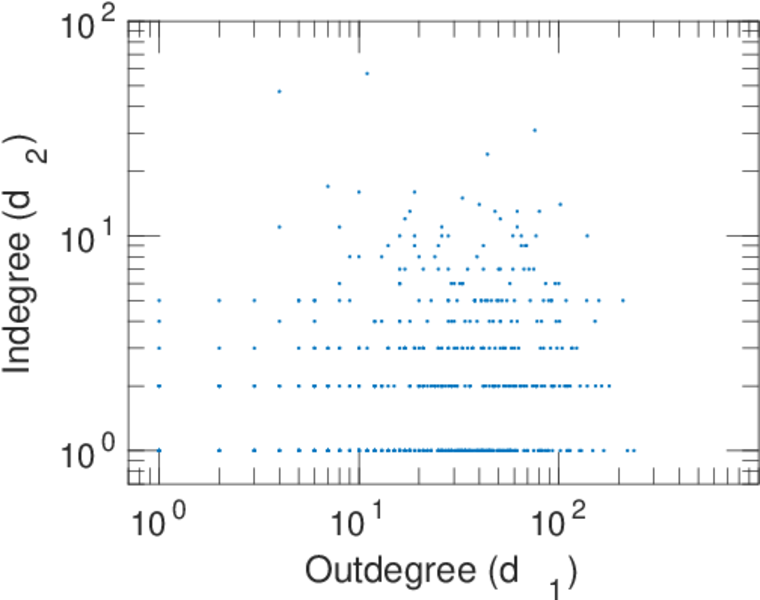
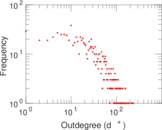
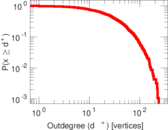
| Maximum outdegree | d+max = | 238
|
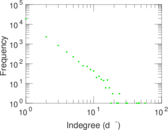
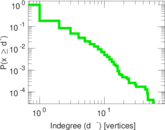
| Maximum indegree | d−max = | 57
|
| Average degree | d = | 2.832 78
|
| Fill | p = | 6.060 97 × 10−5
|
| Size of LCC | N = | 22,322
|
| Size of LSCC | Ns = | 38
|
| Relative size of LSCC | Nrs = | 0.001 626 02
|
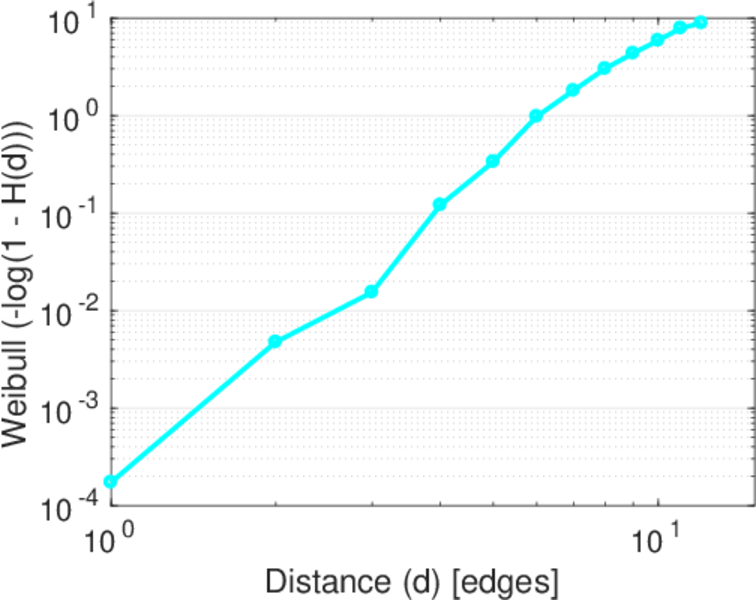
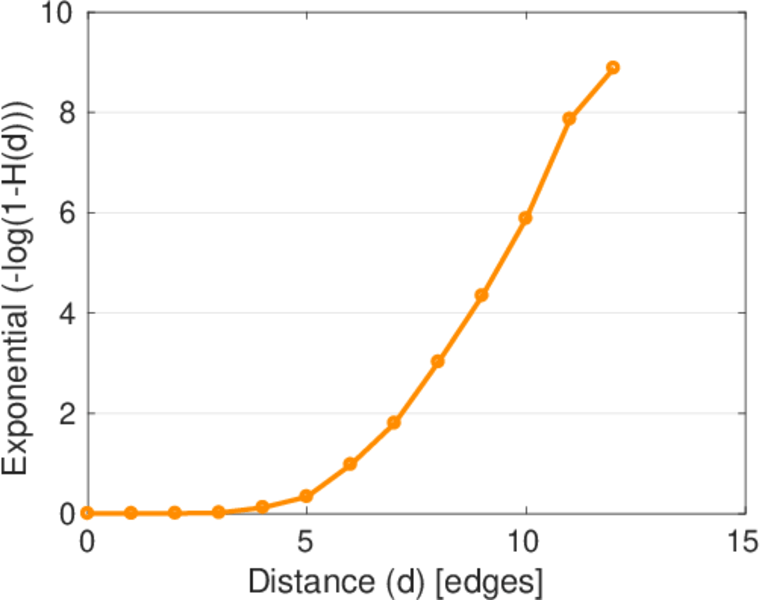
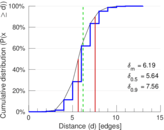
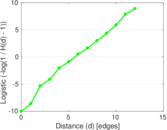
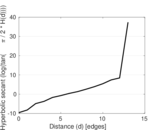
| Diameter | δ = | 15
|
| 50-Percentile effective diameter | δ0.5 = | 5.636 00
|
| 90-Percentile effective diameter | δ0.9 = | 7.559 40
|
| Median distance | δM = | 6
|
| Mean distance | δm = | 6.188 24
|
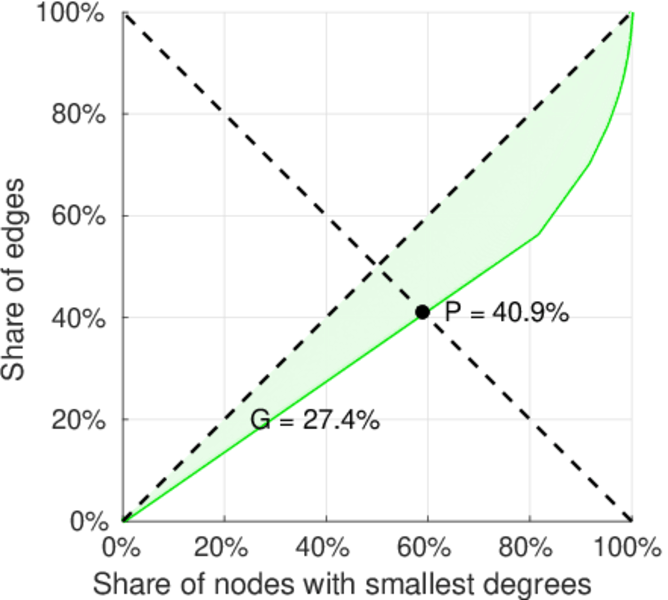
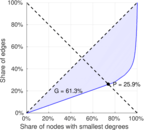
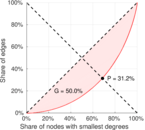
| Gini coefficient | G = | 0.613 256
|
| Balanced inequality ratio | P = | 0.259 448
|
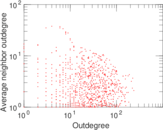
| Outdegree balanced inequality ratio | P+ = | 0.311 803
|
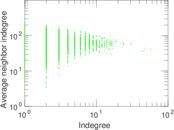
| Indegree balanced inequality ratio | P− = | 0.409 293
|
| Relative edge distribution entropy | Her = | 0.867 531
|
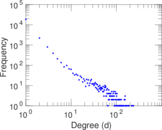
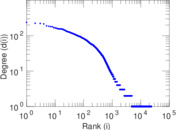
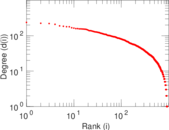
| Power law exponent | γ = | 4.333 57
|
| Tail power law exponent | γt = | 2.471 00
|
| Tail power law exponent with p | γ3 = | 2.471 00
|
| p-value | p = | 0.000 00
|
| Outdegree tail power law exponent with p | γ3,o = | 2.941 00
|
| Outdegree p-value | po = | 0.000 00
|
| Indegree tail power law exponent with p | γ3,i = | 2.841 00
|
| Indegree p-value | pi = | 0.000 00
|
| Degree assortativity | ρ = | −0.477 982
|
| Degree assortativity p-value | pρ = | 0.000 00
|
| In/outdegree correlation | ρ± = | −0.058 215 9
|
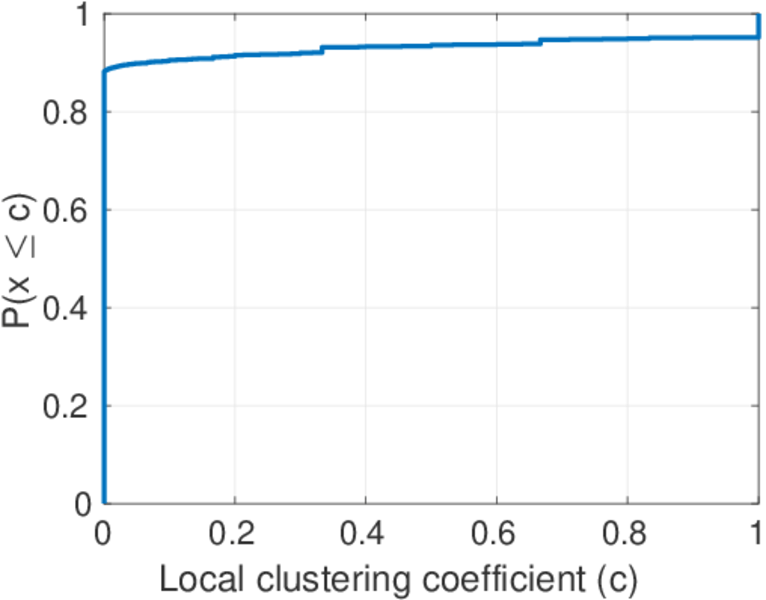
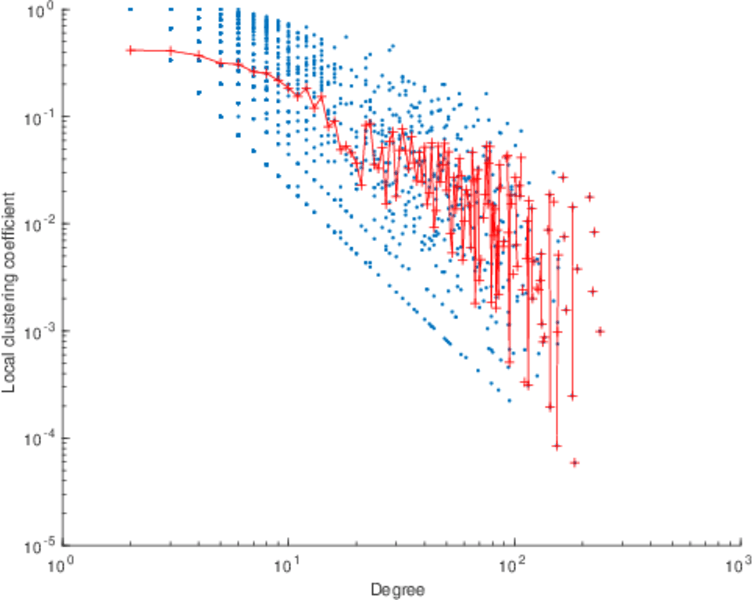
| Clustering coefficient | c = | 0.021 452 6
|
| Directed clustering coefficient | c± = | 0.207 821
|
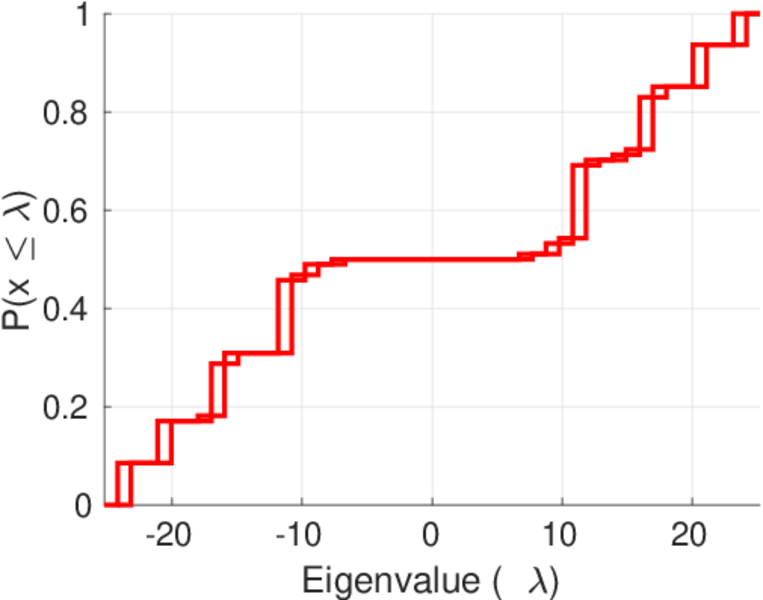
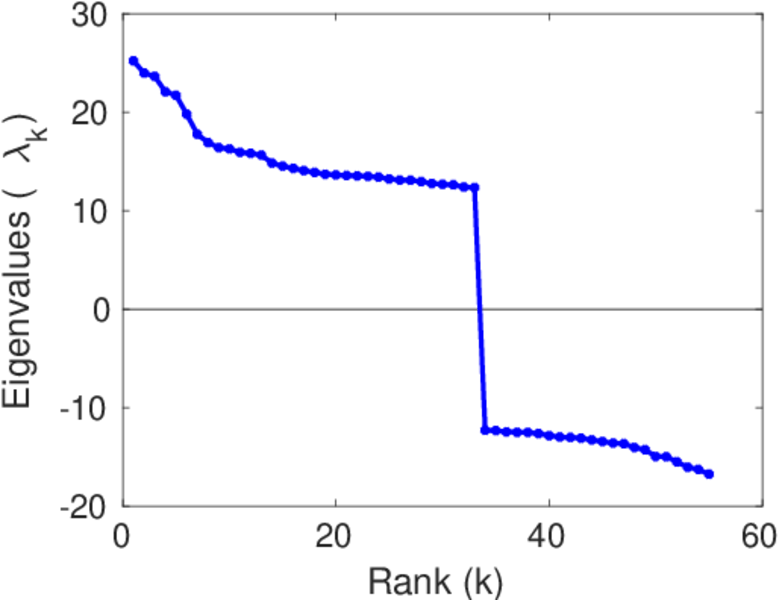
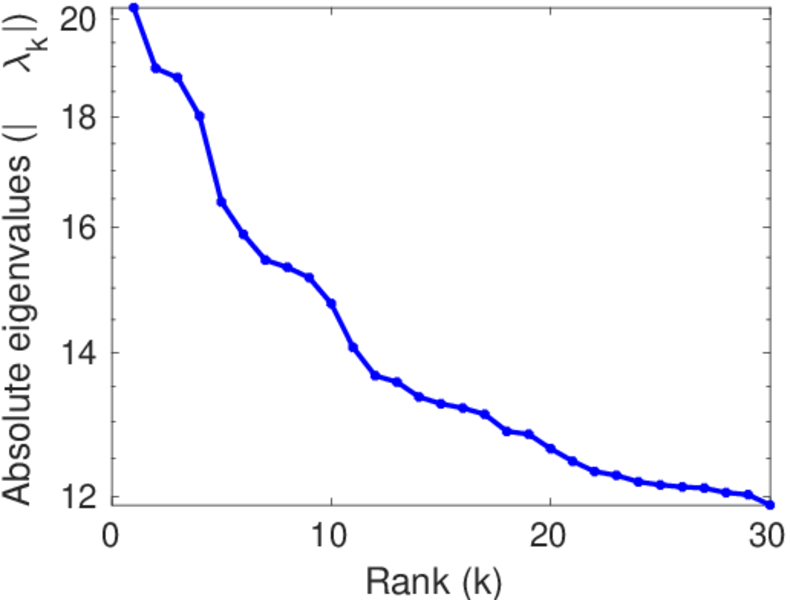
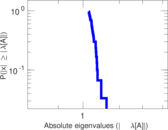
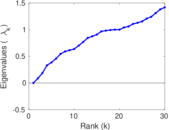
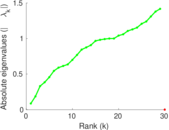
| Spectral norm | α = | 25.209 8
|
| Operator 2-norm | ν = | 20.574 3
|
| Cyclic eigenvalue | π = | 6.316 63
|
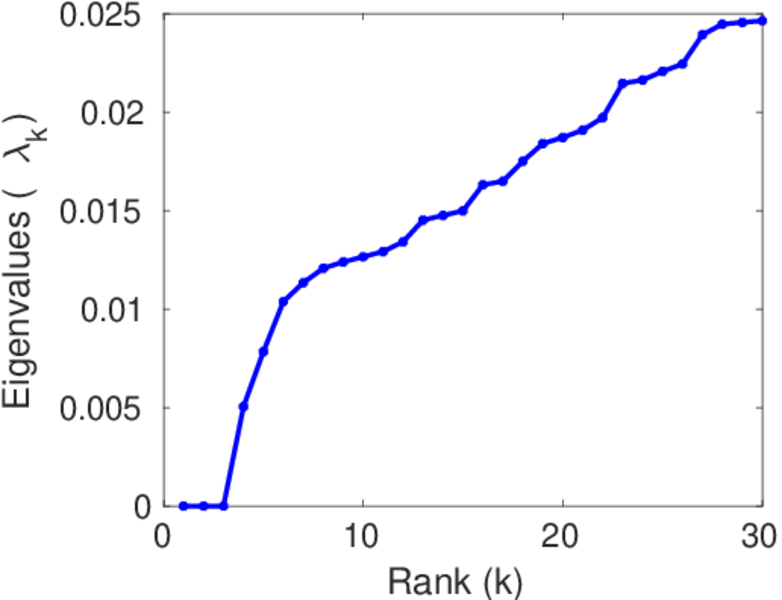
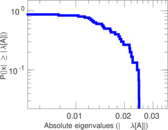
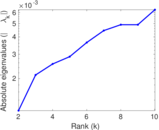
| Algebraic connectivity | a = | 0.005 031 58
|
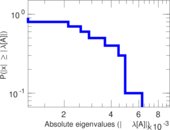
| Spectral separation | |λ1[A] / λ2[A]| = | 1.051 94
|
| Reciprocity | y = | 0.016 313 7
|
| Non-bipartivity | bA = | 0.335 034
|
| Normalized non-bipartivity | bN = | 0.002 550 68
|
| Algebraic non-bipartivity | χ = | 0.005 056 39
|
| Spectral bipartite frustration | bK = | 0.000 443 346
|
| Controllability | C = | 22,432
|
| Relative controllability | Cr = | 0.959 863
|
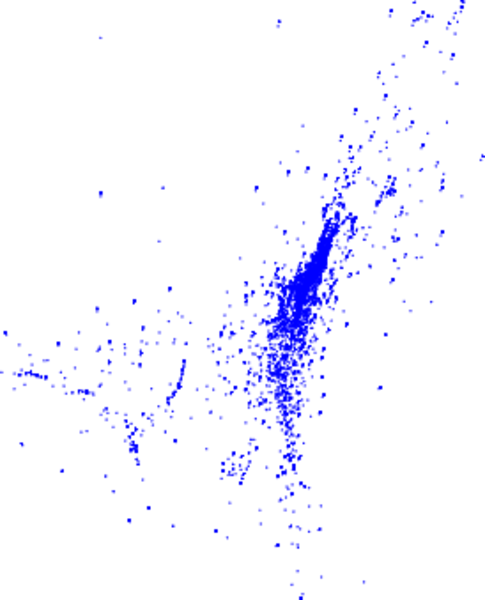
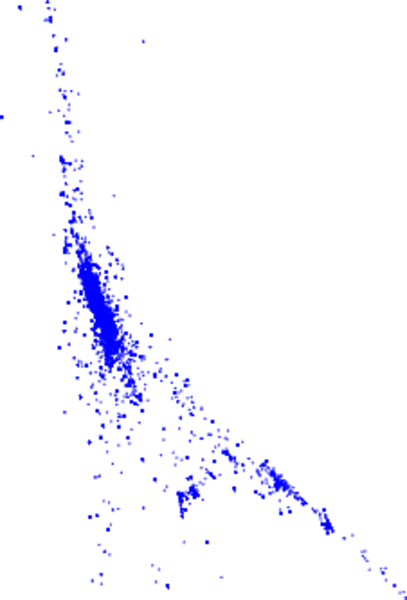
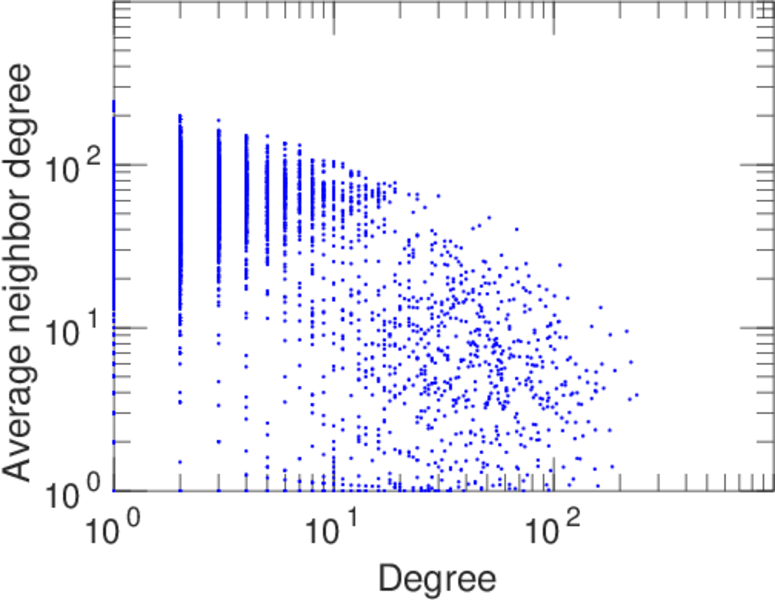
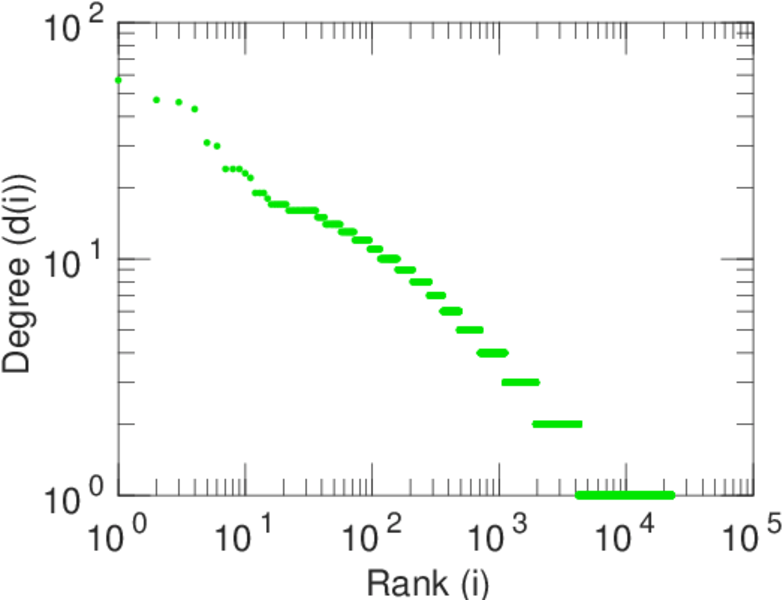
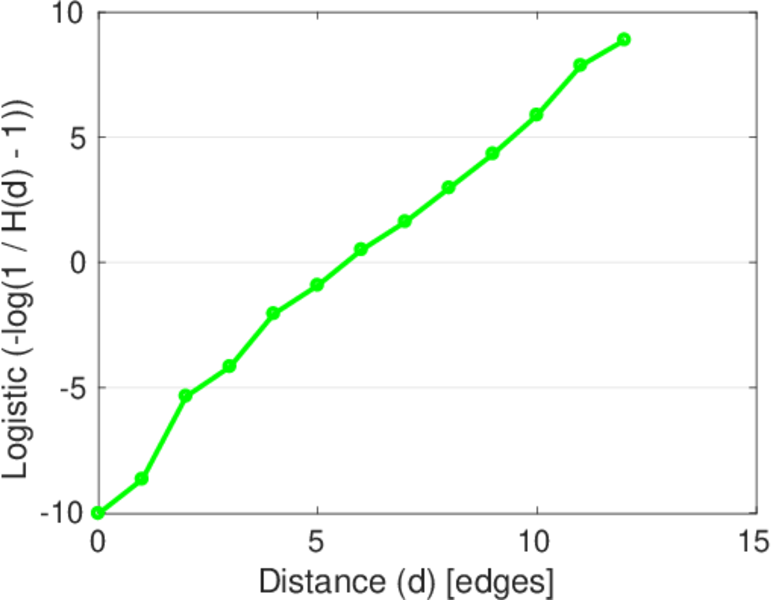
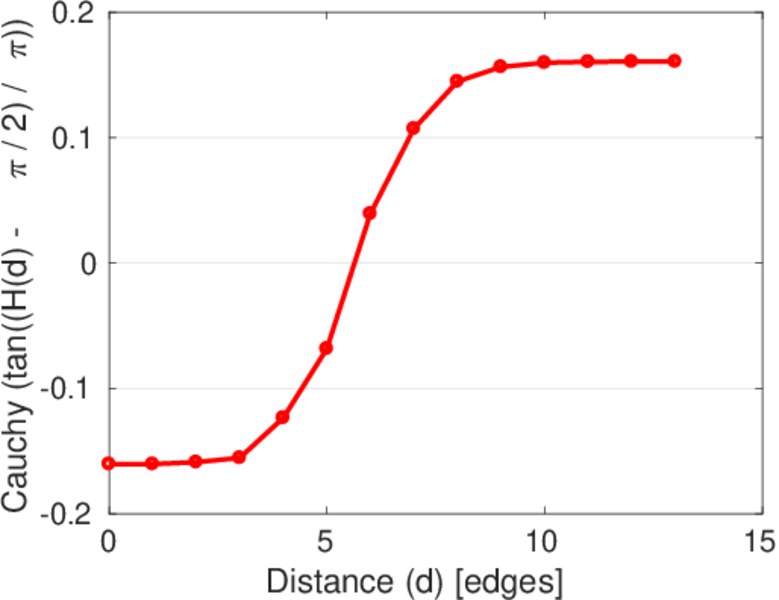
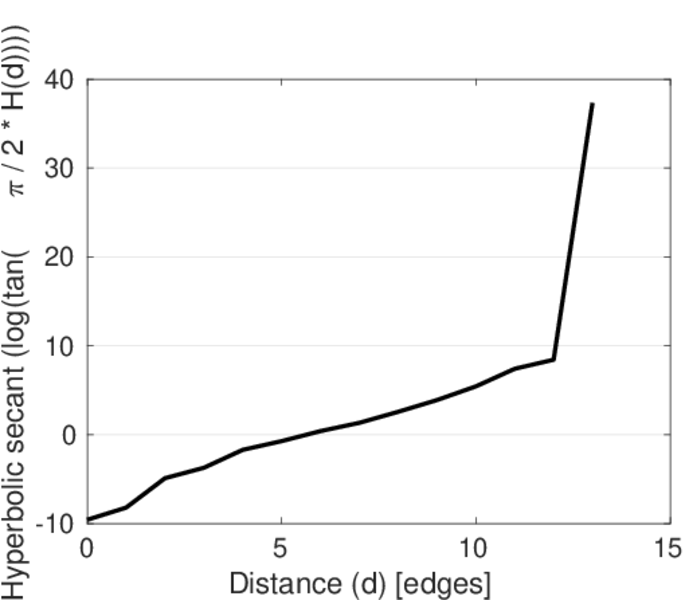
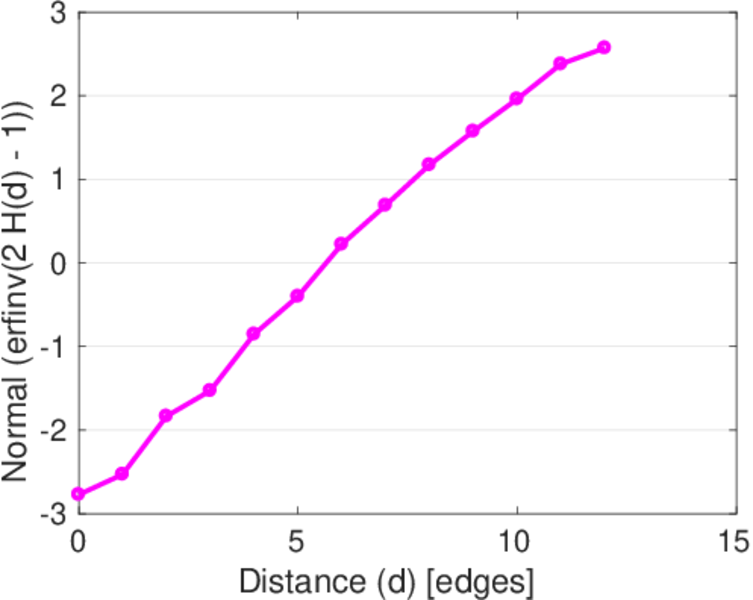
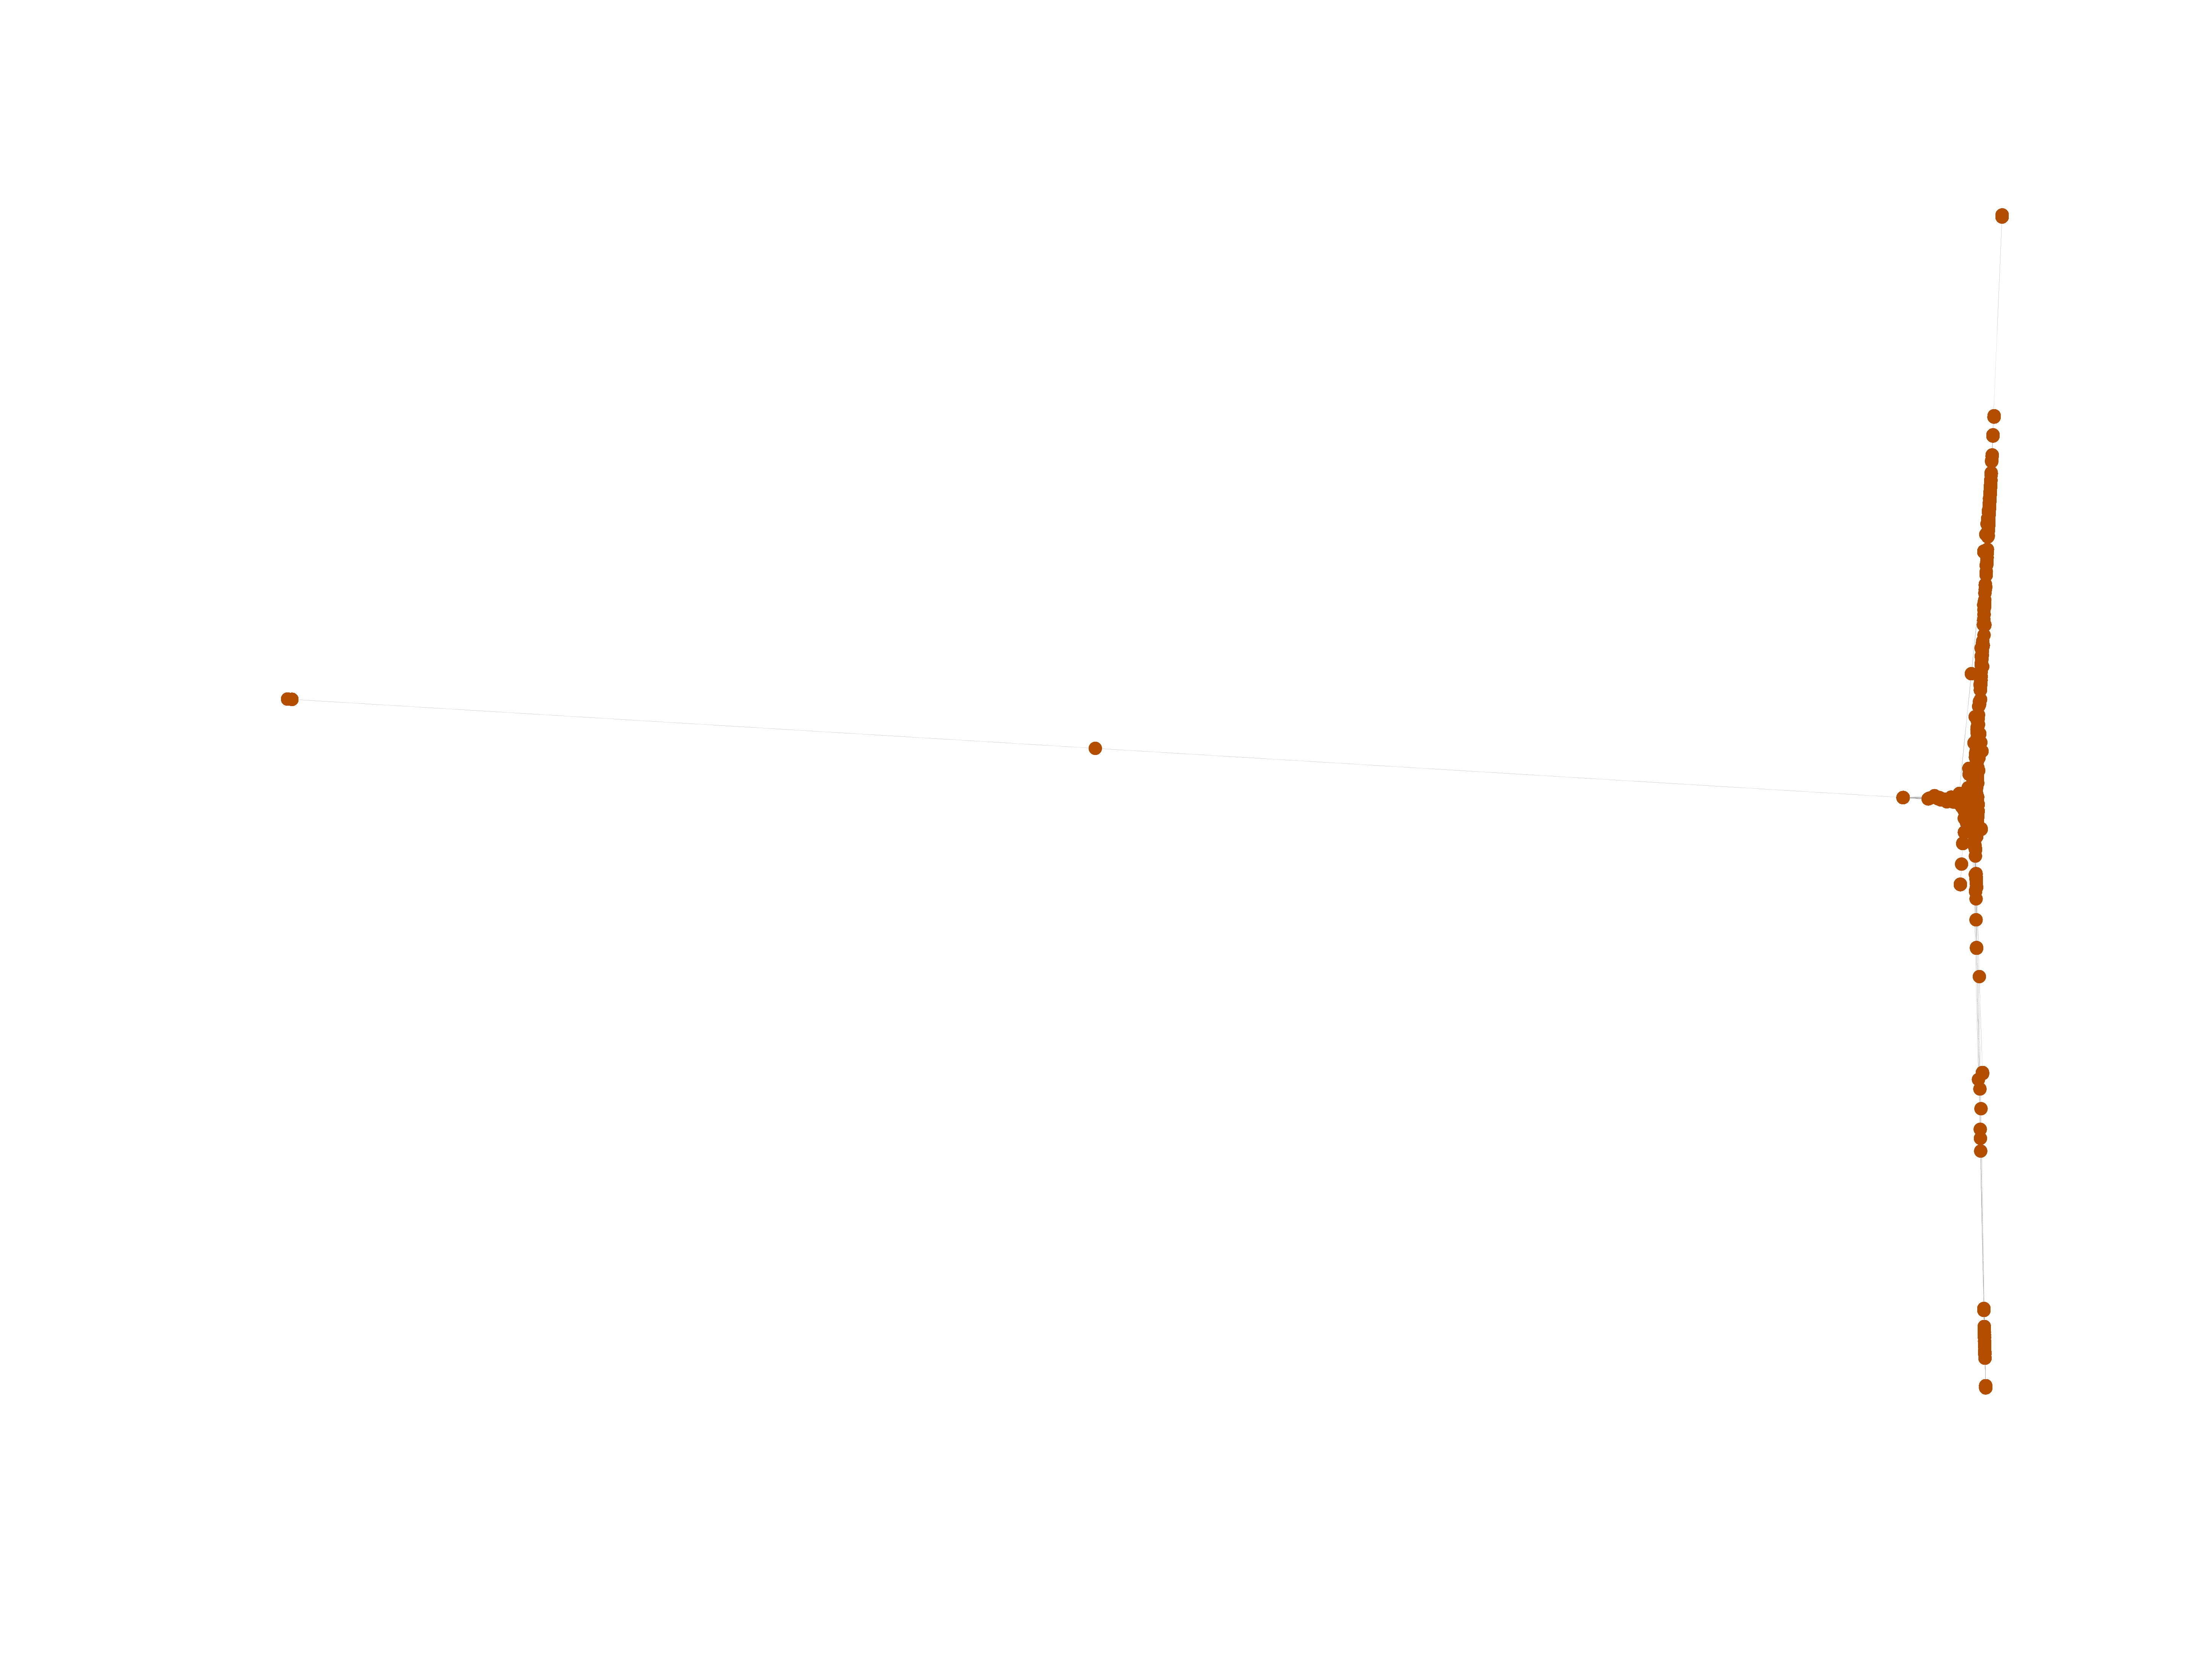
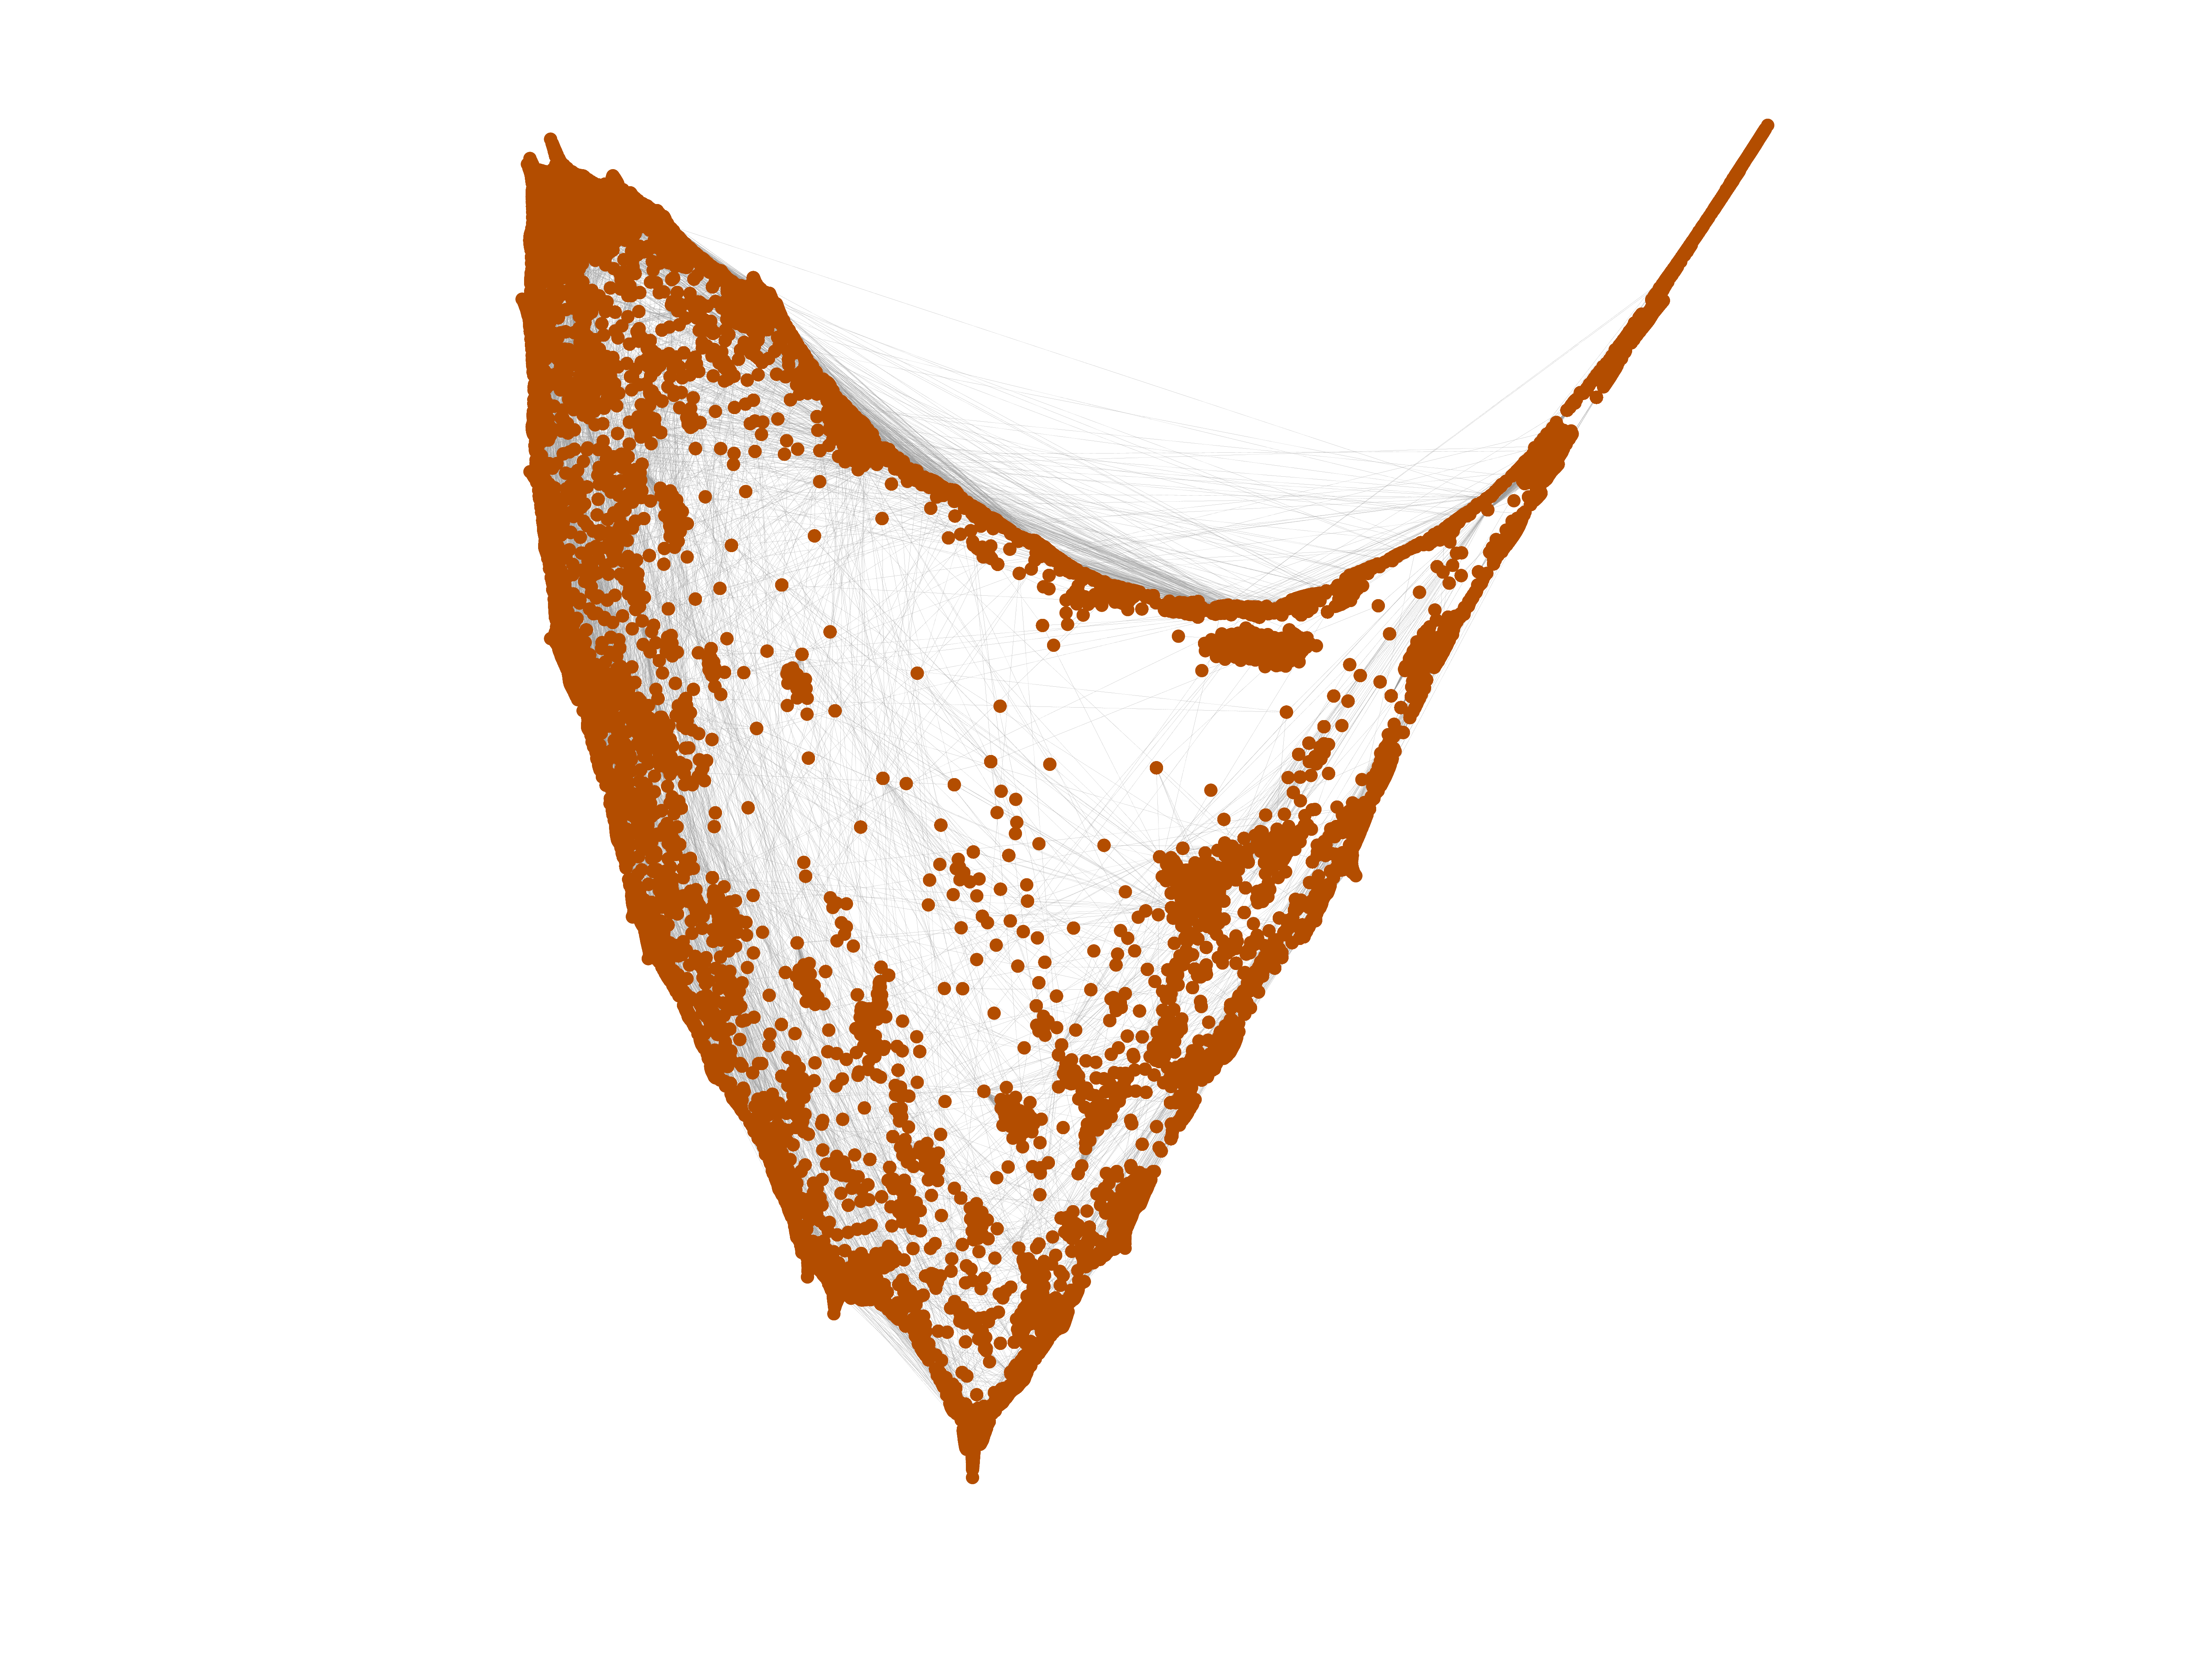
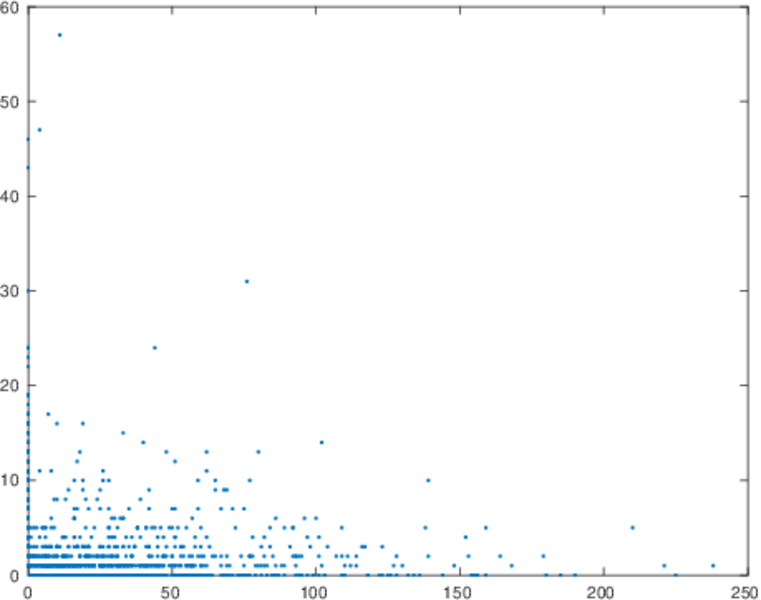
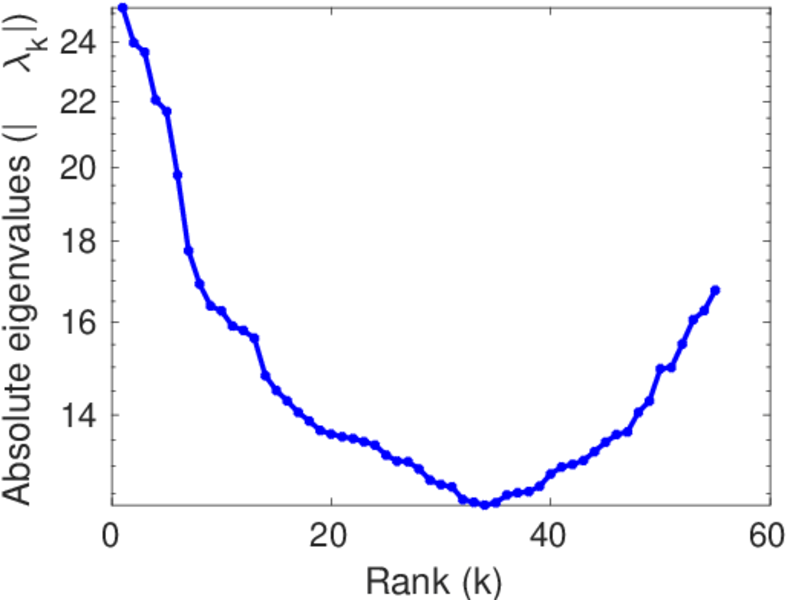
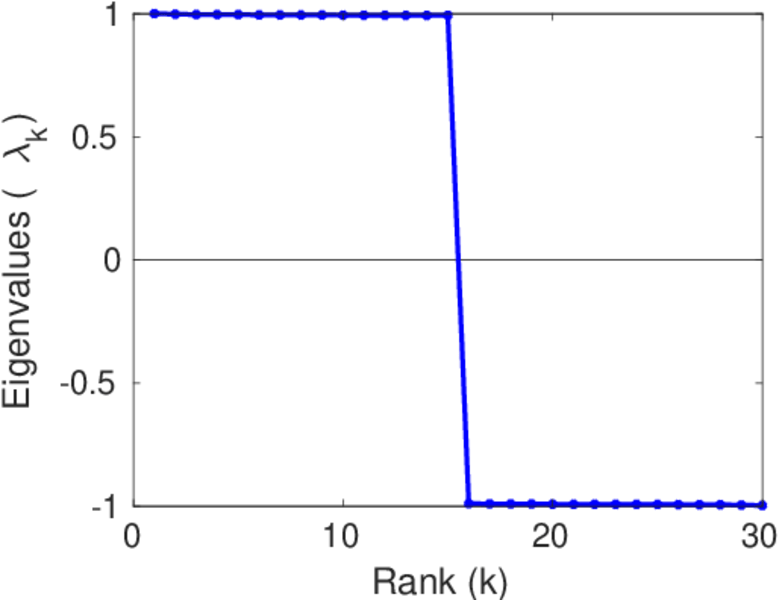
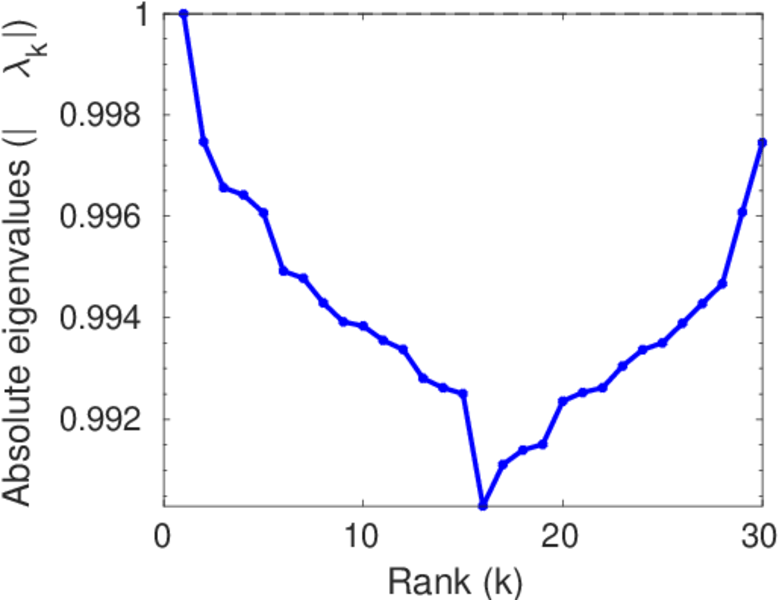
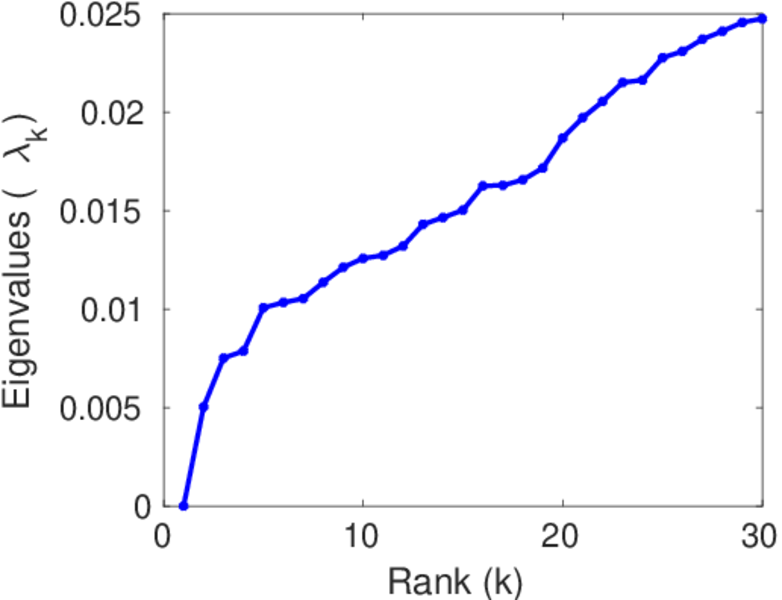
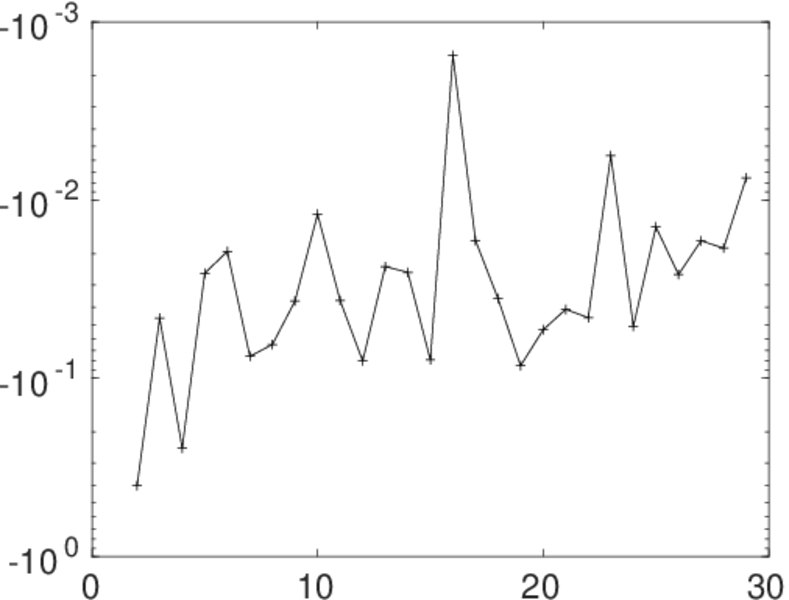
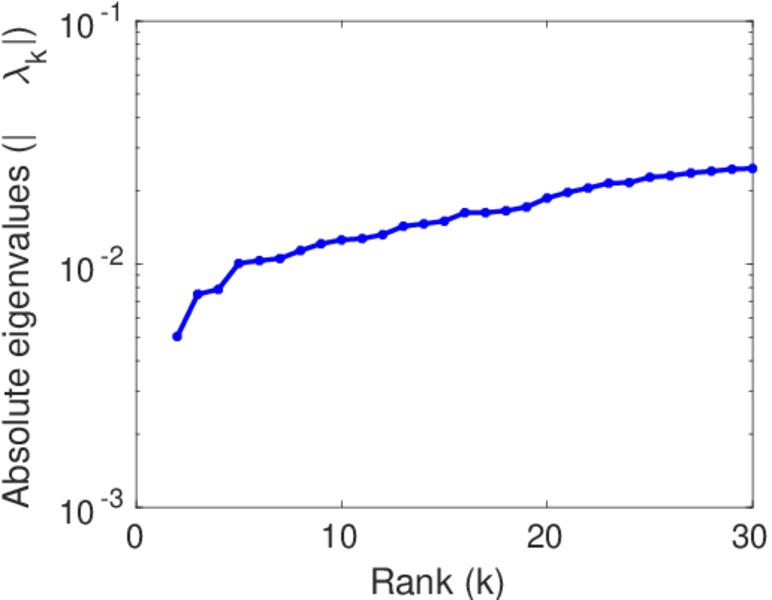
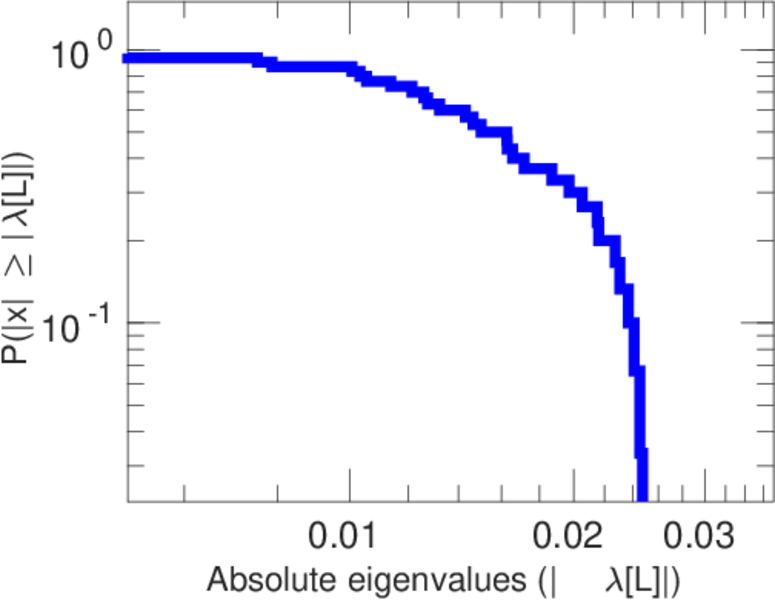
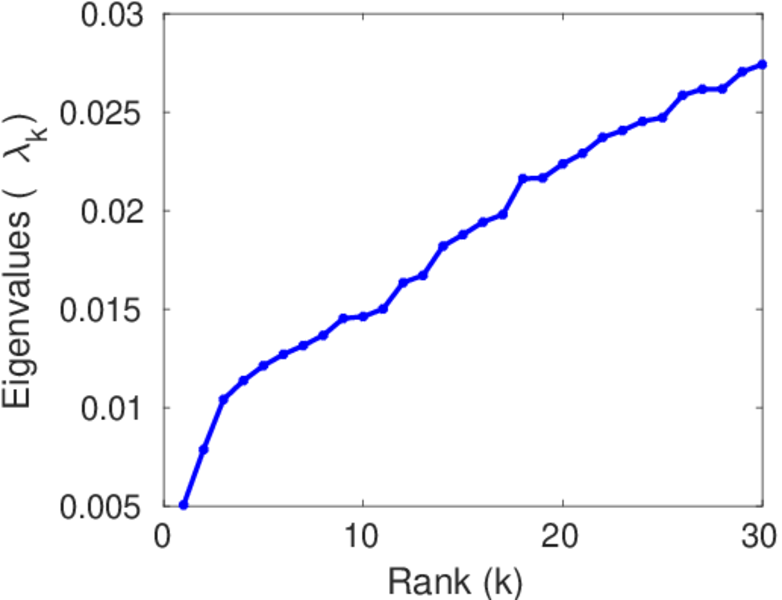
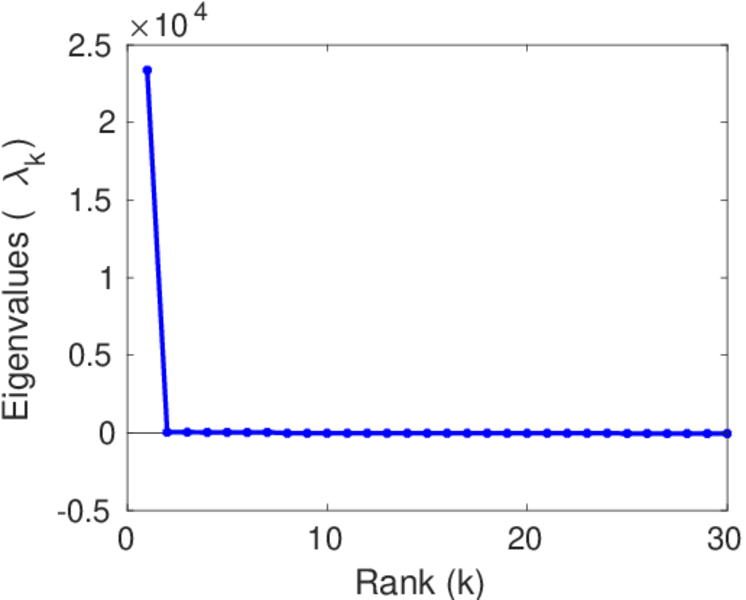
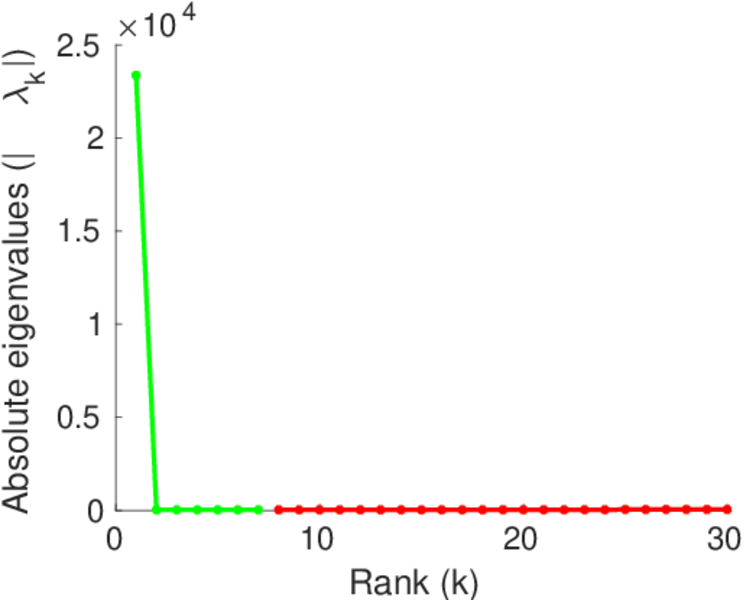
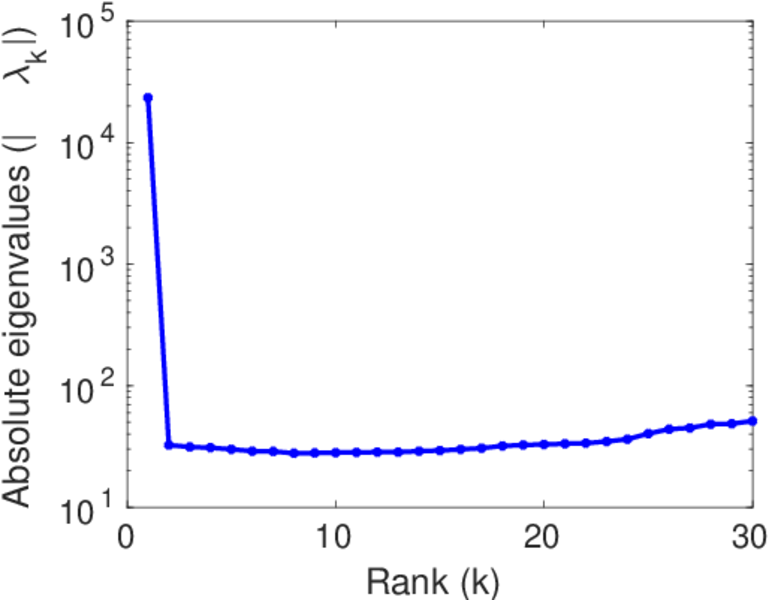
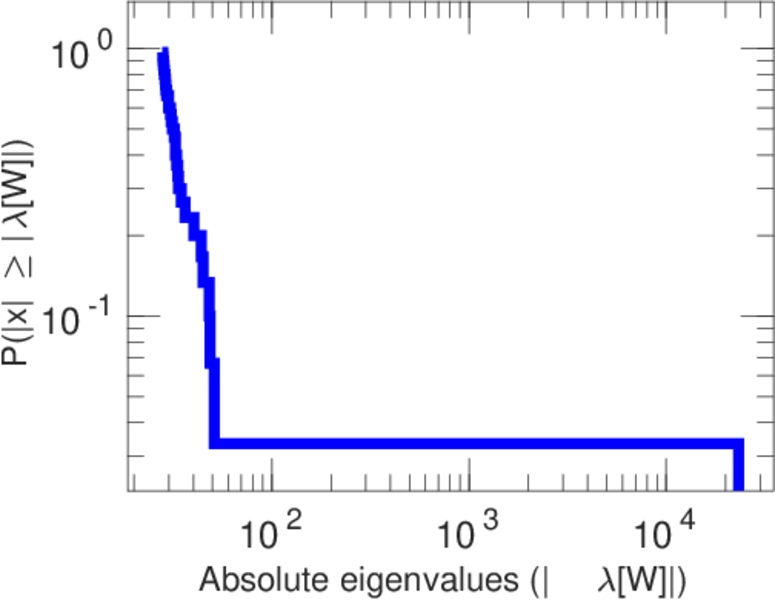
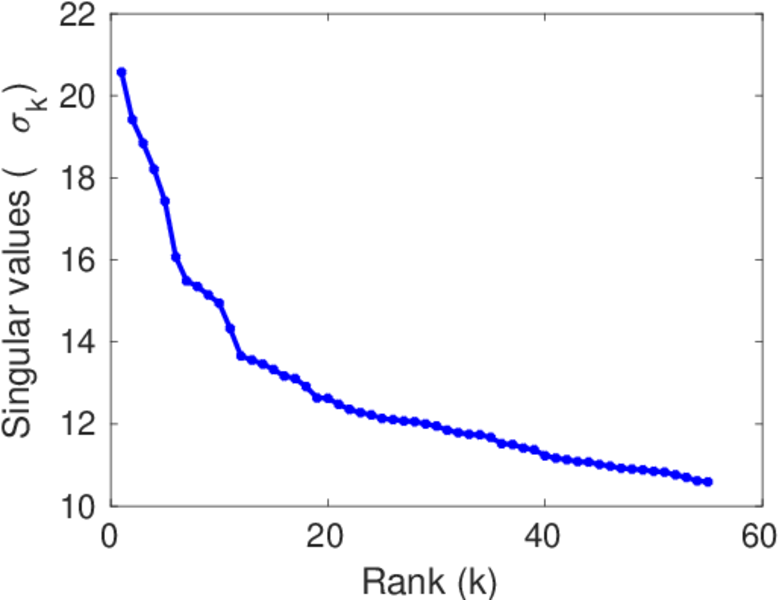
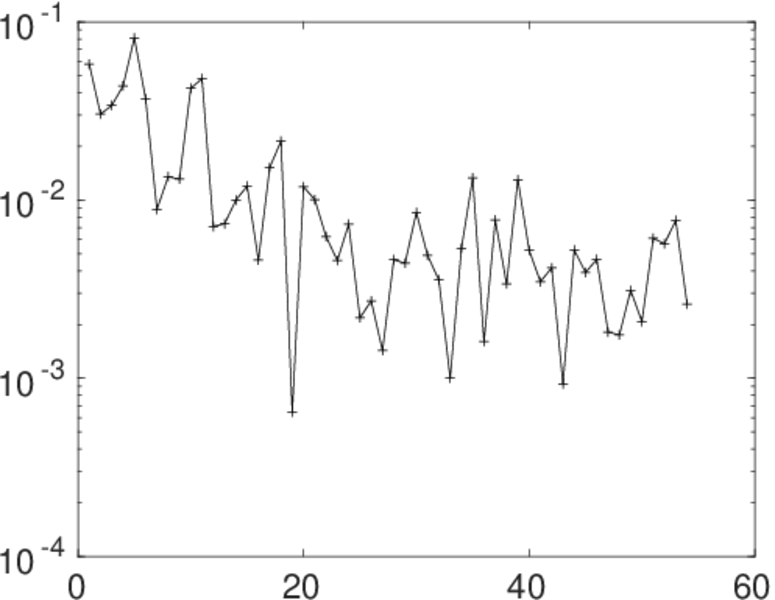
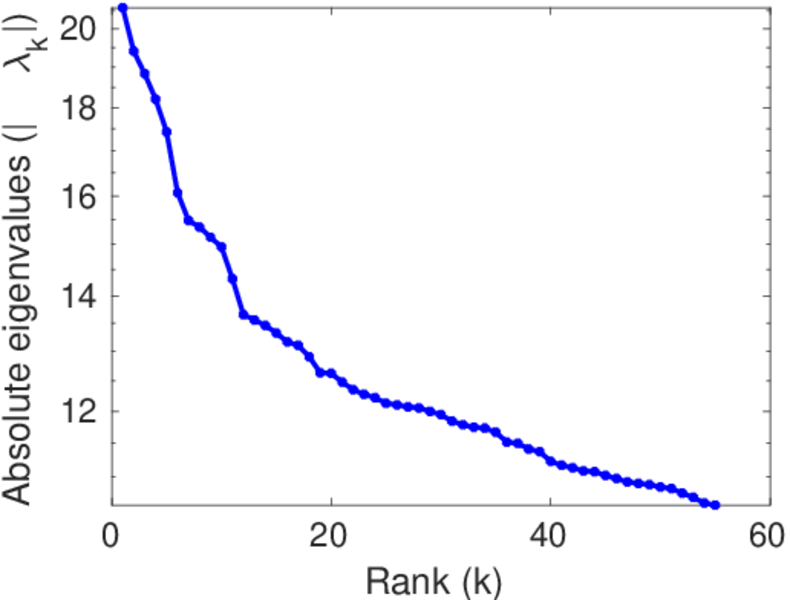
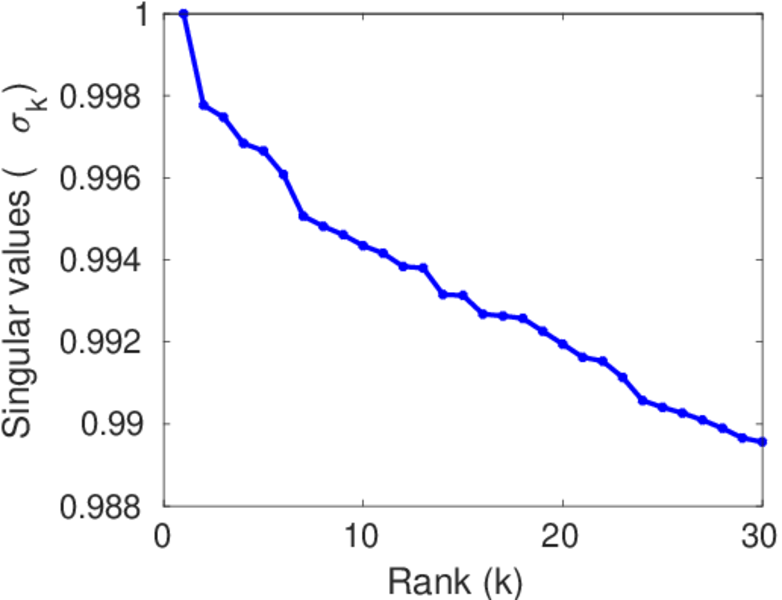
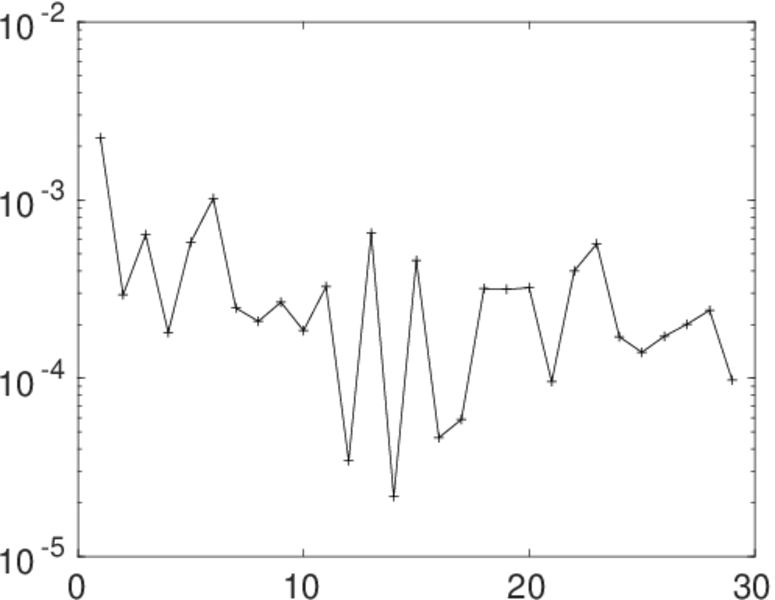
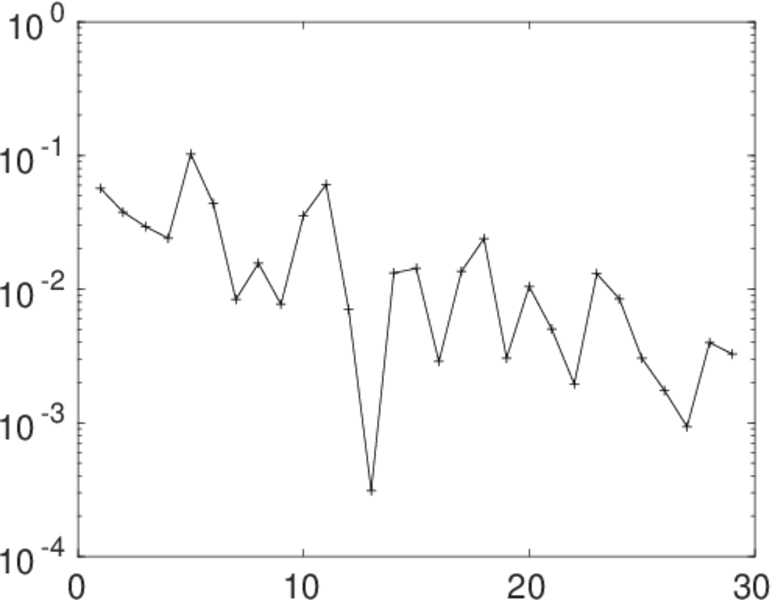
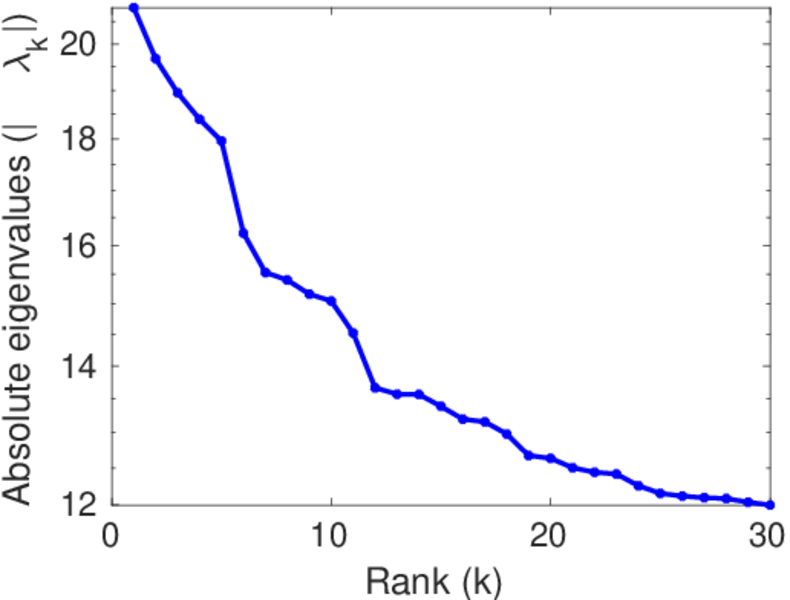
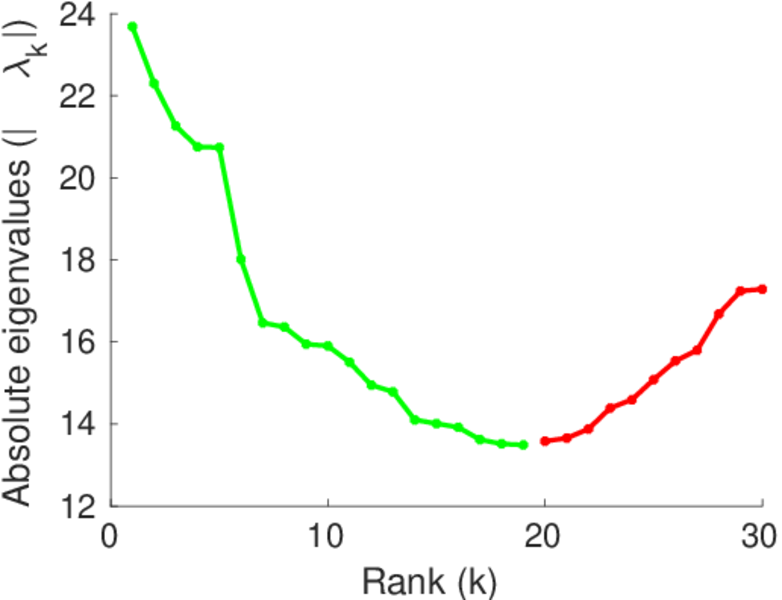
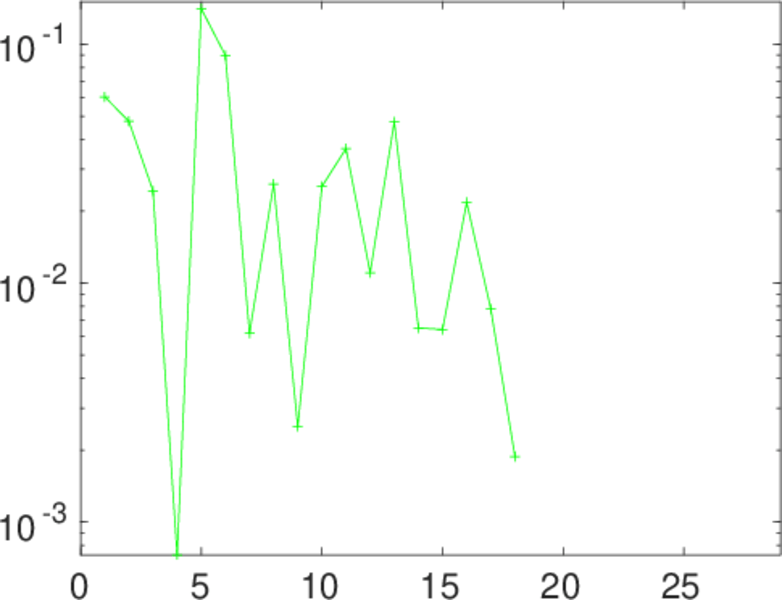
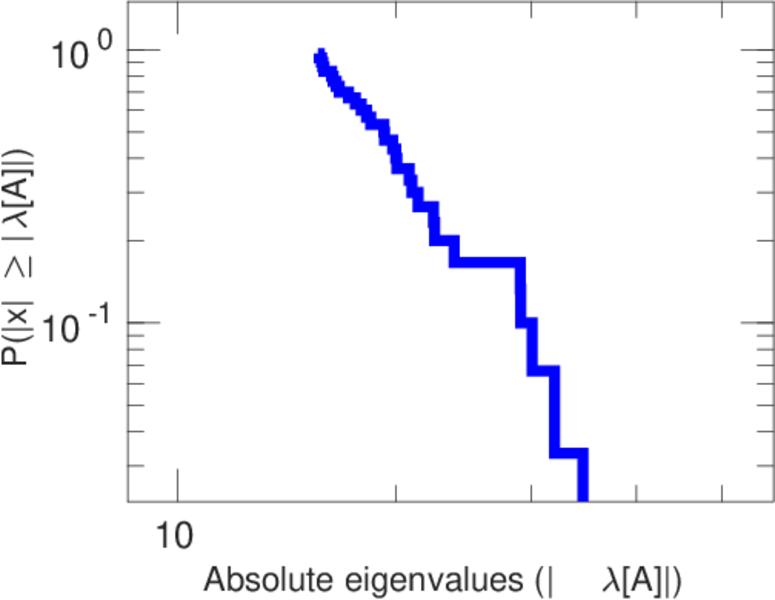
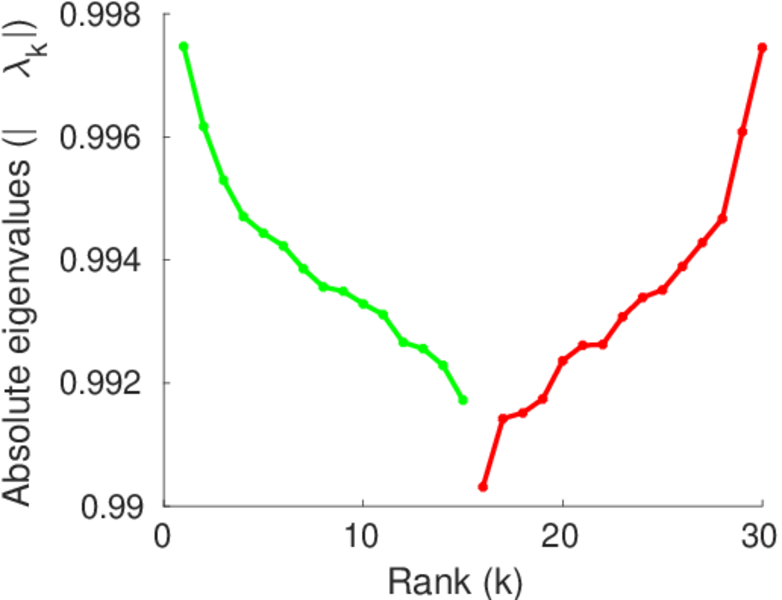
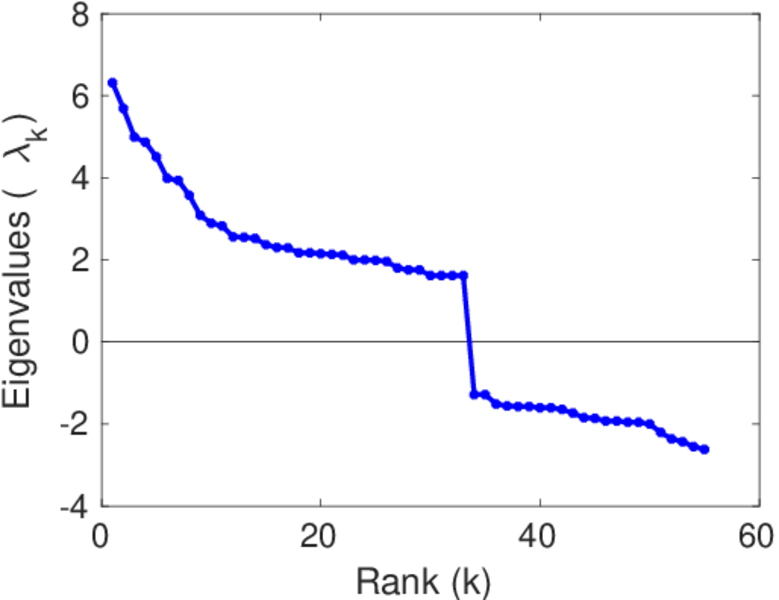
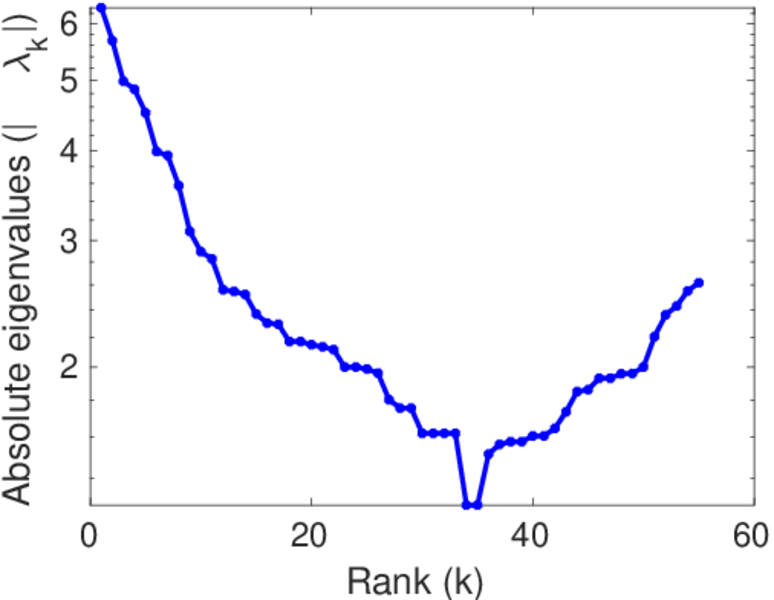
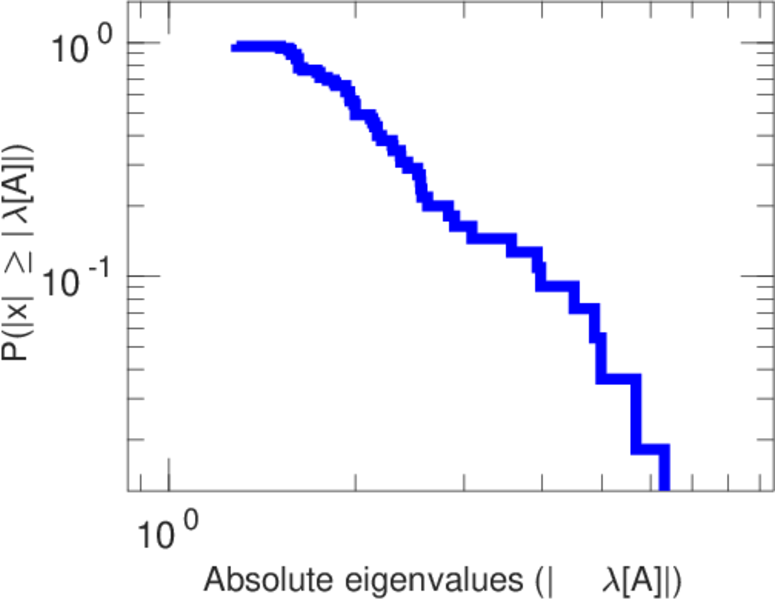
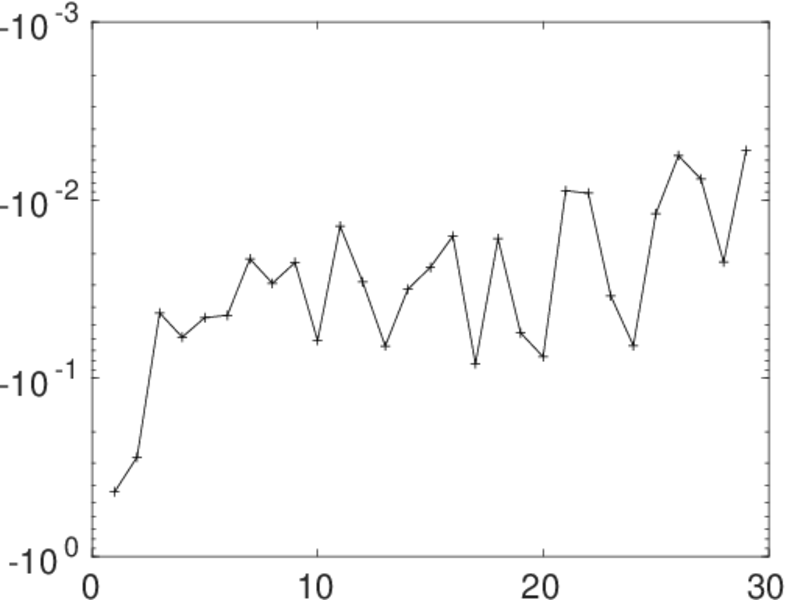
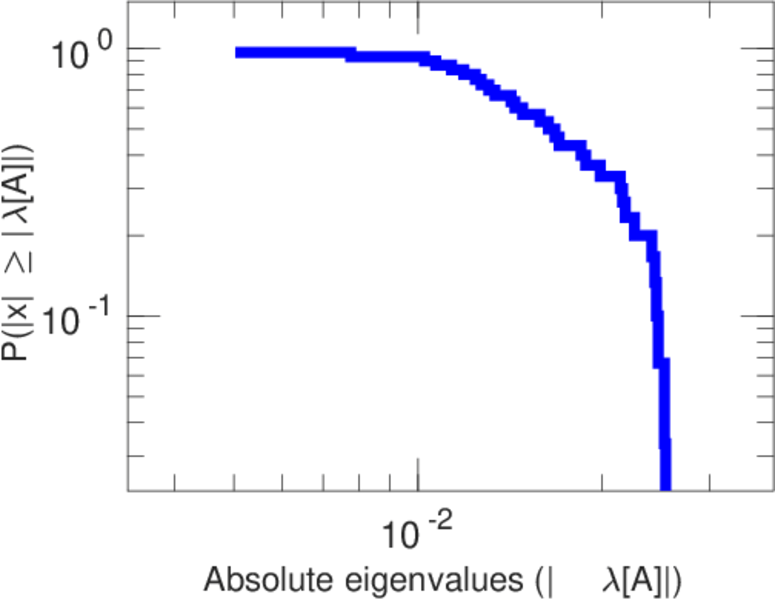
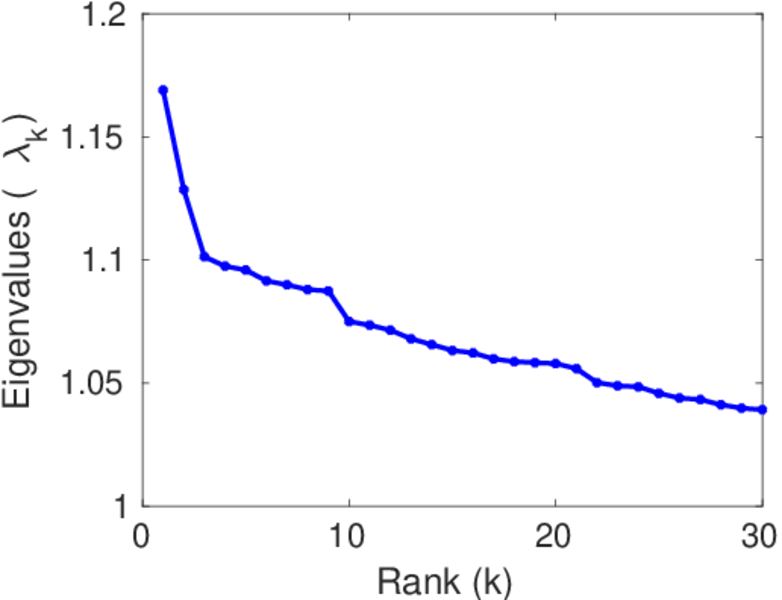
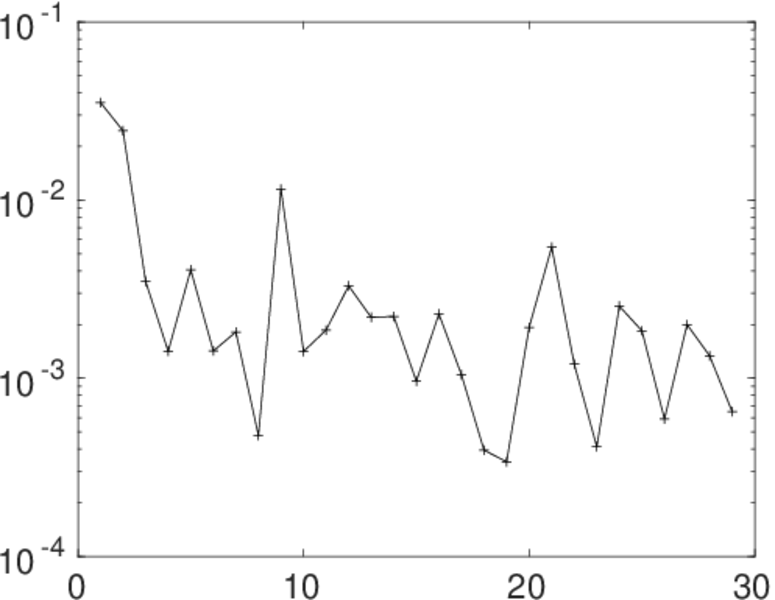
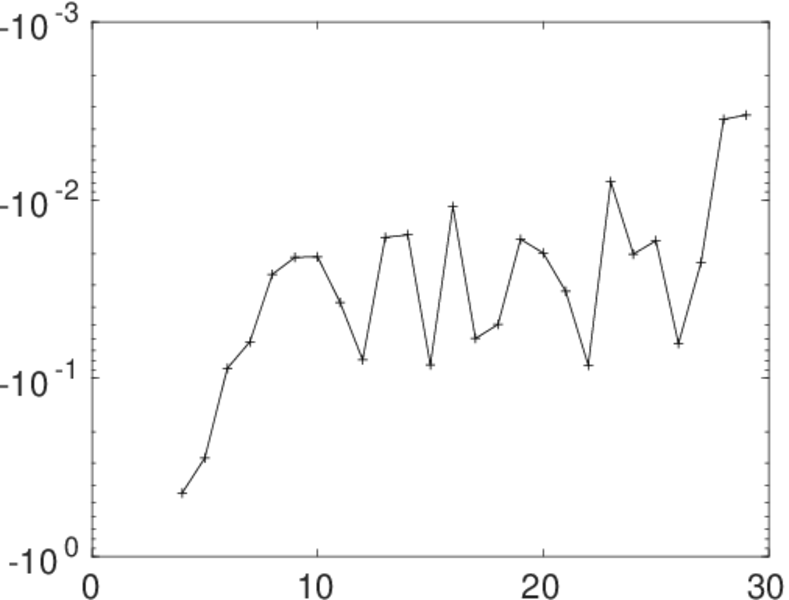
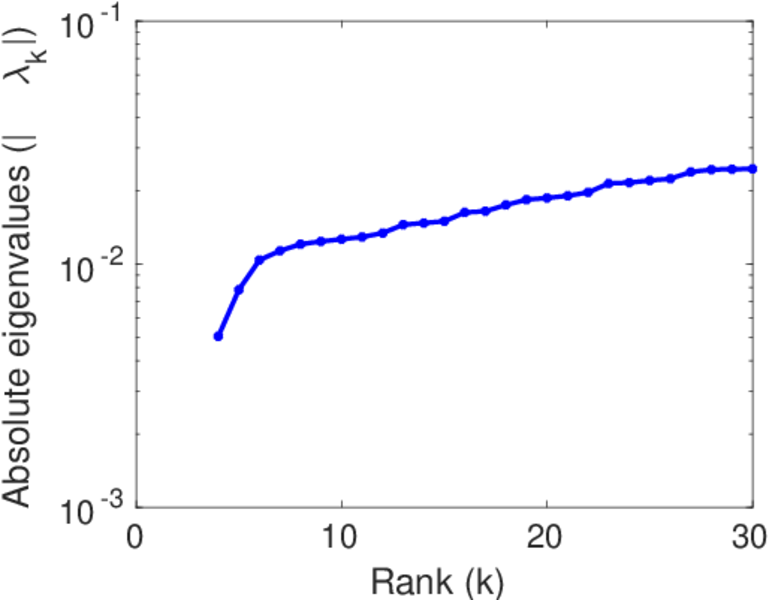
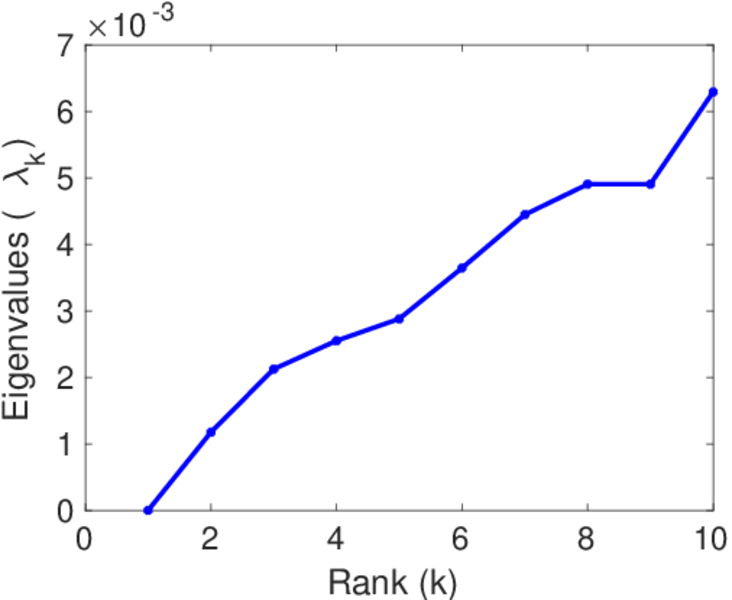
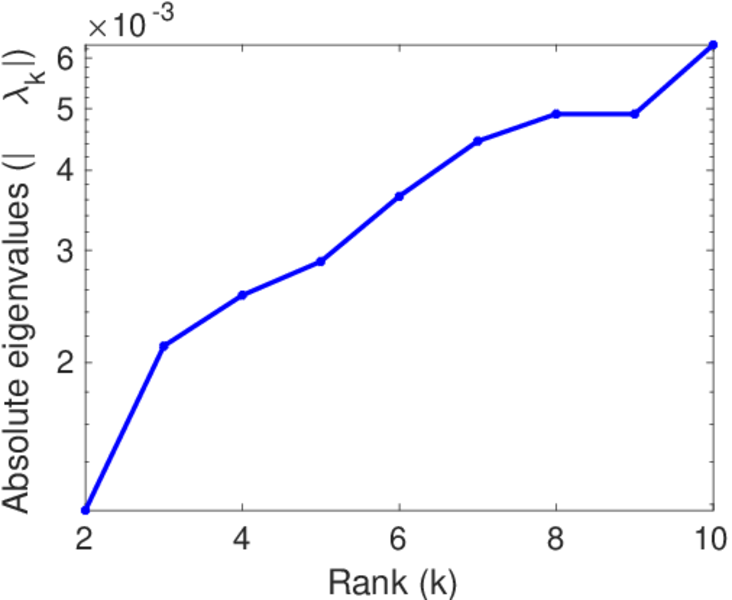
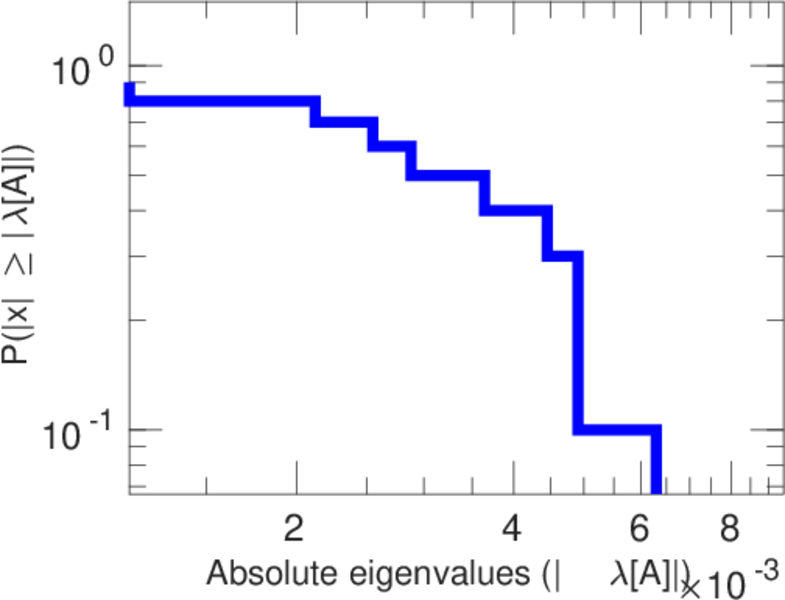
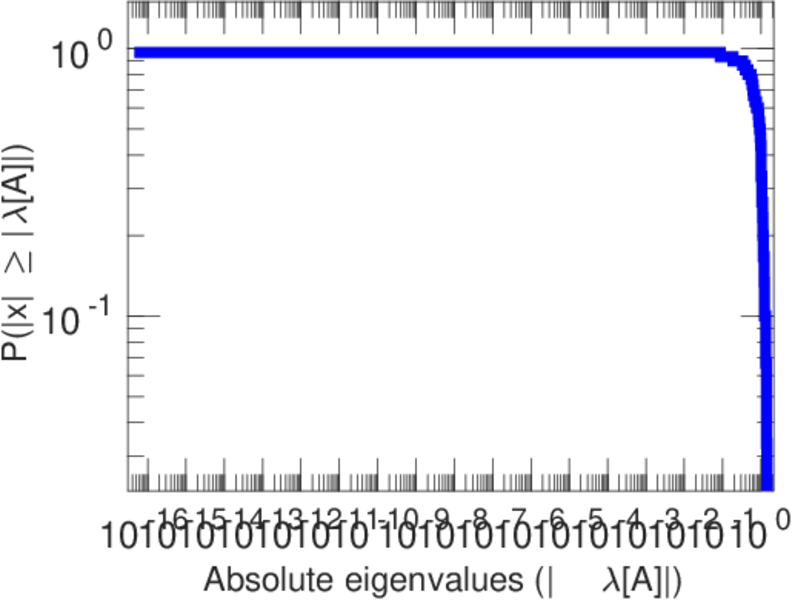
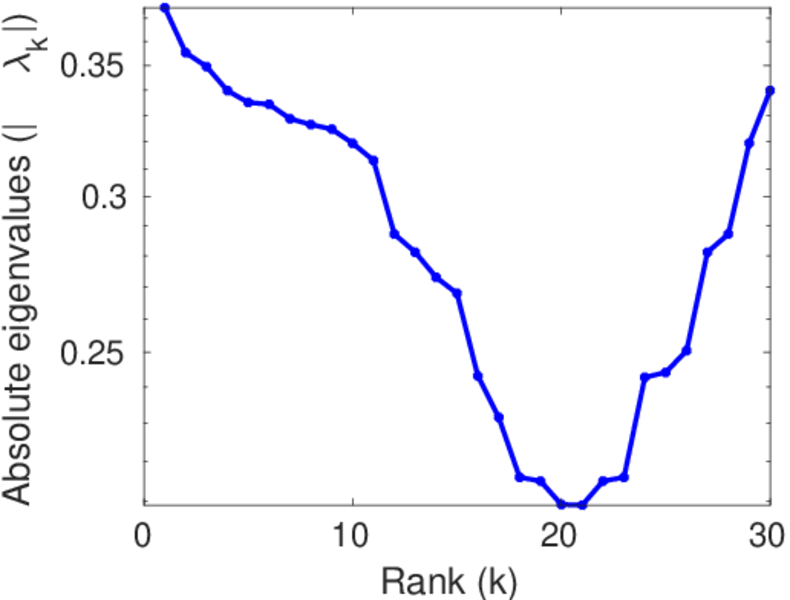
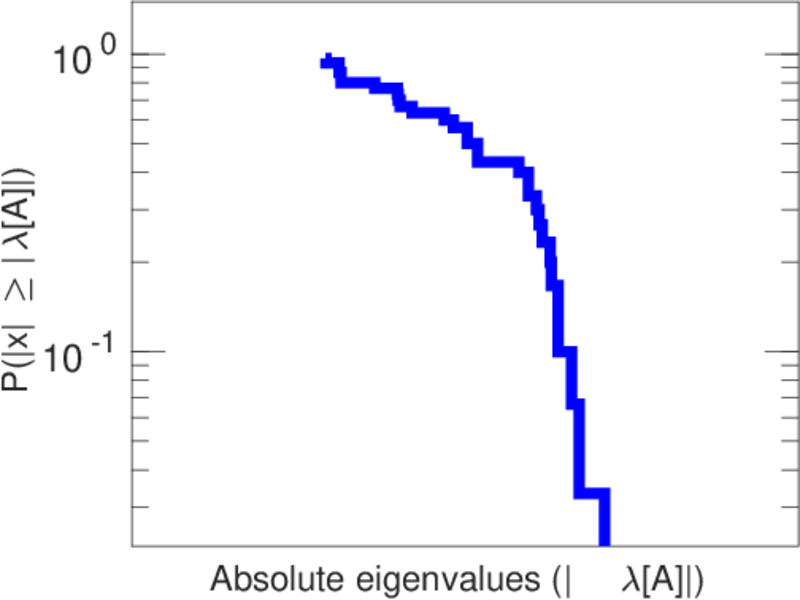
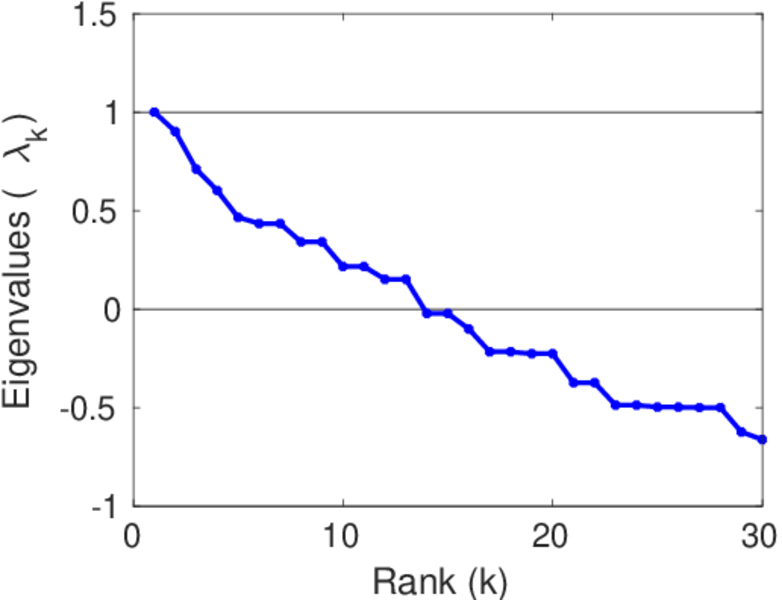
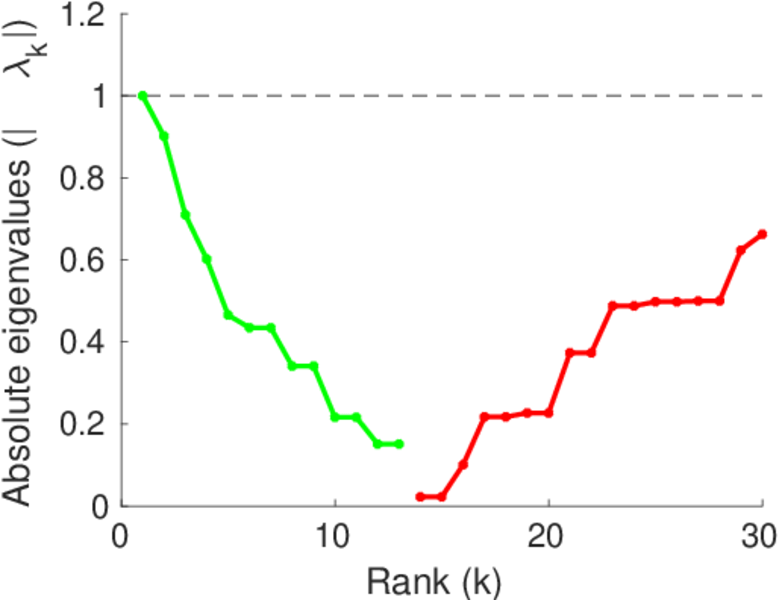
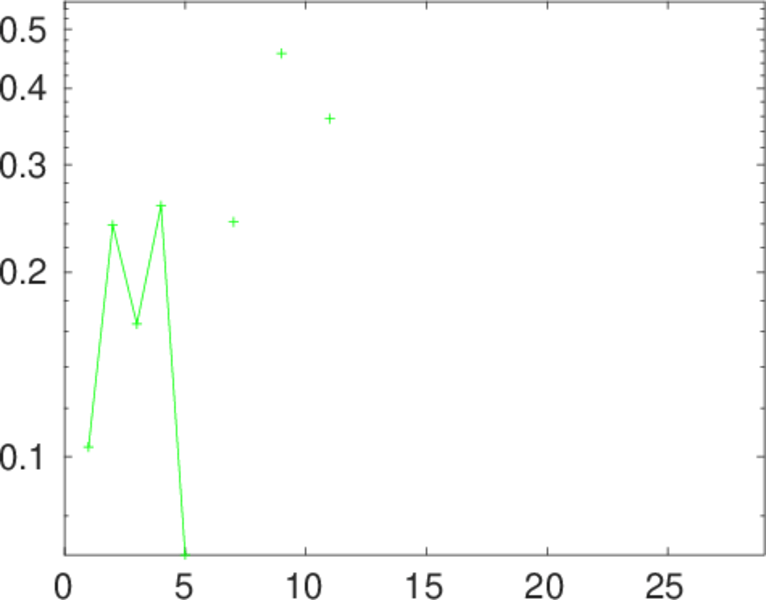
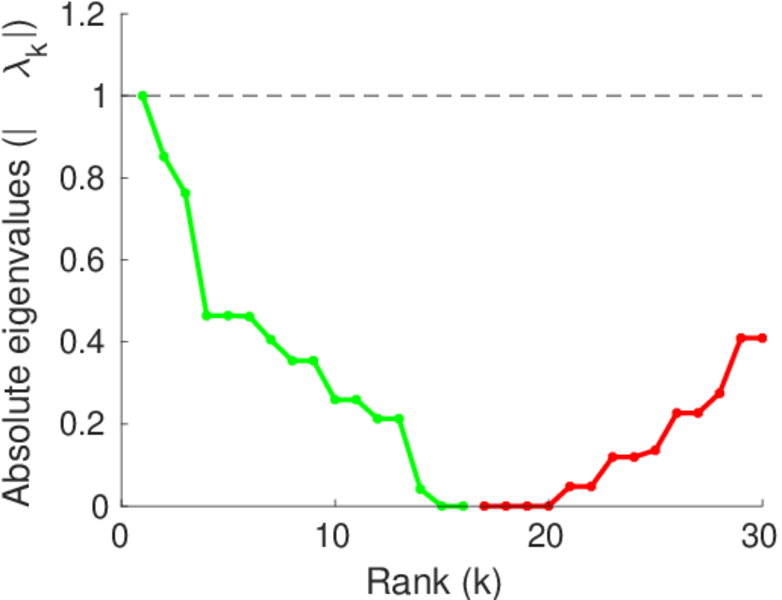
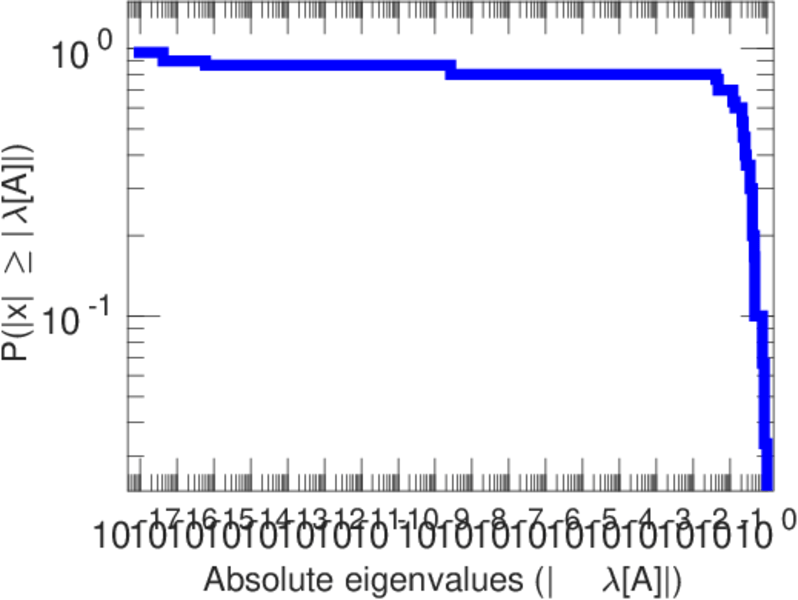
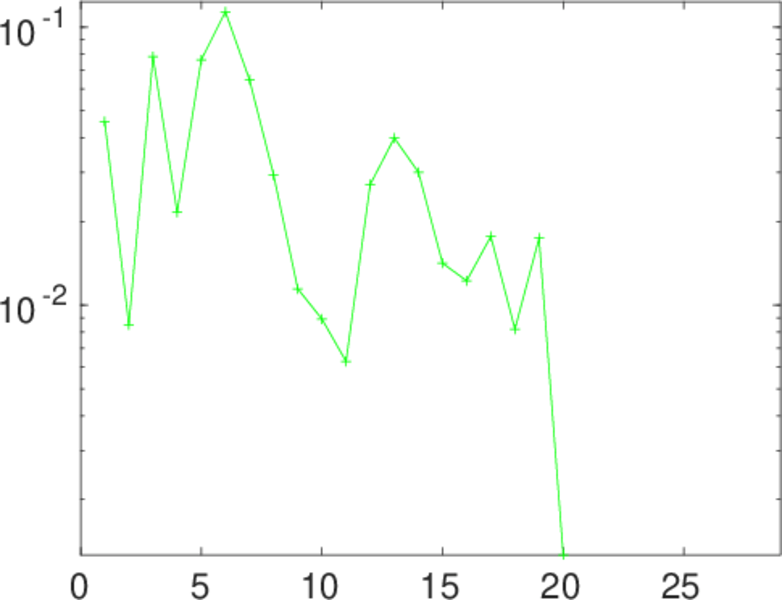
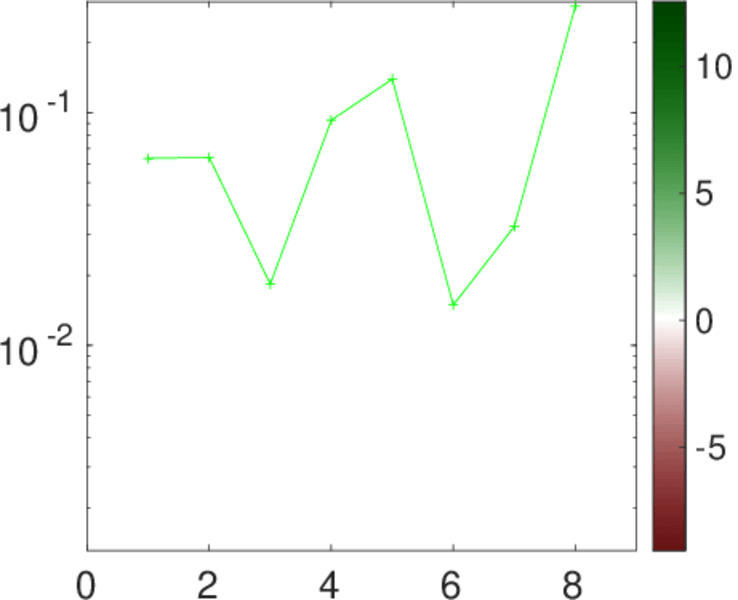
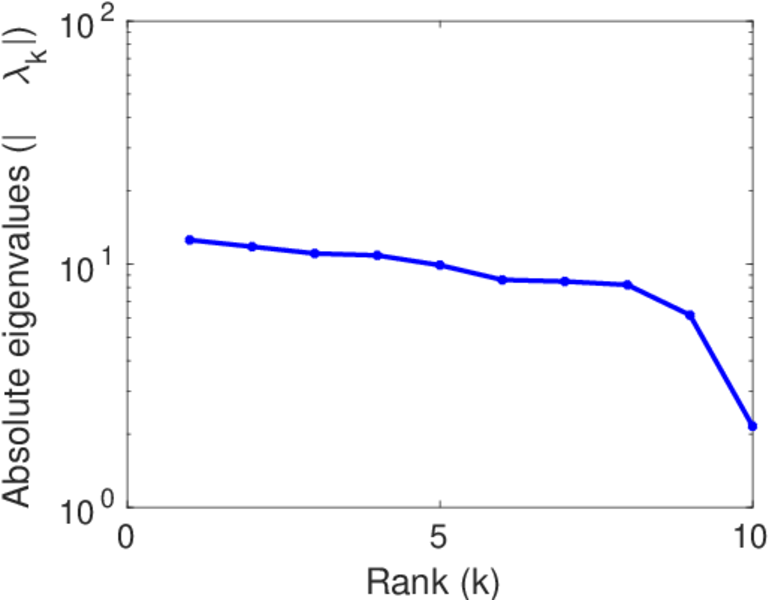
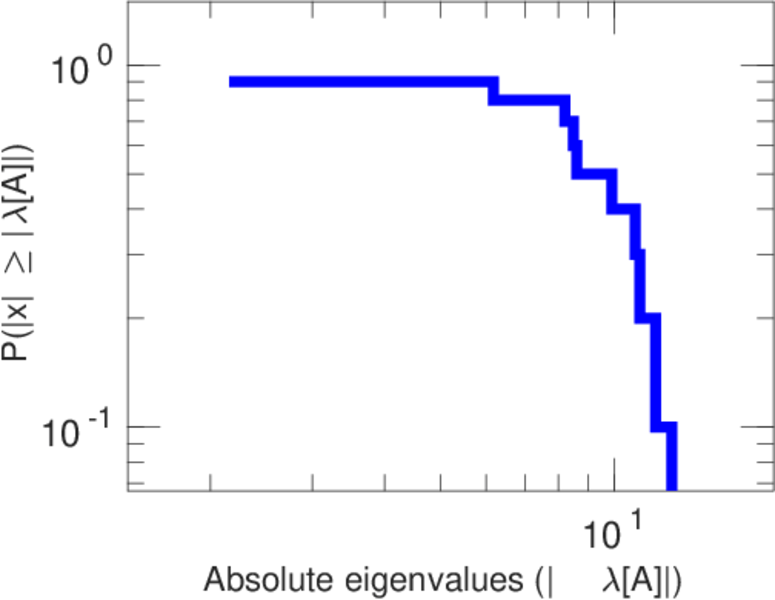
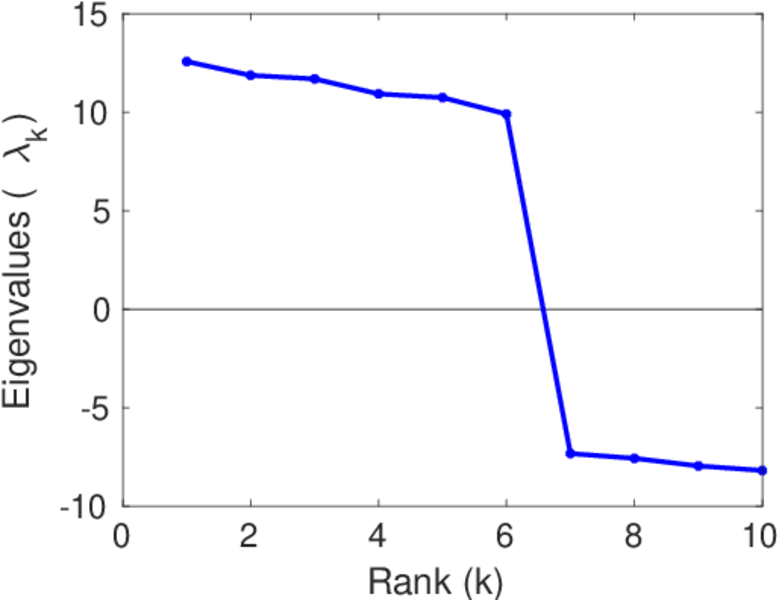
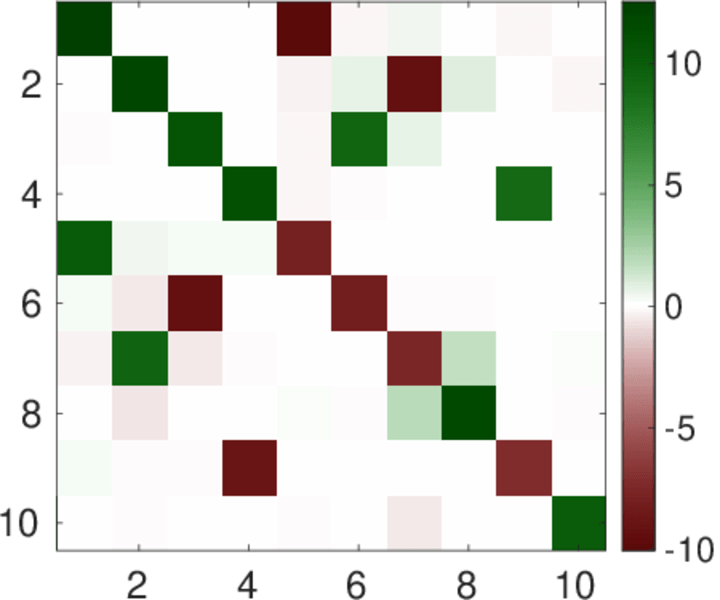
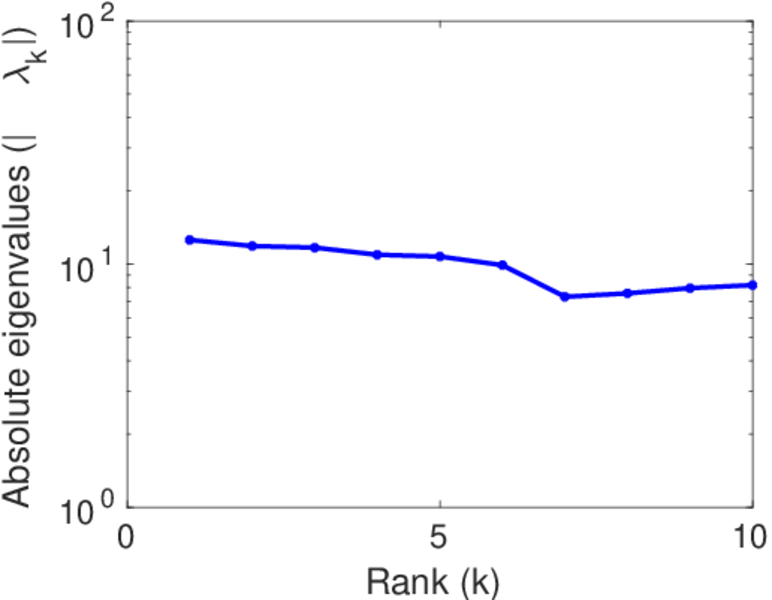
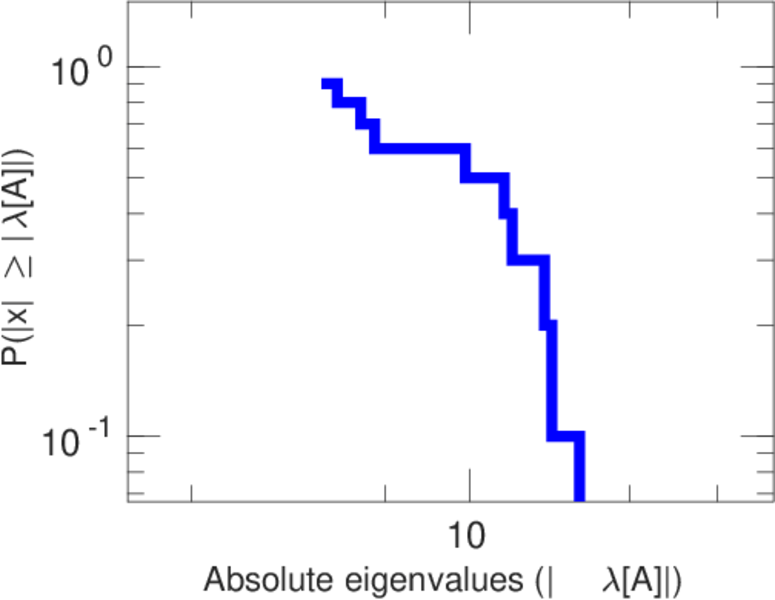
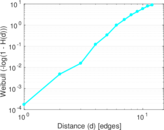
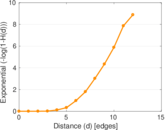
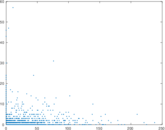
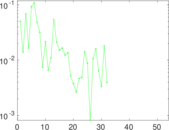
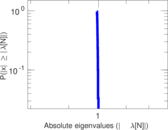
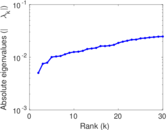
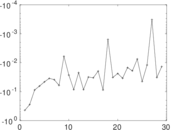
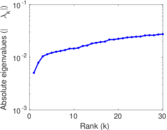
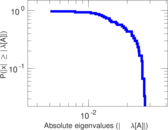
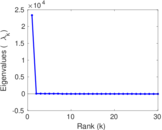
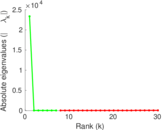
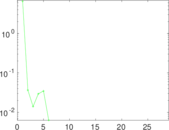
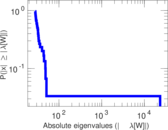
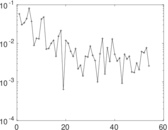
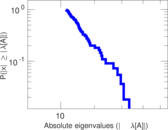
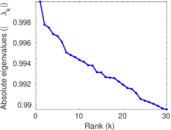
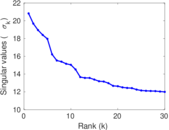
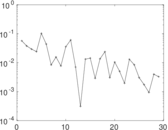
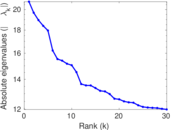
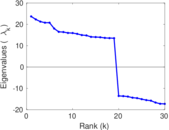
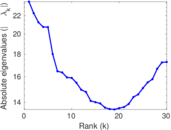
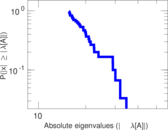
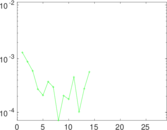
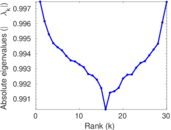
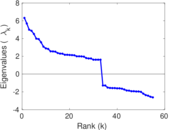
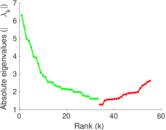
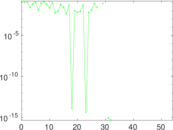
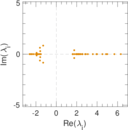
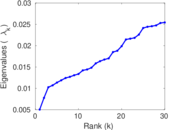
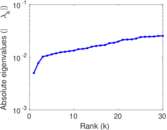
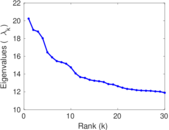
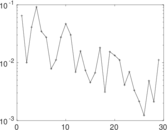
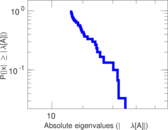
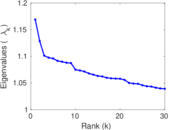
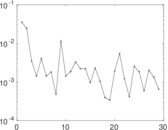
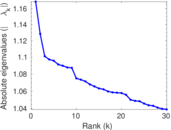
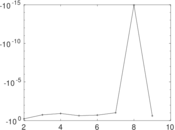
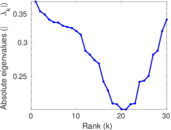
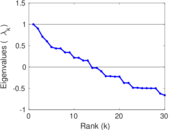
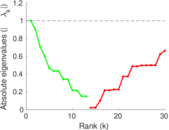
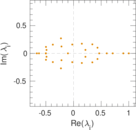
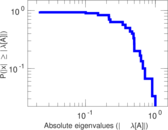
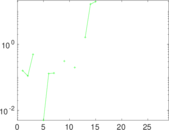
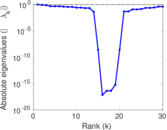
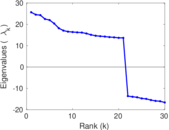
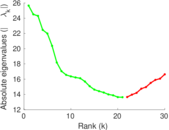
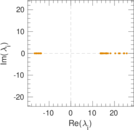
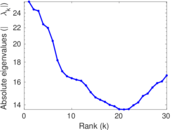
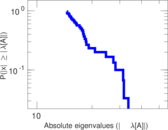
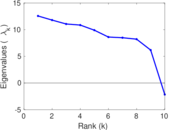
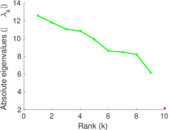
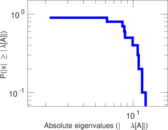
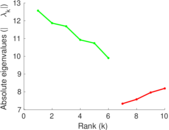
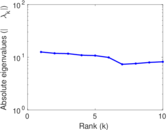
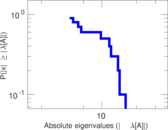
Plots


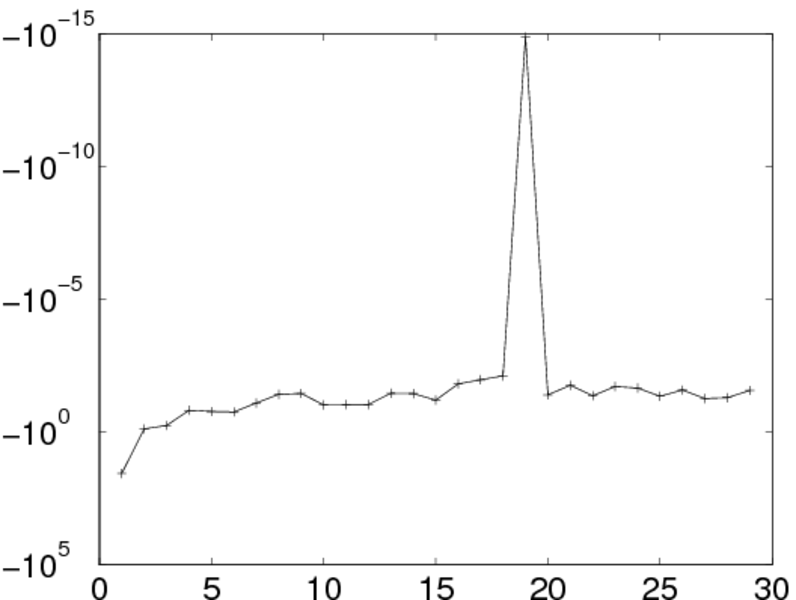
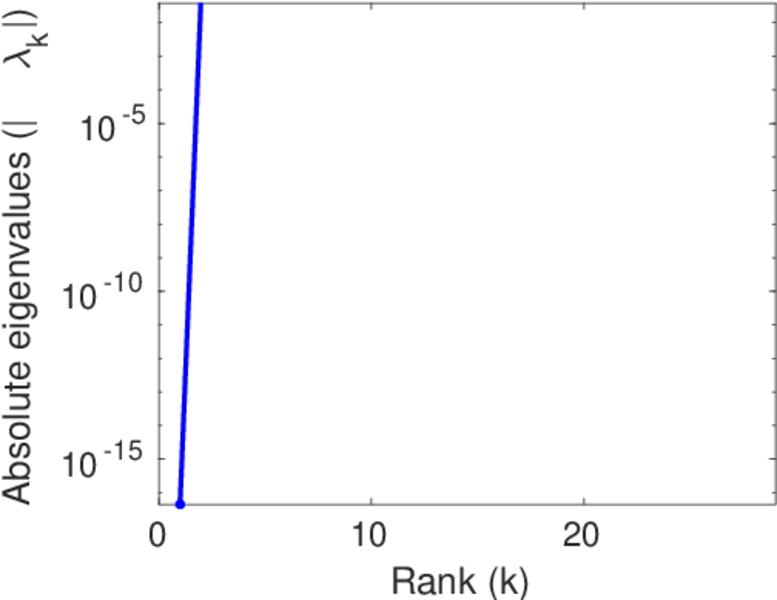
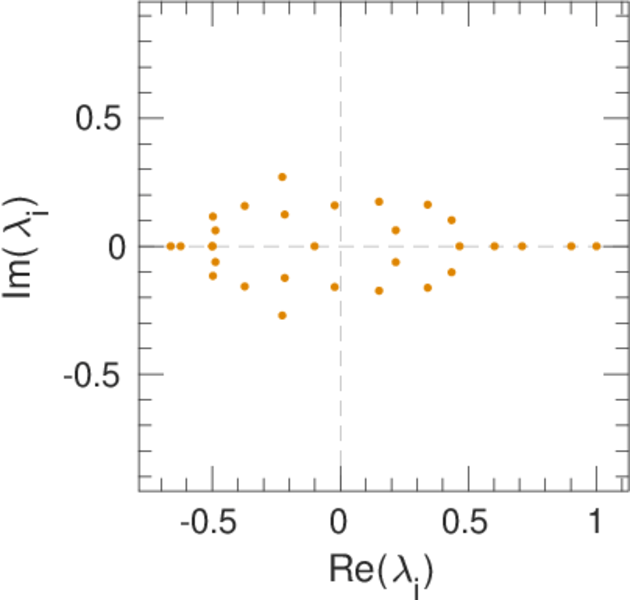
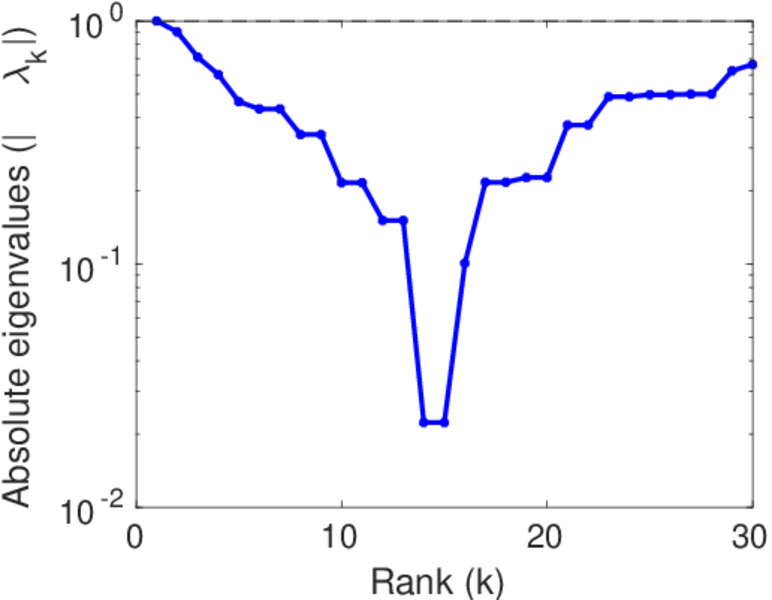
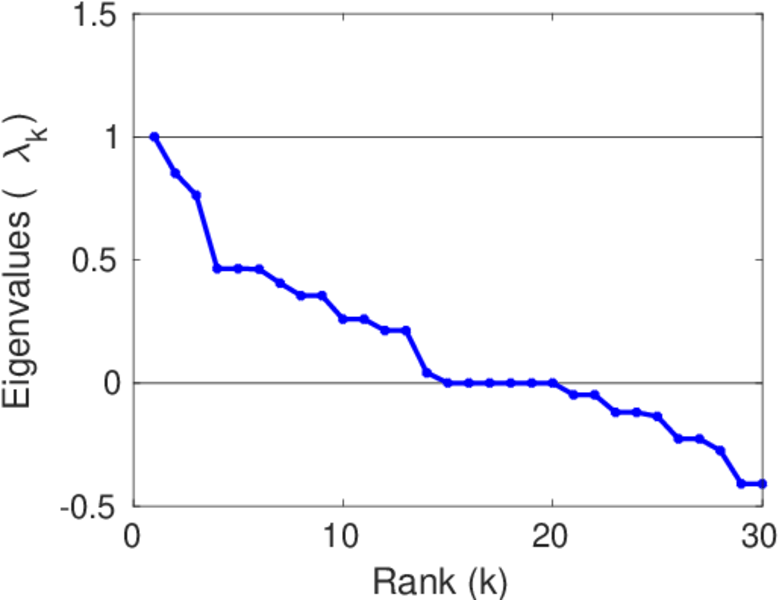
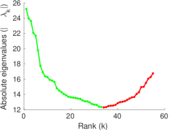
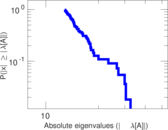
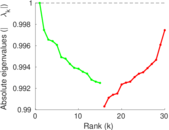
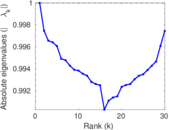
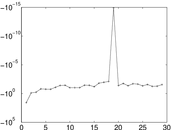
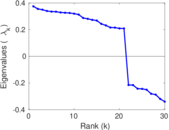
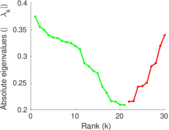
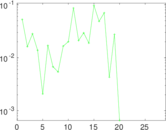
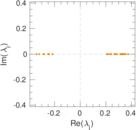
Matrix decompositions plots


Downloads
References
|
[1]
|
Jérôme Kunegis.
KONECT – The Koblenz Network Collection.
In Proc. Int. Conf. on World Wide Web Companion, pages
1343–1350, 2013.
[ http ]
|
|
[2]
|
Julian McAuley and Jure Leskovec.
Learning to discover social circles in ego networks.
In Adv. in Neural Inf. Process. Syst., pages 548–556. 2012.
|
 KONECT ‣ Networks ‣
Buy Me a Coffee
KONECT ‣ Networks ‣
Buy Me a Coffee