Flickr links
This is the social network of Flickr users and their connections. The network
is undirected. The dataset was crawled
Metadata
Statistics
| Size | n = | 1,715,255
|
| Volume | m = | 15,551,250
|
| Loop count | l = | 1
|
| Wedge count | s = | 14,660,775,057
|
| Claw count | z = | 21,493,389,022,491
|
| Cross count | x = | 61,068,223,891,975,320
|
| Triangle count | t = | 548,174,465
|
| Square count | q = | 428,125,008,285
|
| 4-Tour count | T4 = | 3,483,825,597,342
|
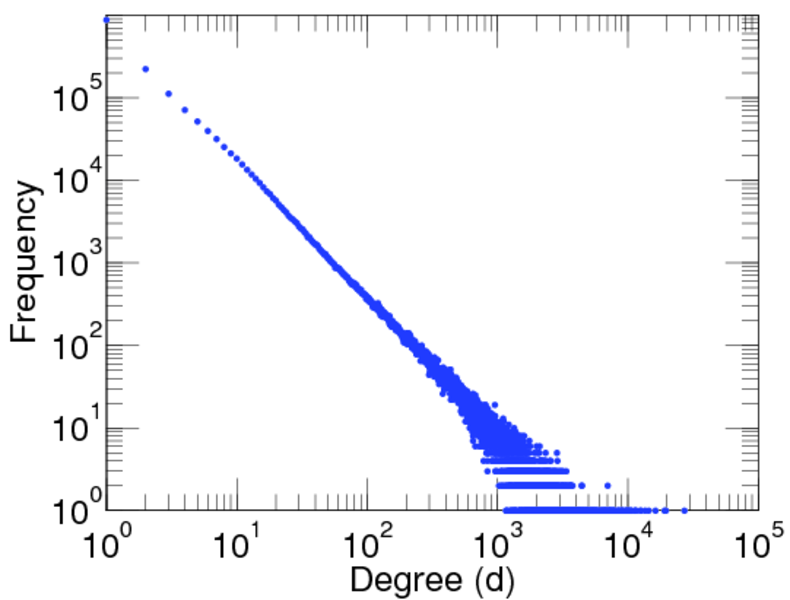
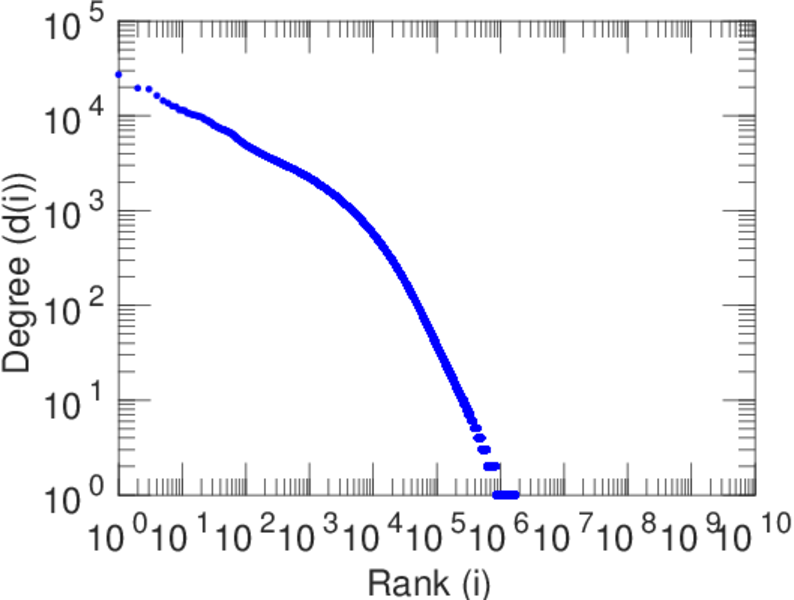
| Maximum degree | dmax = | 27,224
|
| Average degree | d = | 18.132 9
|
| Fill | p = | 1.057 15 × 10−5
|
| Size of LCC | N = | 1,624,991
|
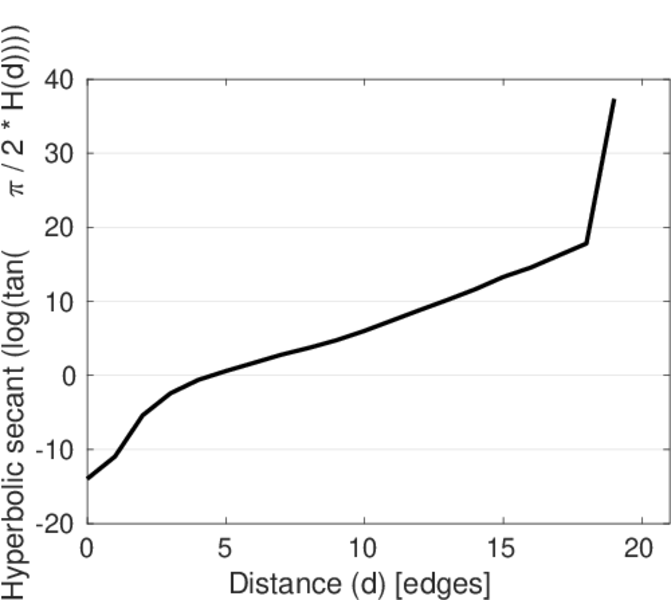
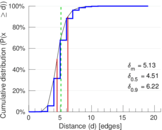
| Diameter | δ = | 24
|
| 50-Percentile effective diameter | δ0.5 = | 4.510 39
|
| 90-Percentile effective diameter | δ0.9 = | 6.218 59
|
| Median distance | δM = | 5
|
| Mean distance | δm = | 5.127 45
|
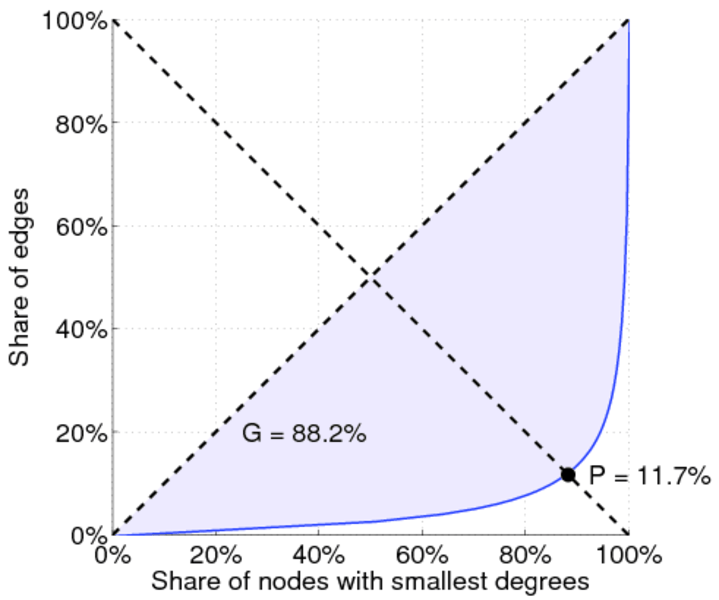
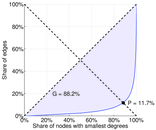
| Gini coefficient | G = | 0.882 436
|
| Balanced inequality ratio | P = | 0.116 856
|
| Relative edge distribution entropy | Her = | 0.822 037
|
| Power law exponent | γ = | 2.039 66
|
| Tail power law exponent | γt = | 1.731 00
|
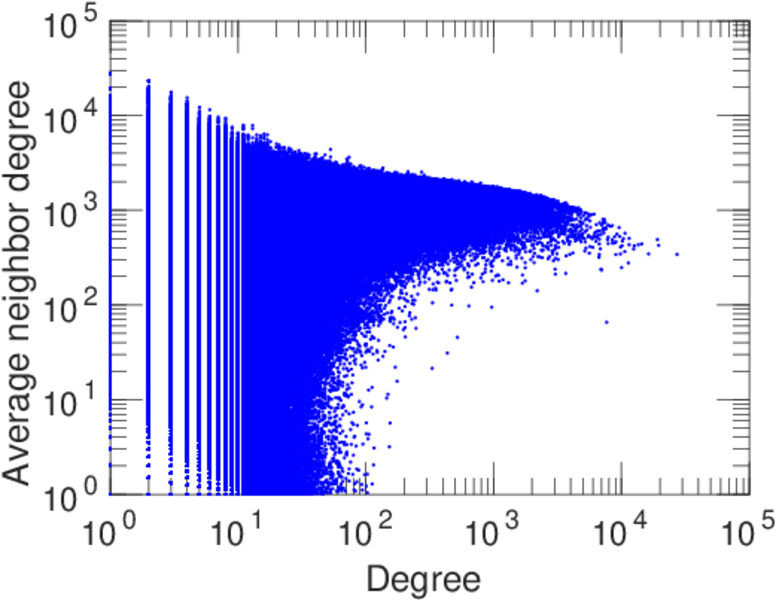
| Degree assortativity | ρ = | −0.015 278 6
|
| Degree assortativity p-value | pρ = | 0.000 00
|
| Clustering coefficient | c = | 0.112 172
|
| Spectral norm | α = | 1,240.26
|
| Spectral separation | |λ1[A] / λ2[A]| = | 1.355 68
|
| Non-bipartivity | bA = | 0.674 071
|
| Normalized non-bipartivity | bN = | 0.001 850 47
|
| Algebraic non-bipartivity | χ = | 0.003 650 23
|
| Spectral bipartite frustration | bK = | 4.791 87 × 10−5
|
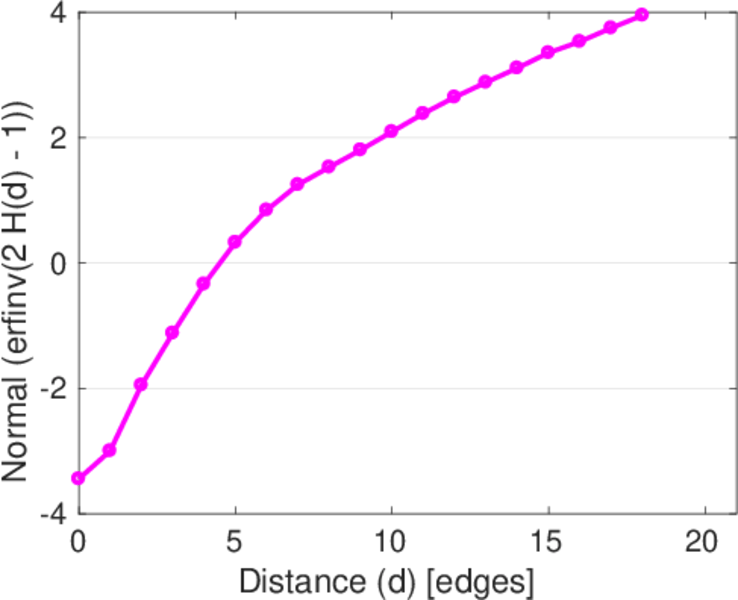
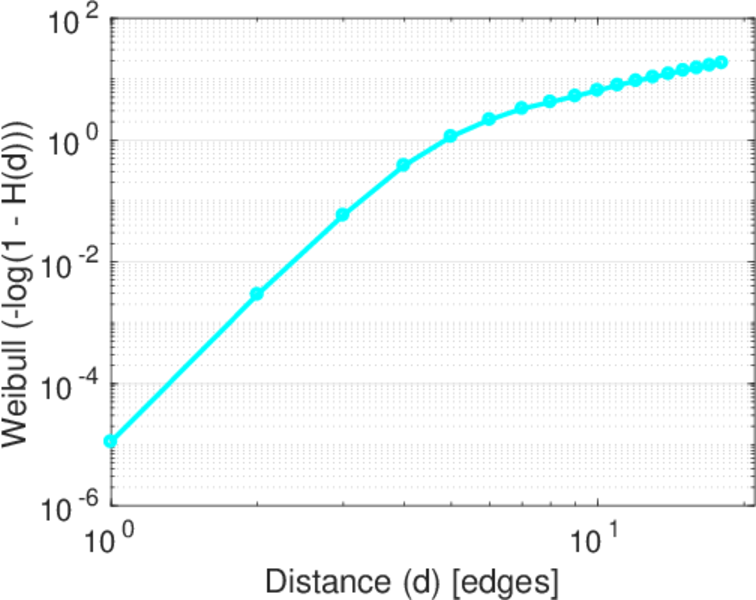
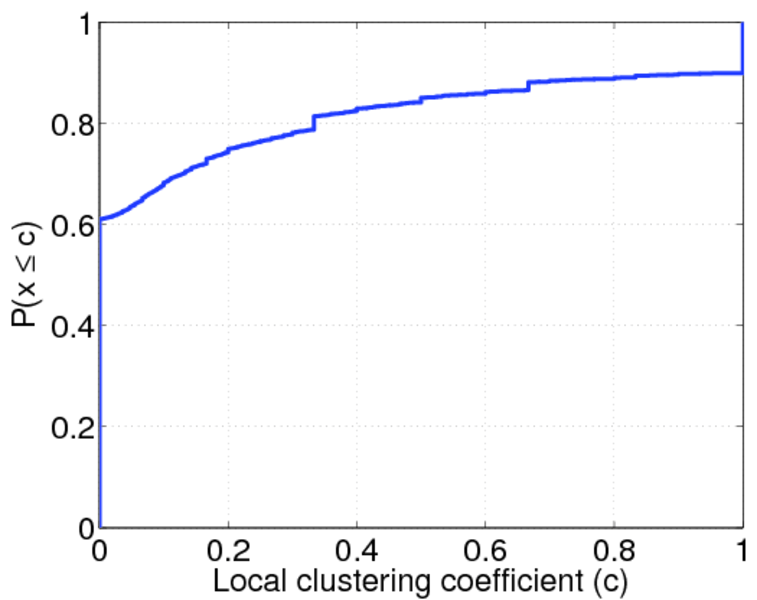
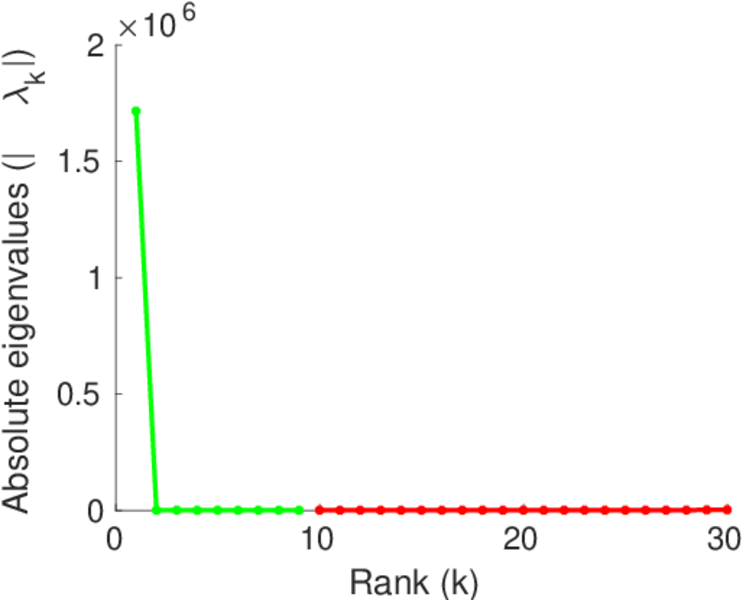
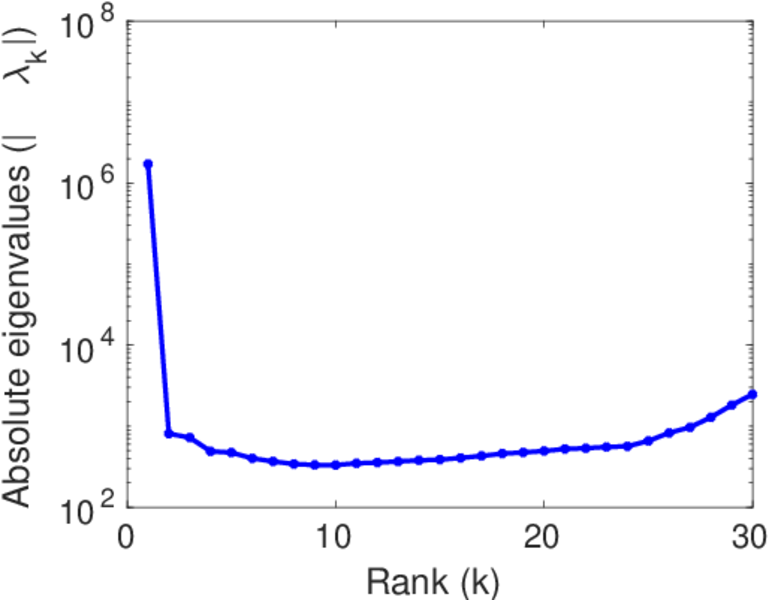
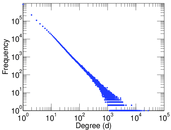
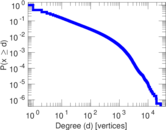
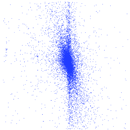
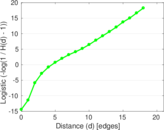
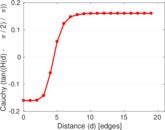
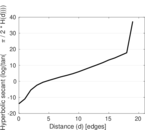
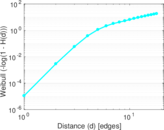
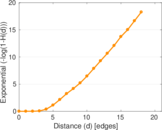
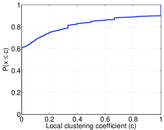
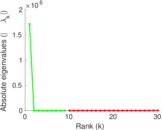
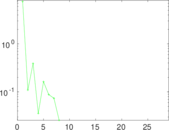
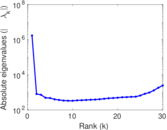
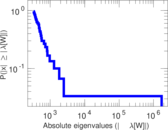
Plots


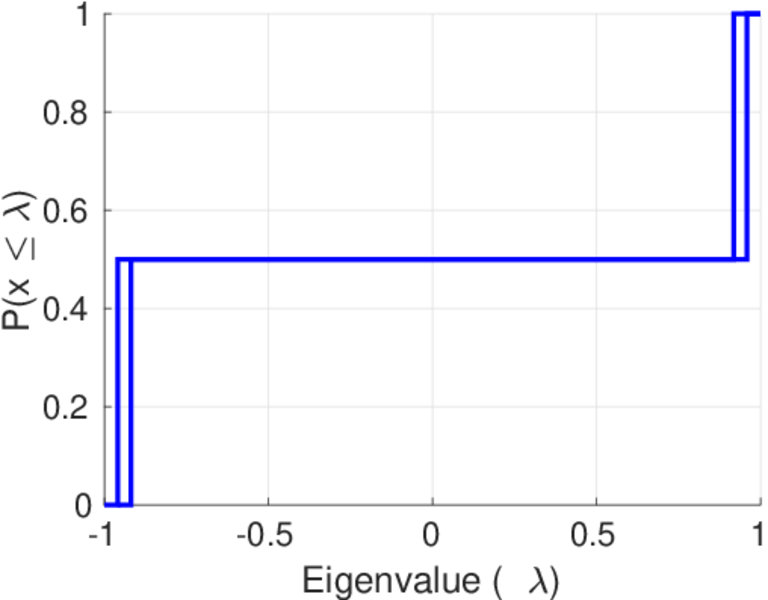
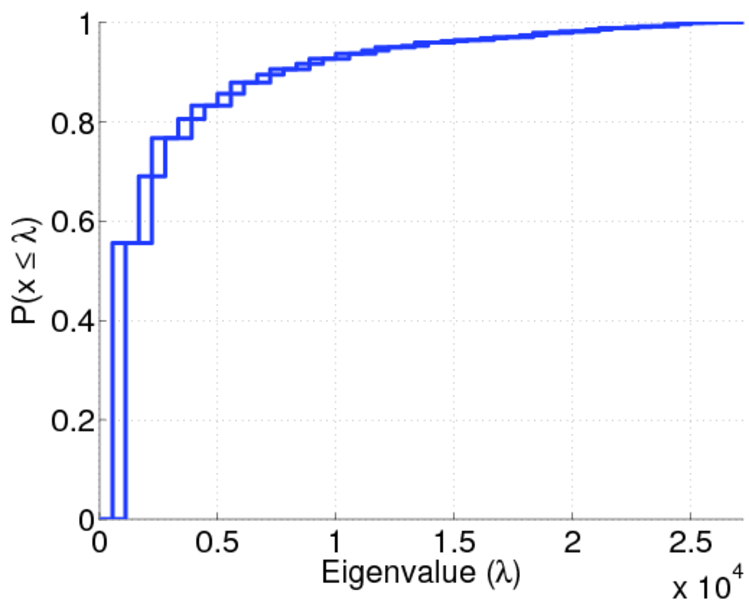
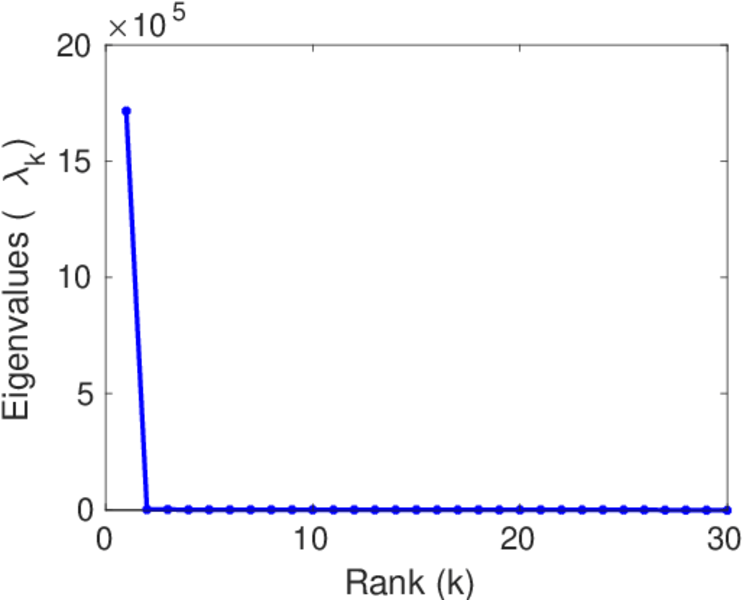
Matrix decompositions plots

Downloads
References
|
[1]
|
Jérôme Kunegis.
KONECT – The Koblenz Network Collection.
In Proc. Int. Conf. on World Wide Web Companion, pages
1343–1350, 2013.
[ http ]
|
|
[2]
|
Alan Mislove, Massimiliano Marcon, Krishna P. Gummadi, Peter Druschel, and
Bobby Bhattacharjee.
Measurement and analysis of online social networks.
In Proc. Internet Measurement Conf., 2007.
|
 KONECT ‣ Networks ‣
Buy Me a Coffee
KONECT ‣ Networks ‣
Buy Me a Coffee