Flickr
This is the undirected network of Flickr images sharing common metadata such as
tags, groups, locations etc. A node represents an image, and an edge indicates
that two images share the same metadata.
Metadata
Statistics
| Size | n = | 105,938
|
| Volume | m = | 2,316,948
|
| Loop count | l = | 0
|
| Wedge count | s = | 806,678,787
|
| Claw count | z = | 181,947,878,743
|
| Cross count | x = | 65,490,641,956,676
|
| Triangle count | t = | 107,987,357
|
| Square count | q = | 34,729,244,373
|
| 4-Tour count | T4 = | 281,065,304,028
|
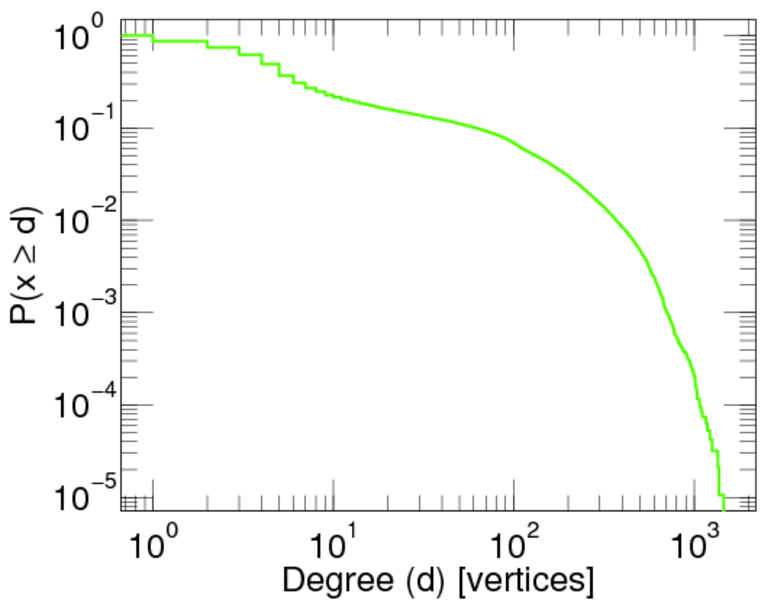
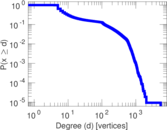
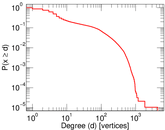
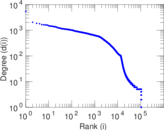
| Maximum degree | dmax = | 5,425
|
| Average degree | d = | 43.741 6
|
| Fill | p = | 0.000 412 902
|
| Size of LCC | N = | 105,722
|
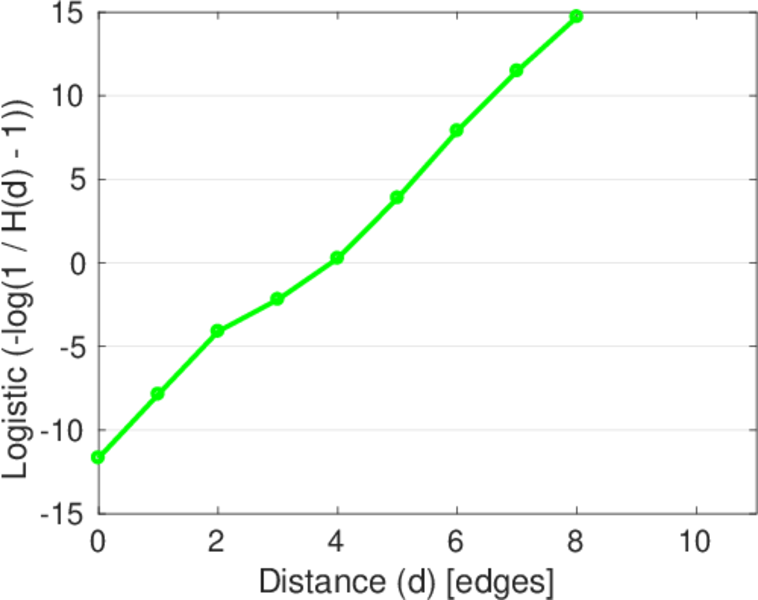
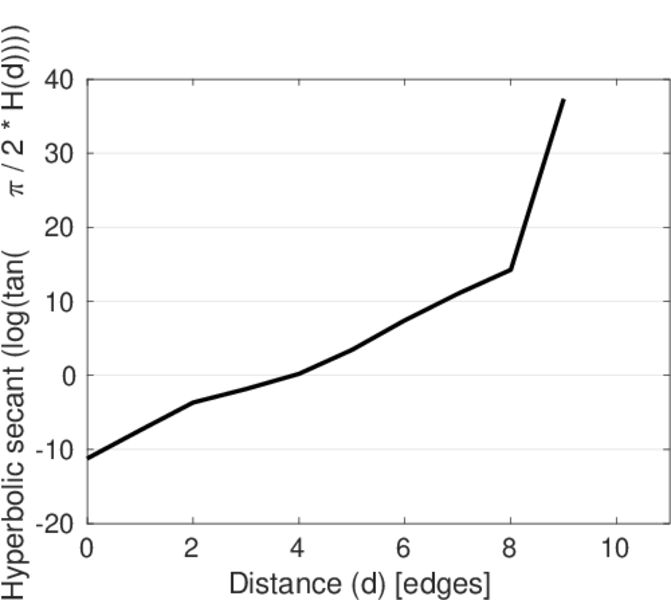
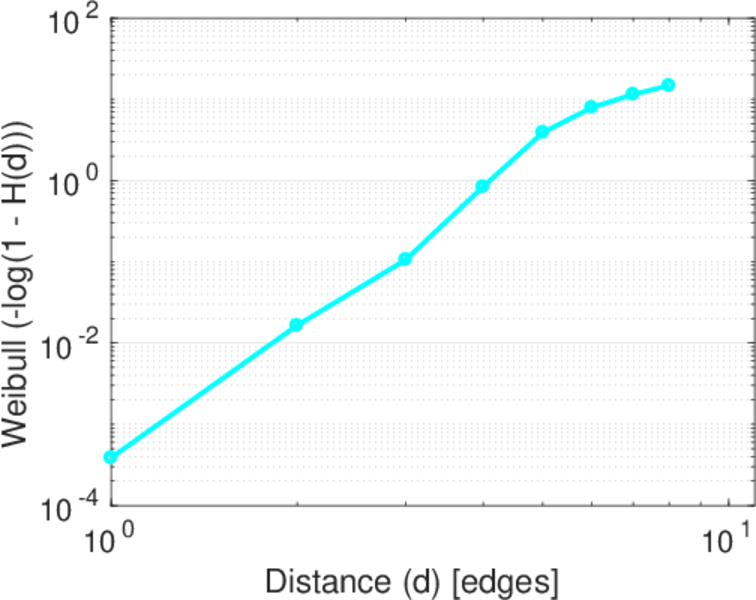
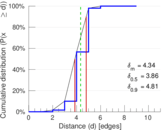
| Diameter | δ = | 9
|
| 50-Percentile effective diameter | δ0.5 = | 3.858 26
|
| 90-Percentile effective diameter | δ0.9 = | 4.807 41
|
| Median distance | δM = | 4
|
| Mean distance | δm = | 4.337 71
|
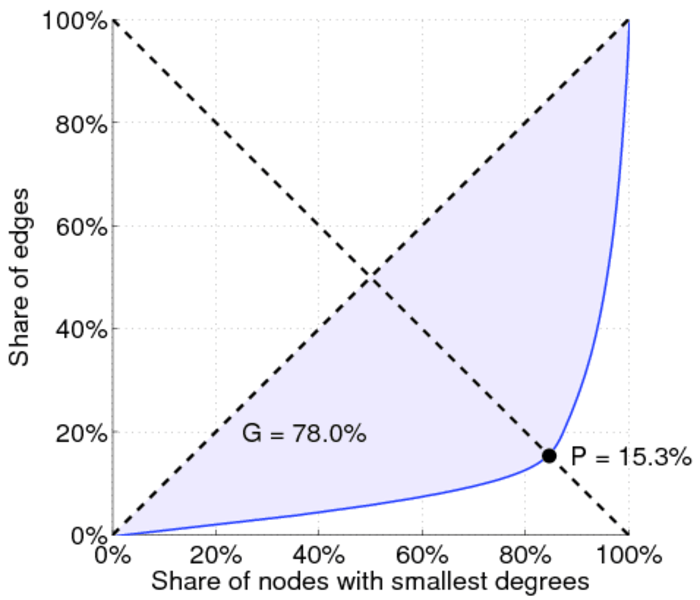
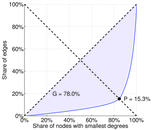
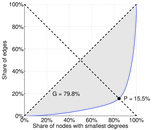
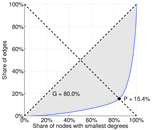
| Gini coefficient | G = | 0.780 096
|
| Balanced inequality ratio | P = | 0.153 442
|
| Relative edge distribution entropy | Her = | 0.876 354
|
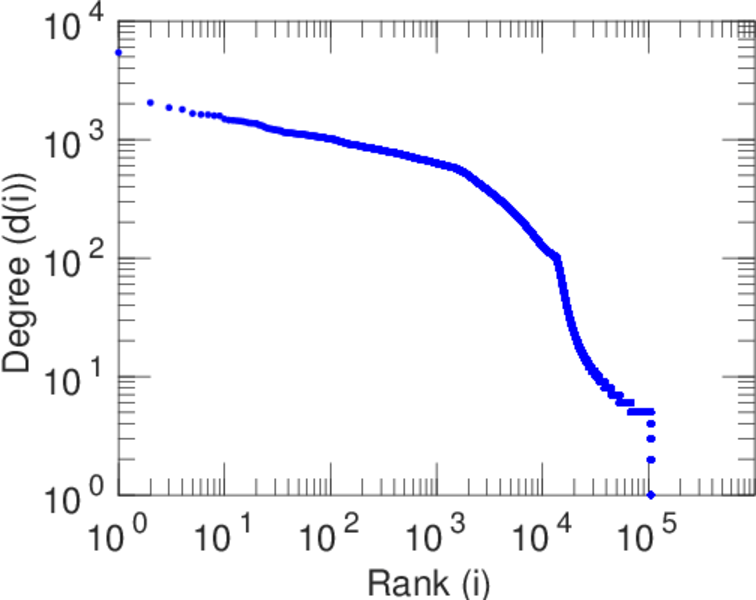
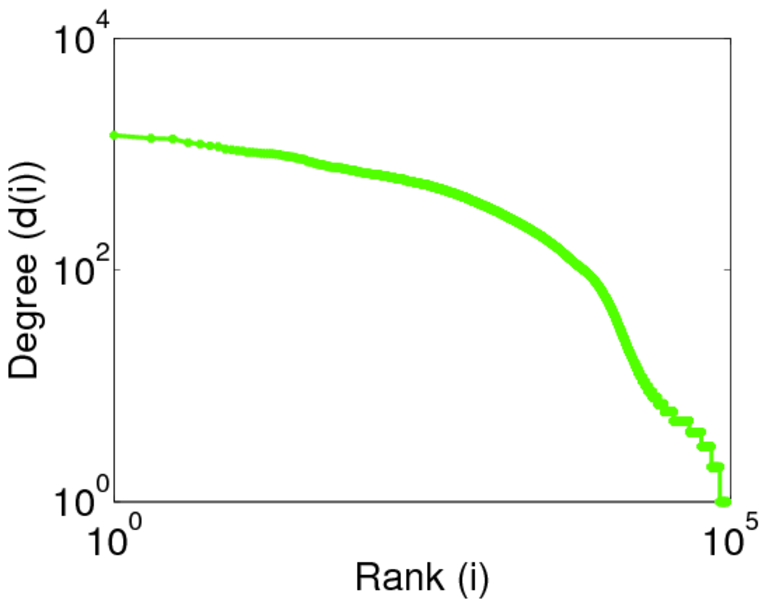
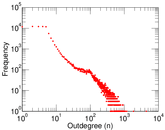
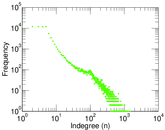
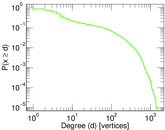
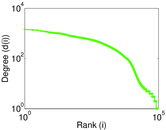
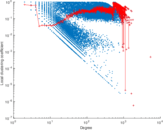
| Power law exponent | γ = | 1.407 23
|
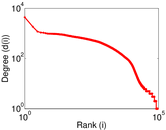
| Tail power law exponent | γt = | 1.731 00
|
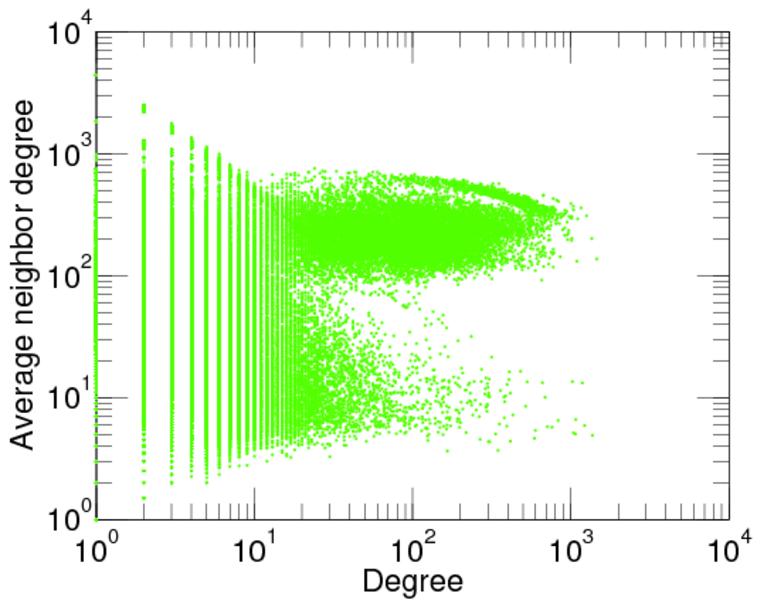
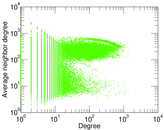
| Degree assortativity | ρ = | +0.246 851
|
| Degree assortativity p-value | pρ = | 0.000 00
|
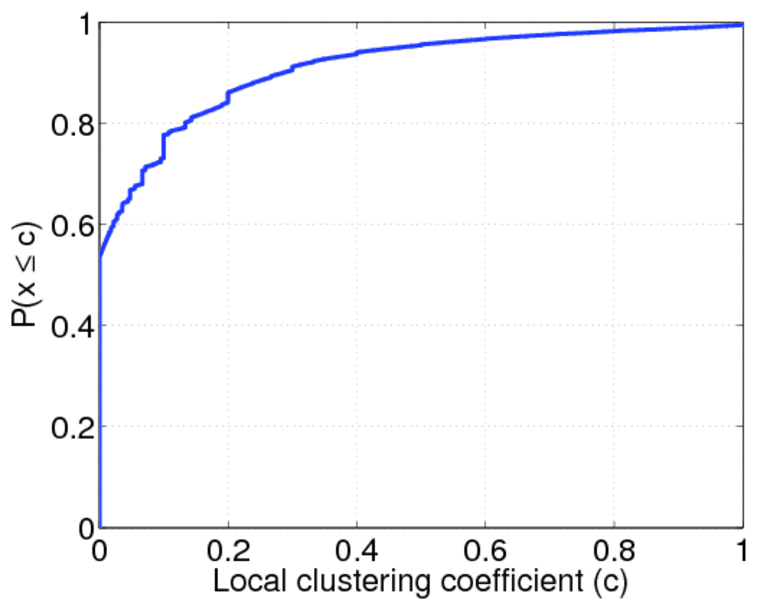
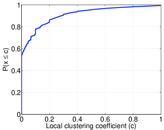
| Clustering coefficient | c = | 0.401 600
|
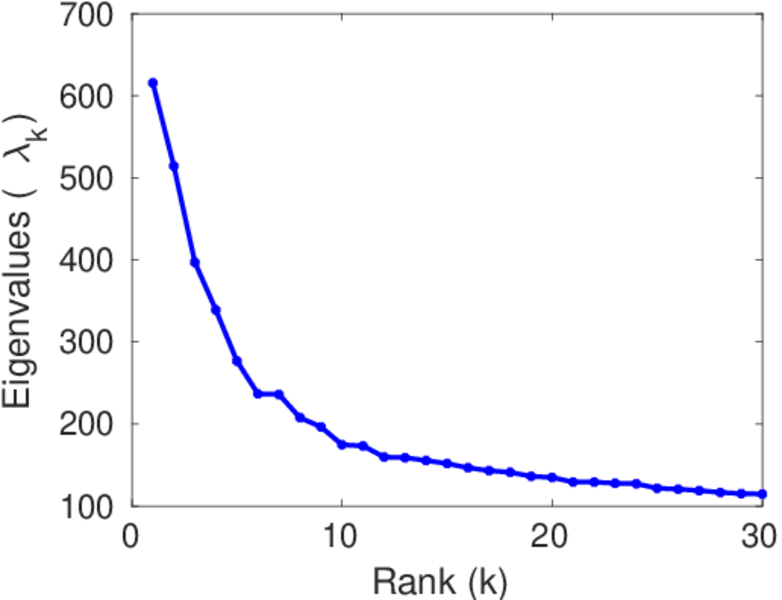
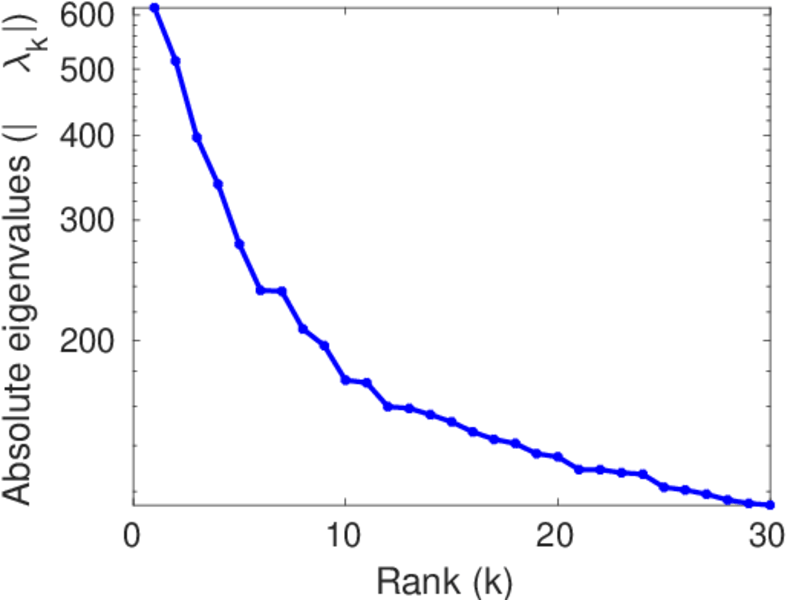
| Spectral norm | α = | 615.564
|
| Algebraic connectivity | a = | 0.032 533 4
|
| Spectral separation | |λ1[A] / λ2[A]| = | 1.197 14
|
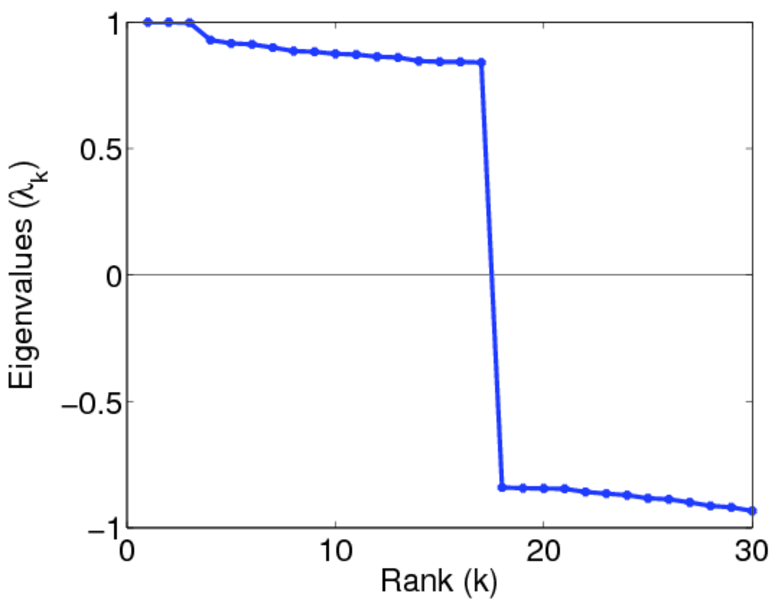
| Non-bipartivity | bA = | 0.829 008
|
| Normalized non-bipartivity | bN = | 0.066 857 3
|
| Algebraic non-bipartivity | χ = | 0.265 997
|
| Spectral bipartite frustration | bK = | 0.001 517 36
|
| Controllability | C = | 15,442
|
| Relative controllability | Cr = | 0.145 765
|
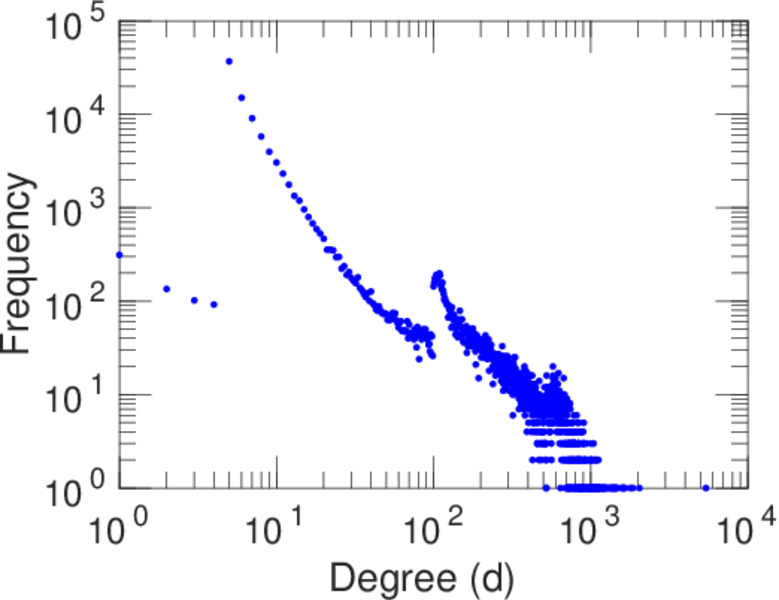
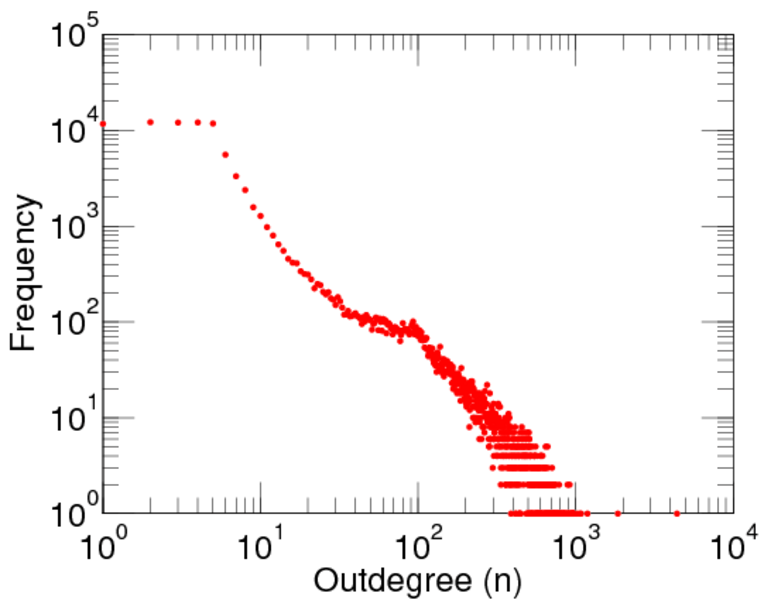
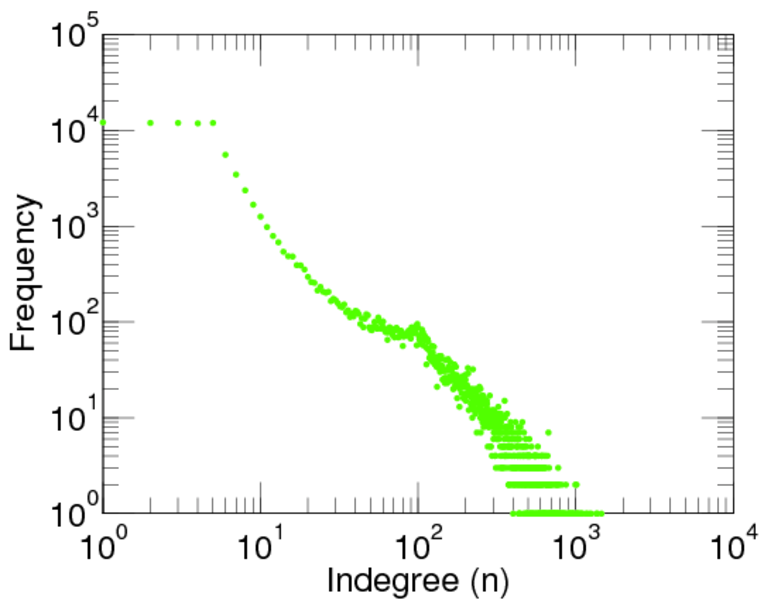
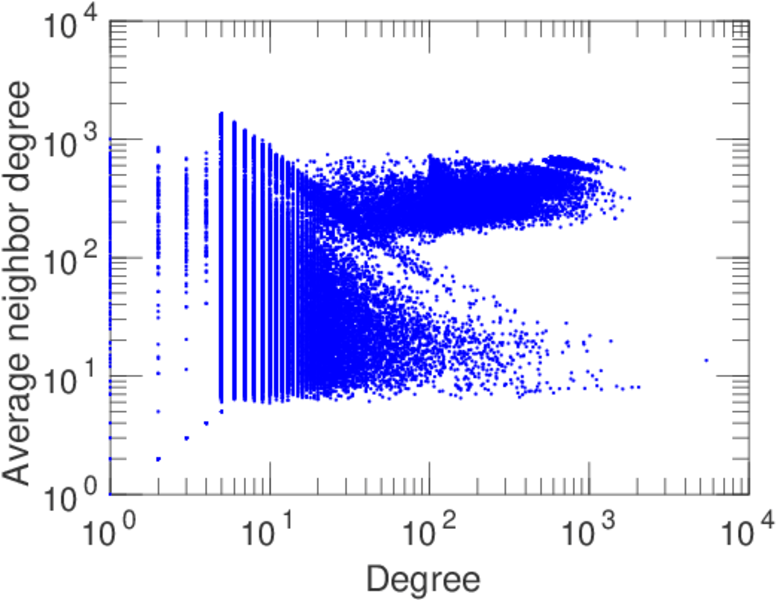
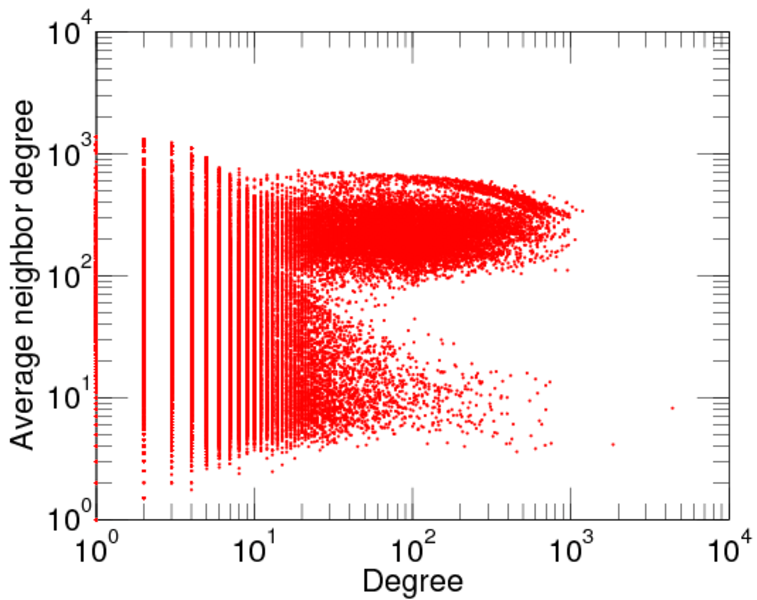
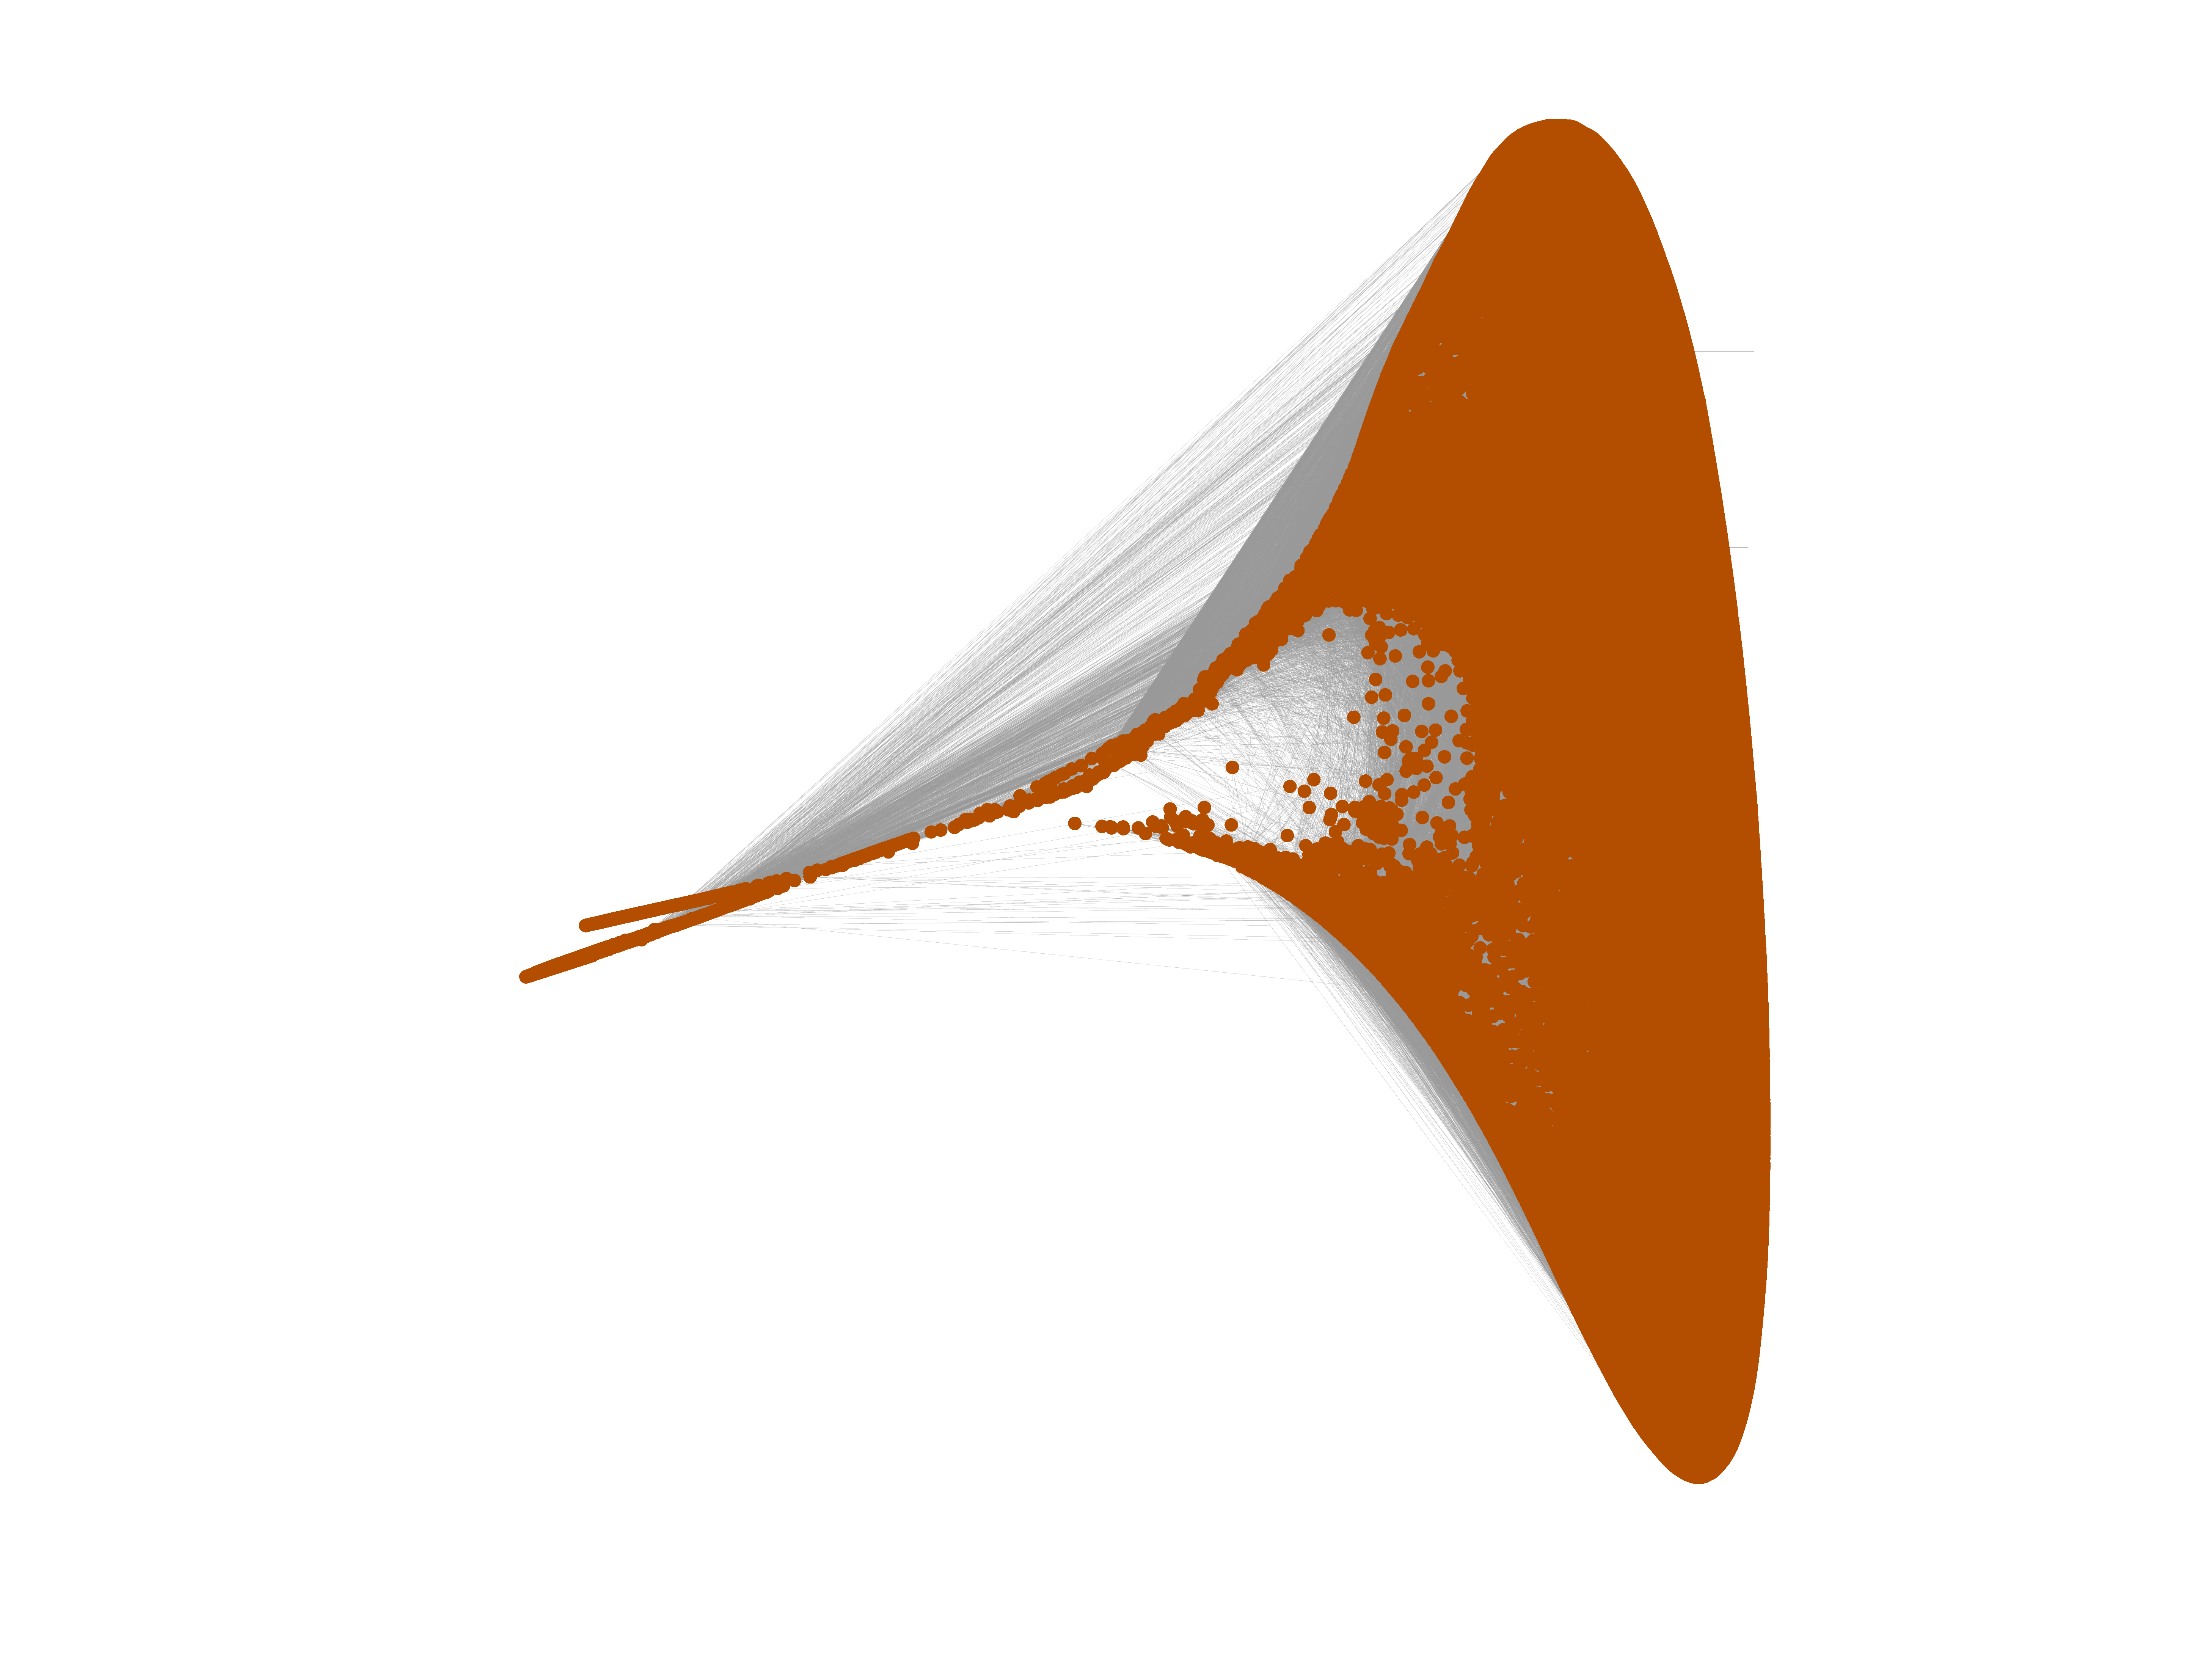
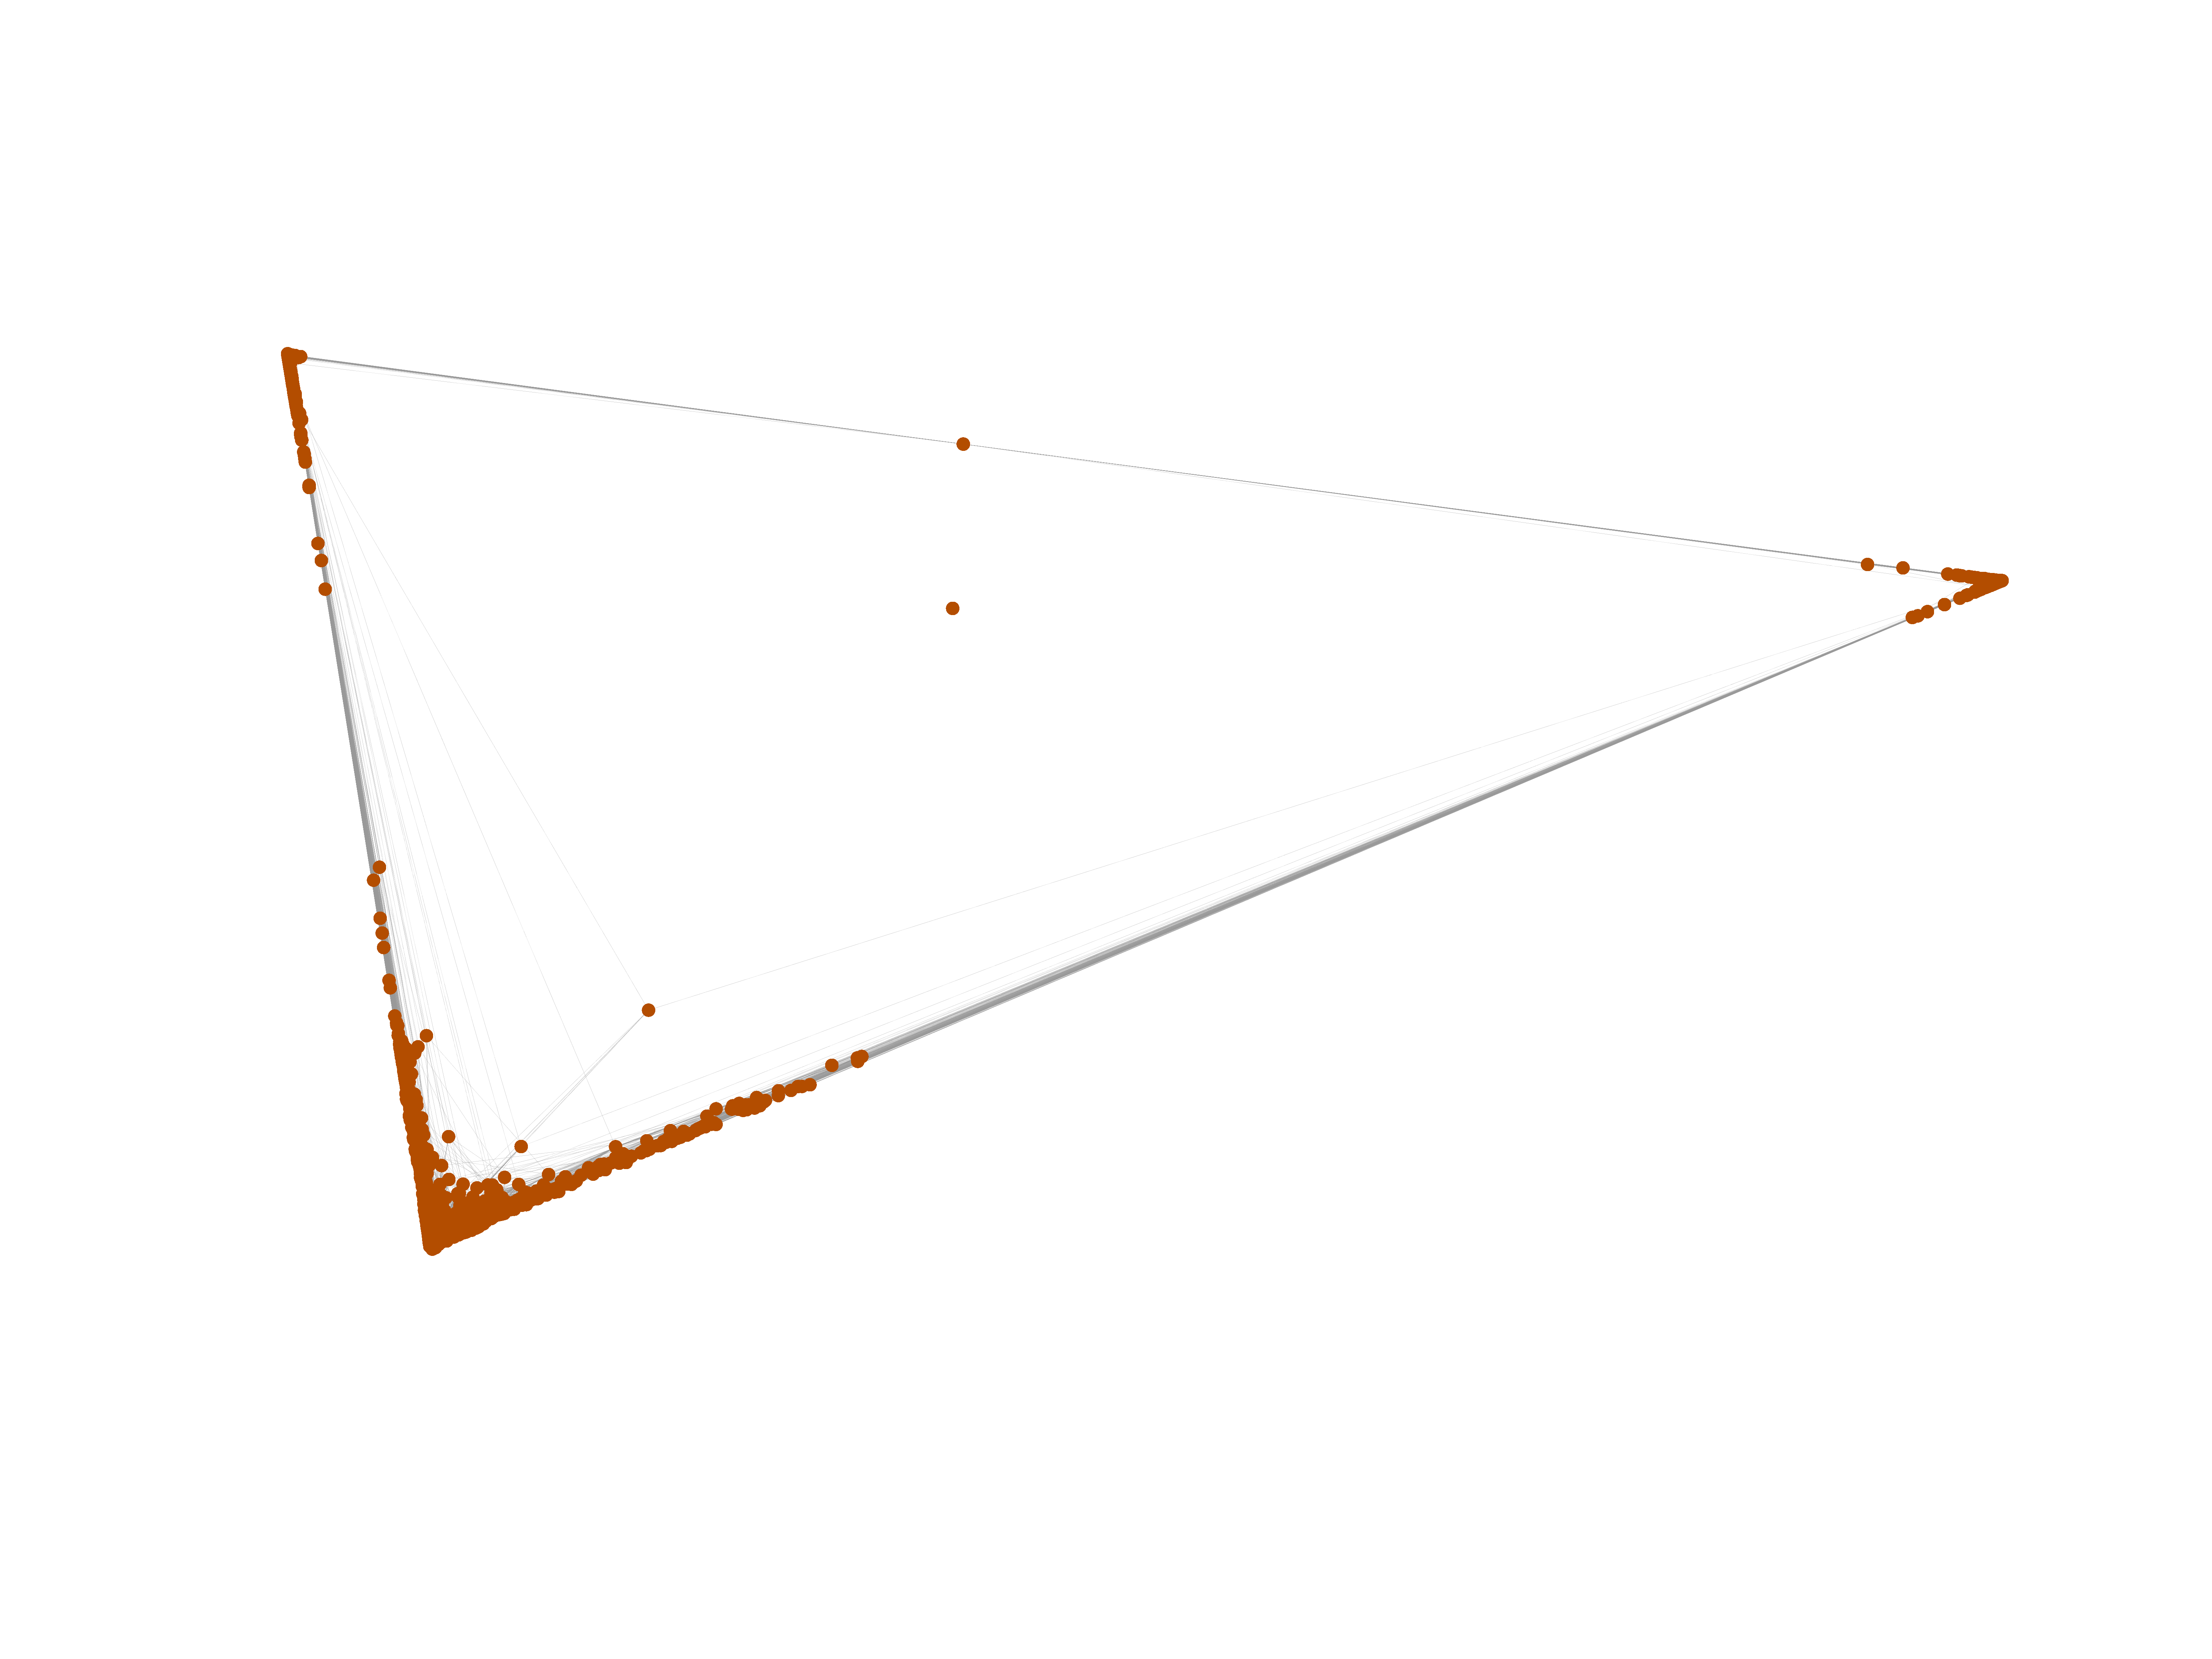
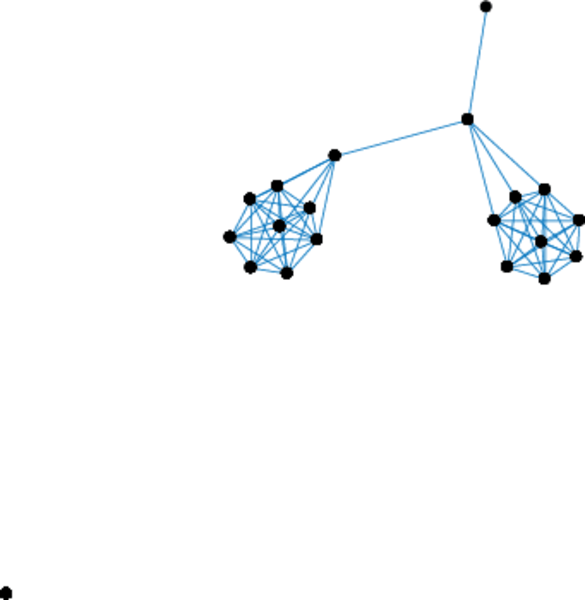
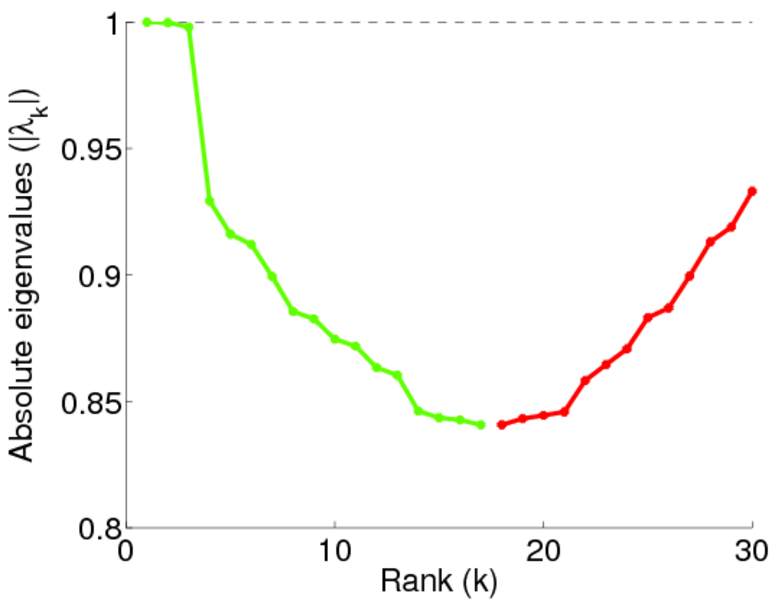
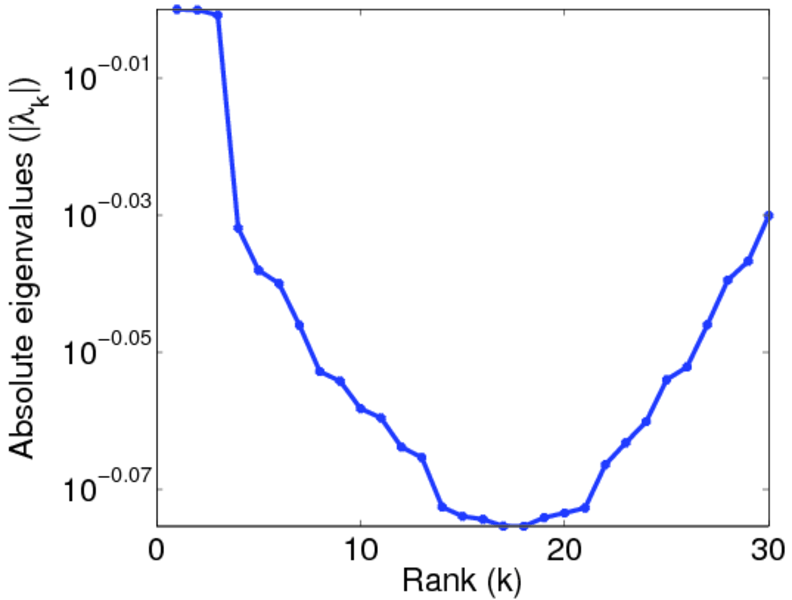
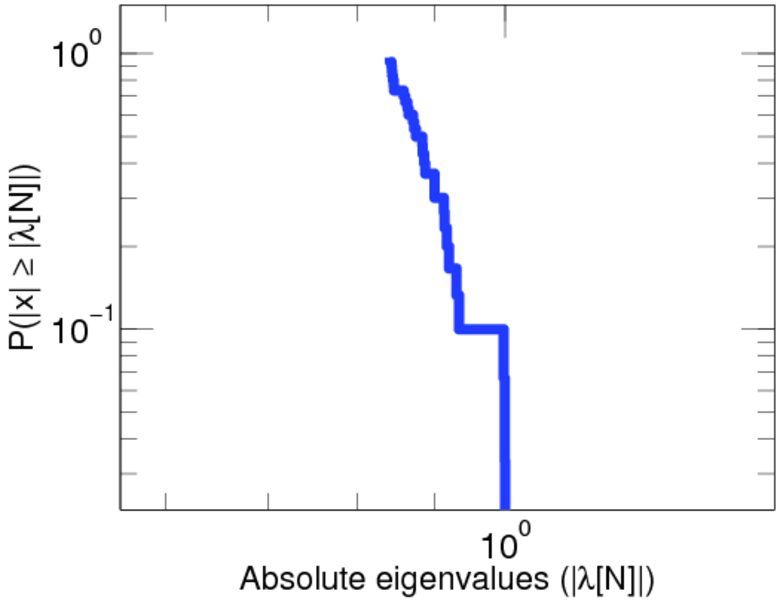
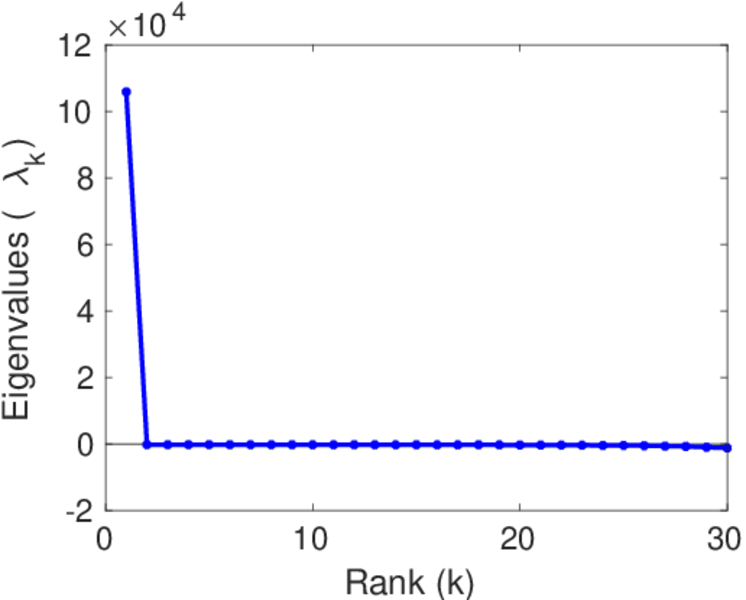
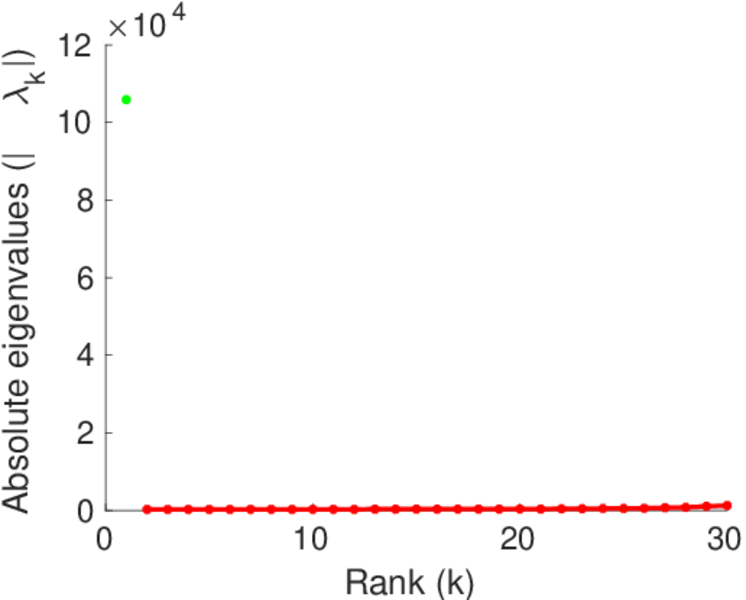
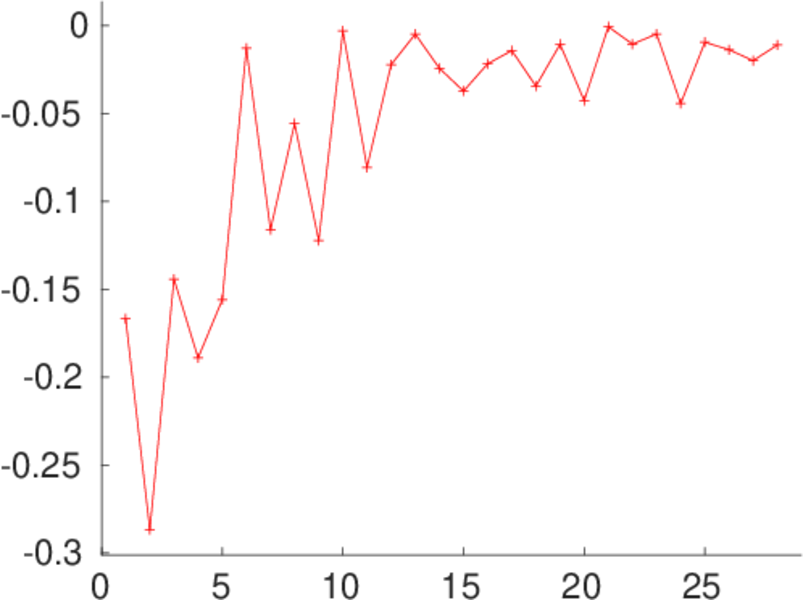
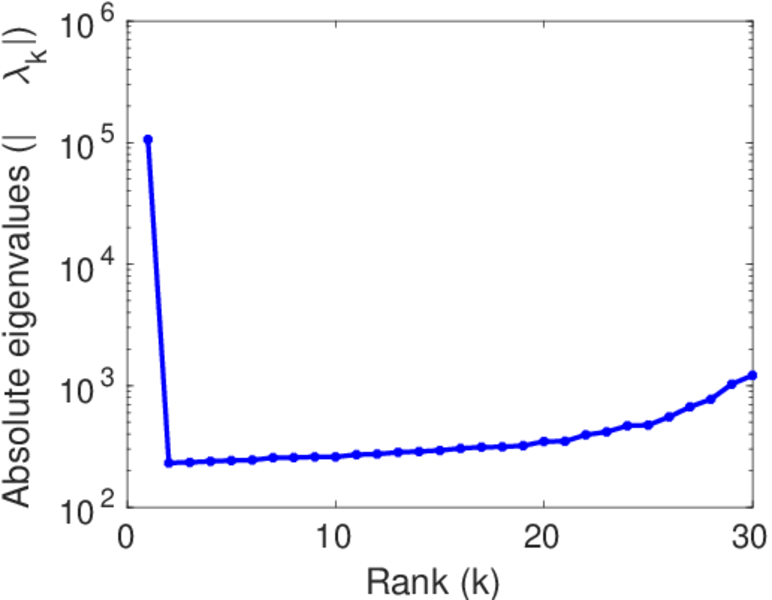
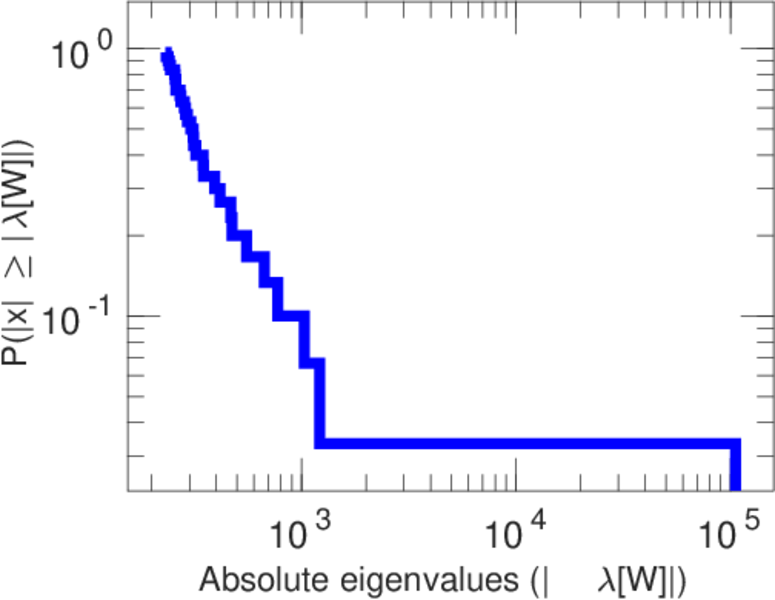
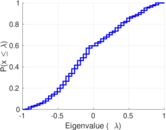
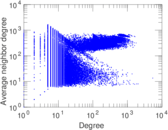
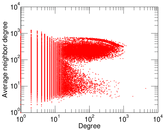
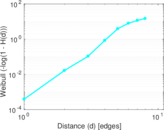
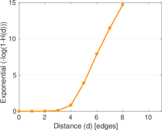
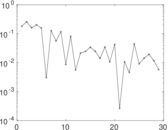
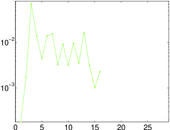
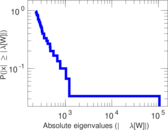
Plots


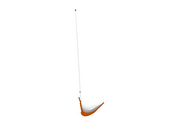
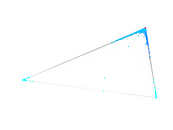


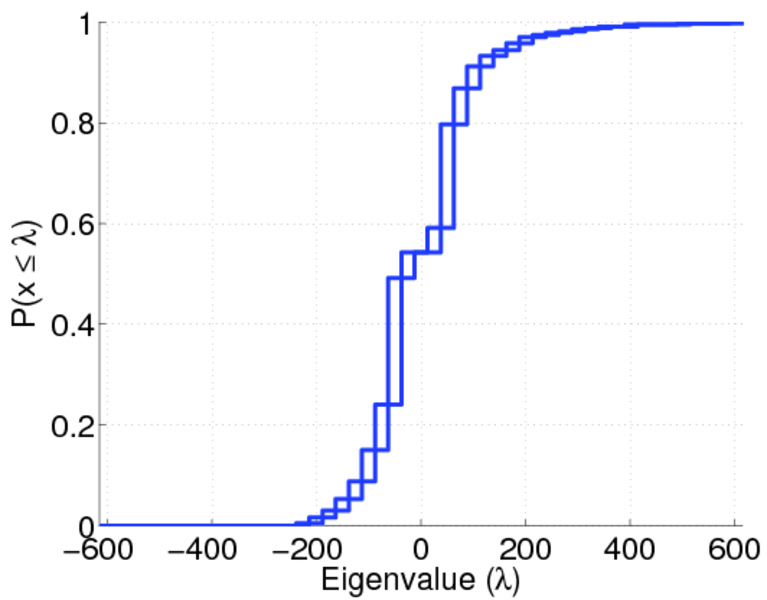
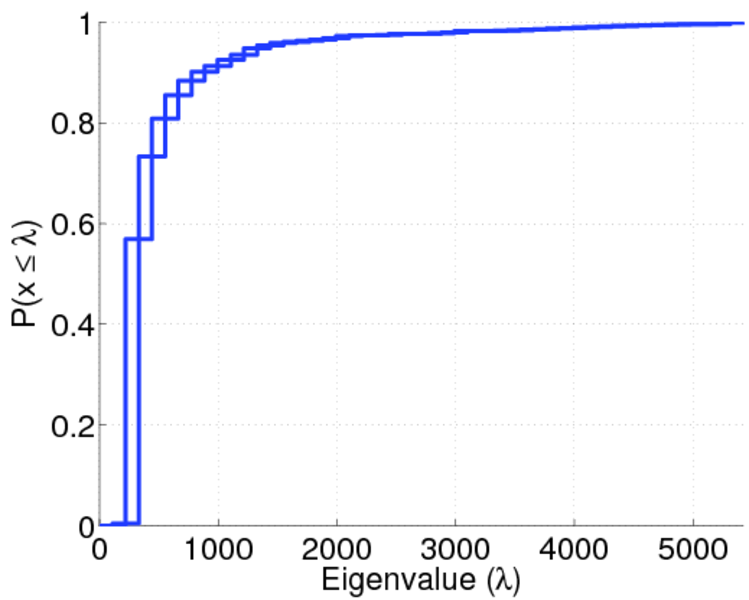
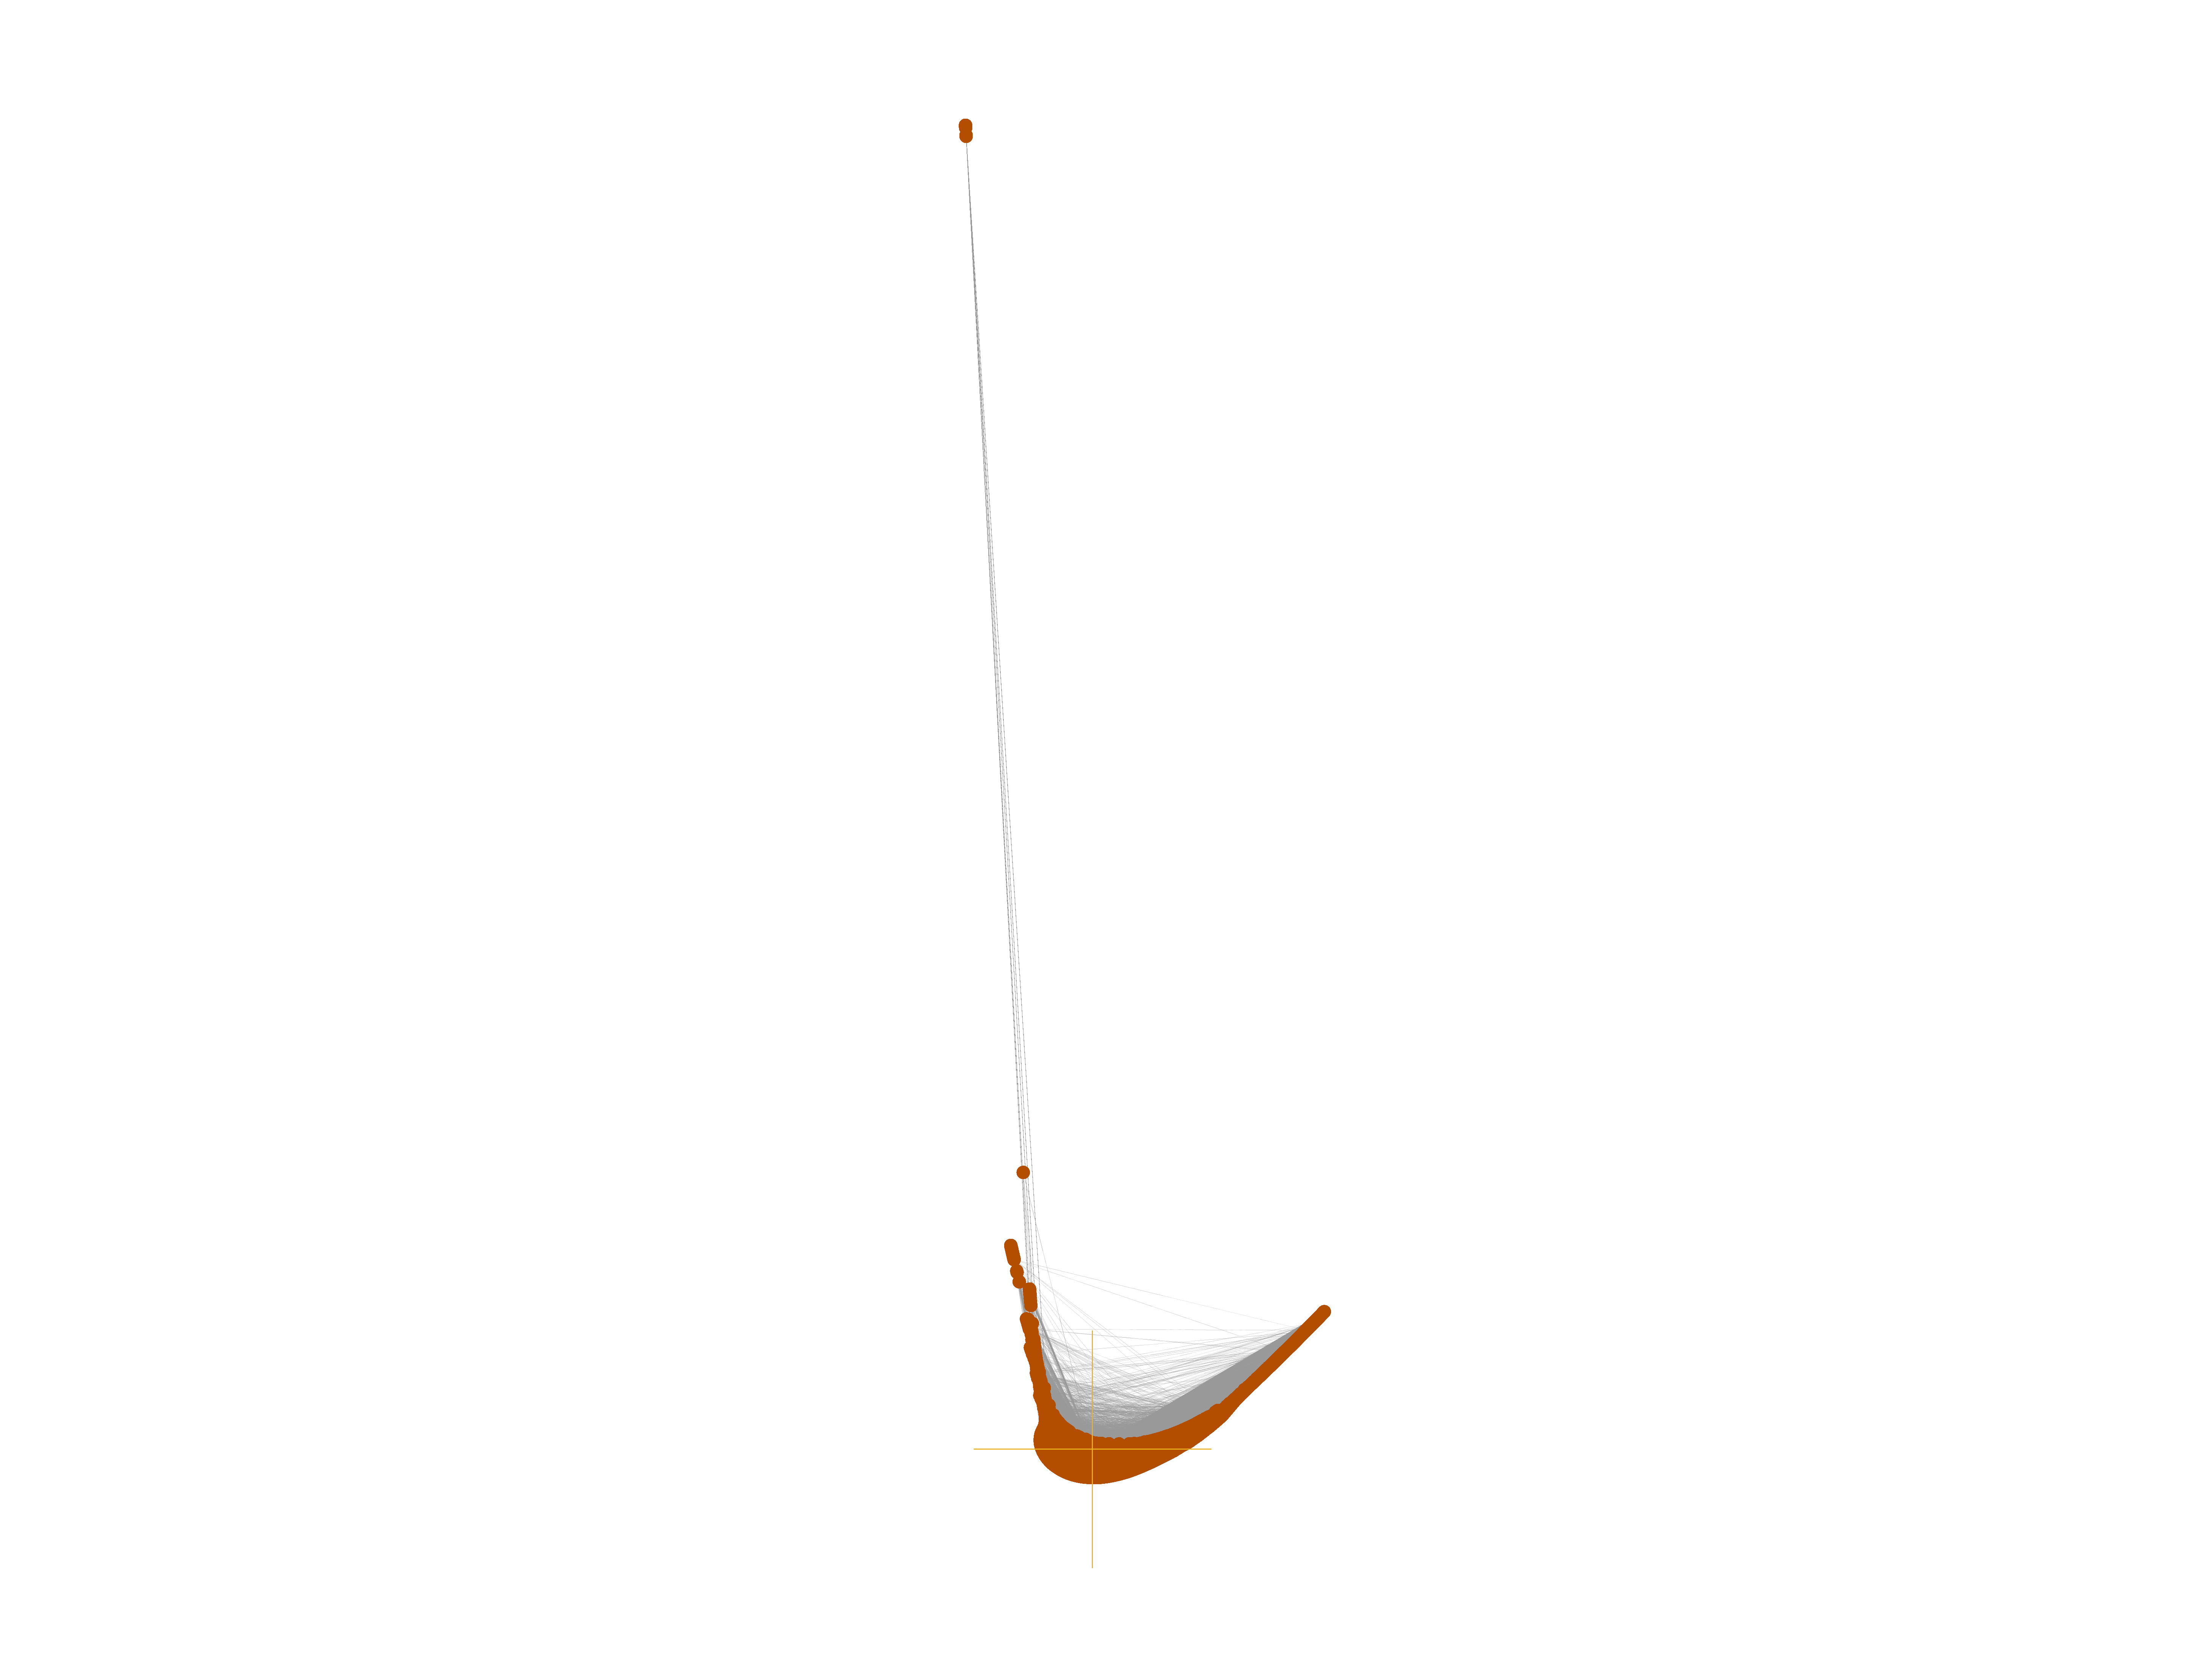
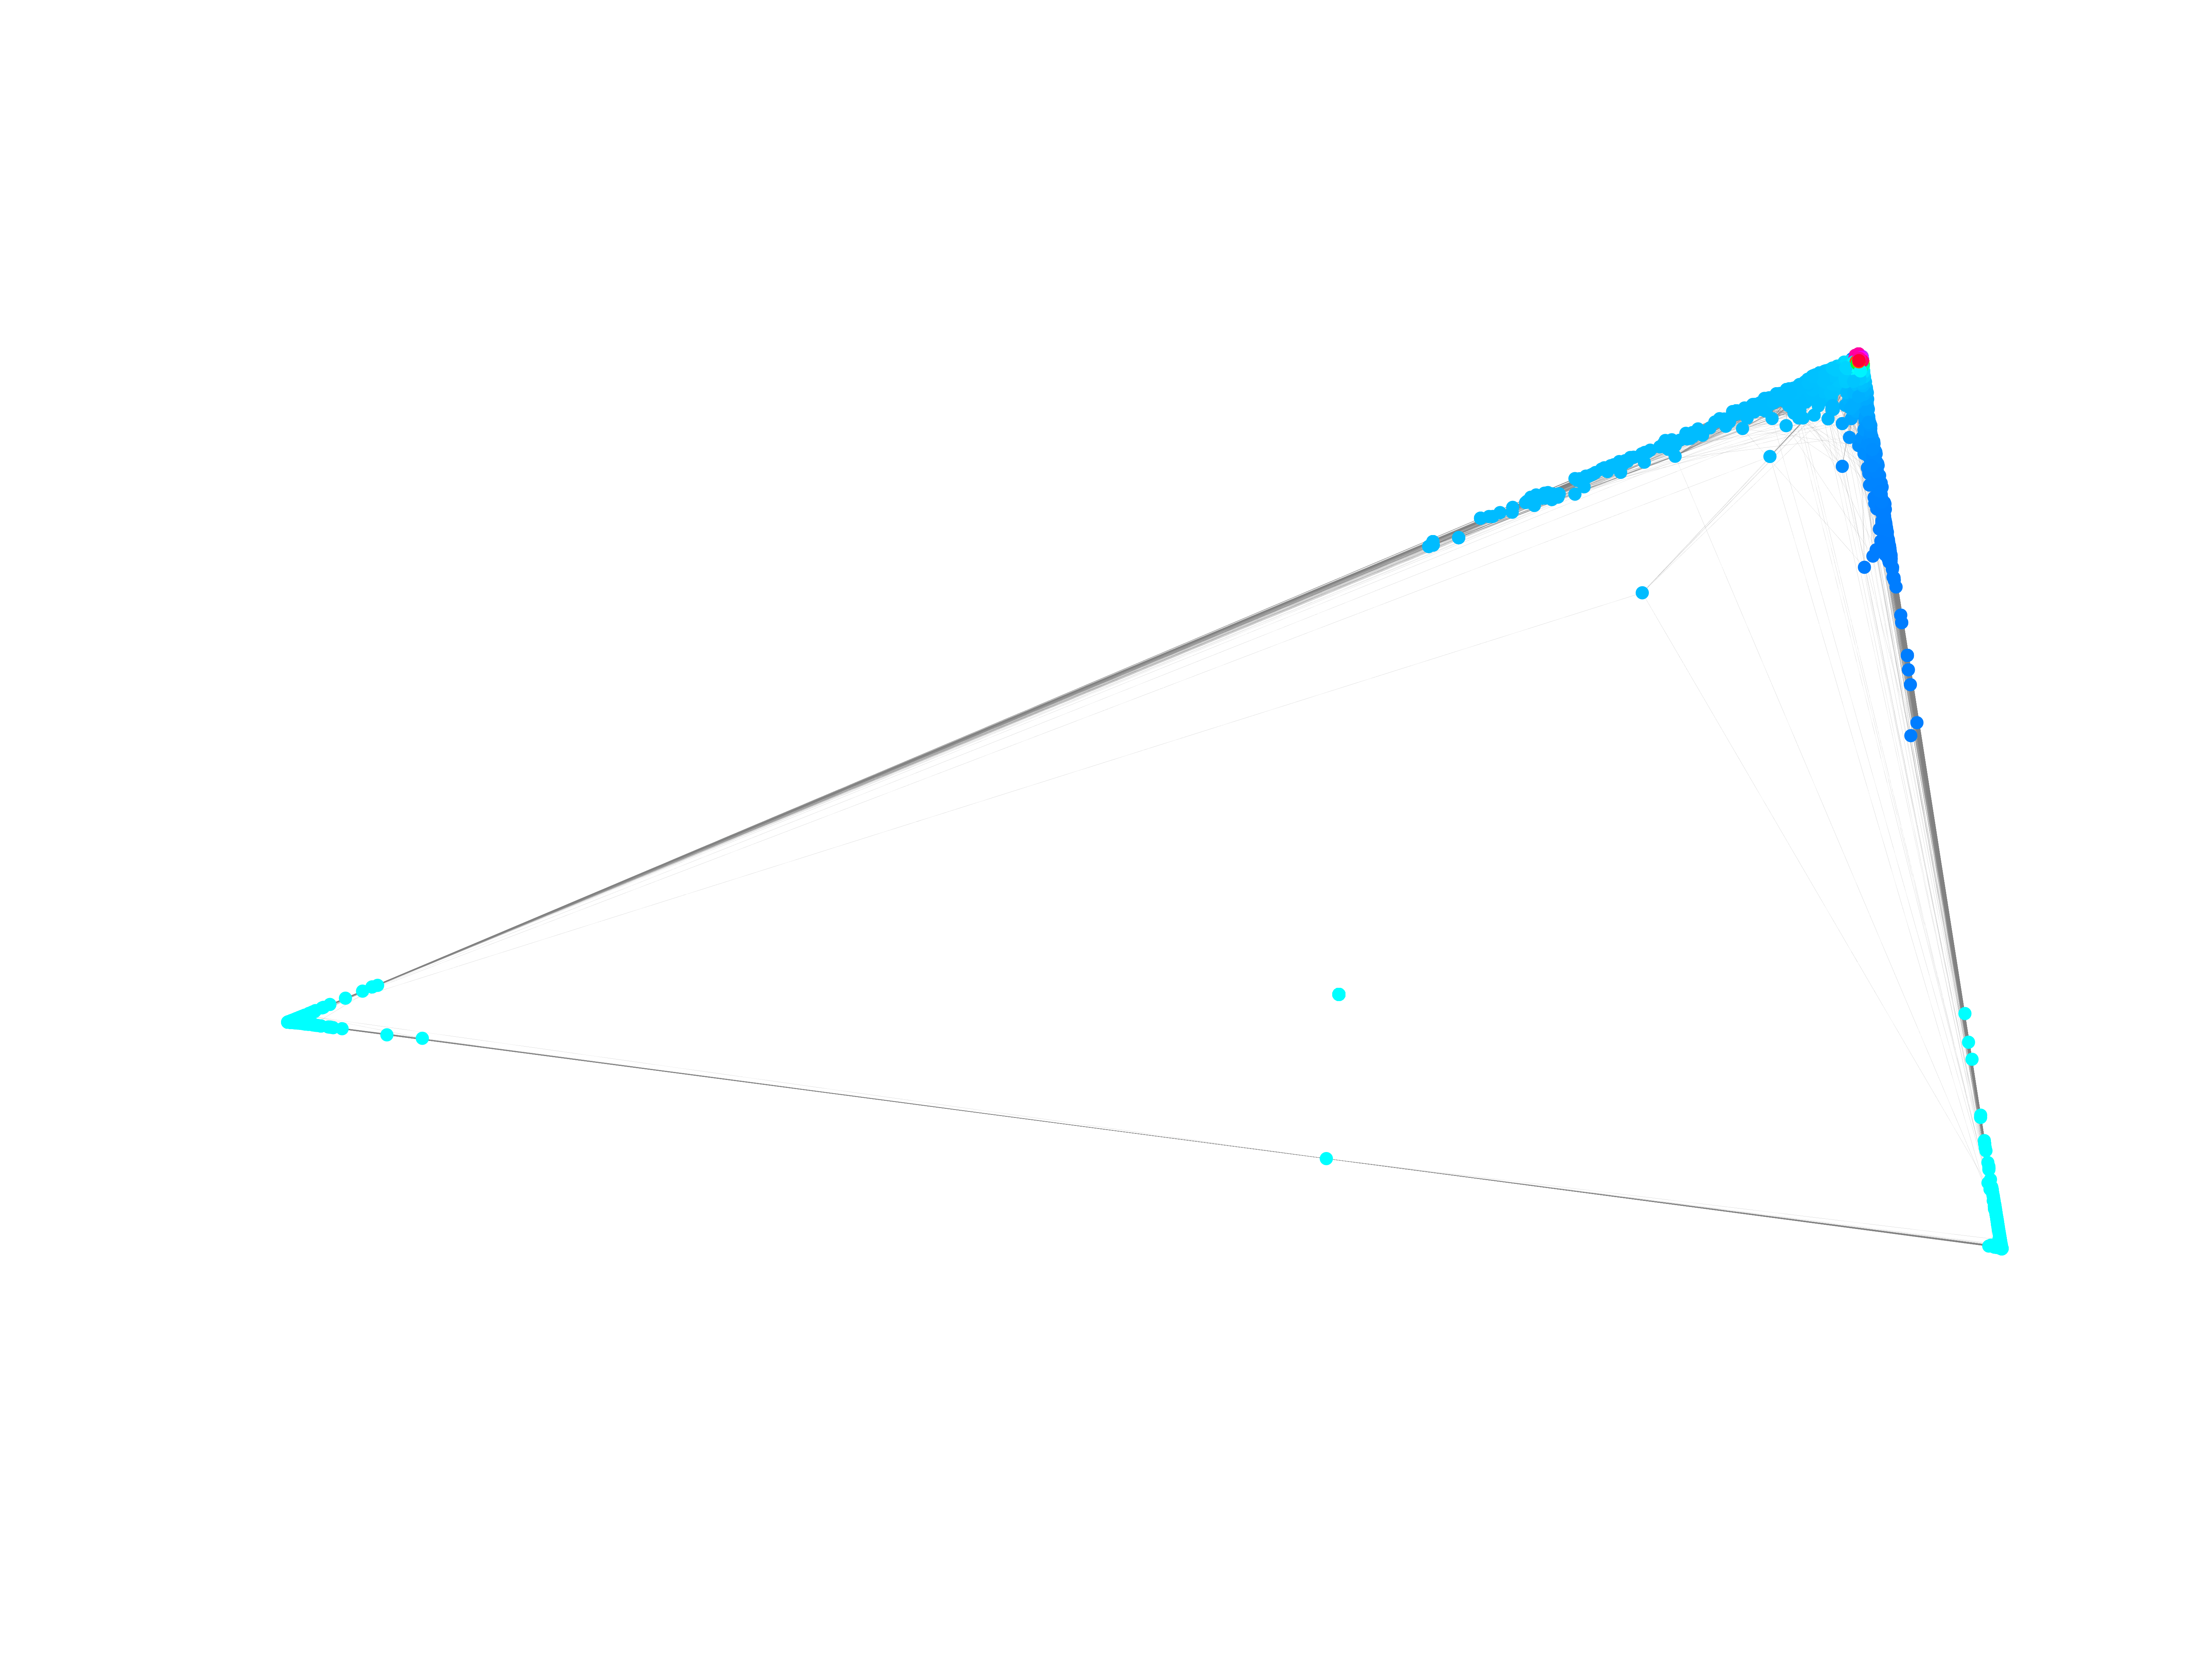
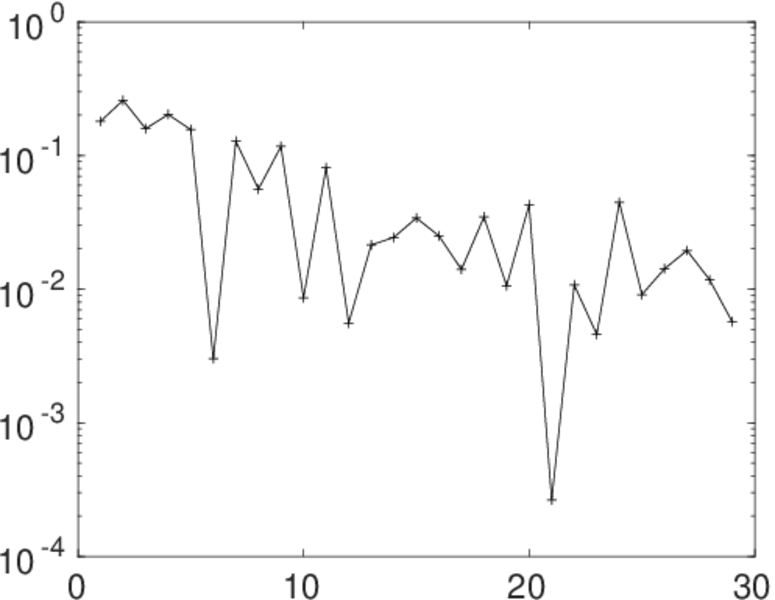
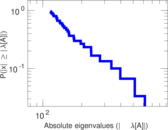
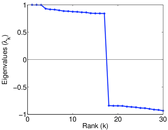
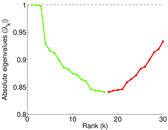
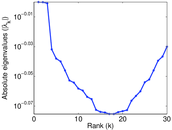
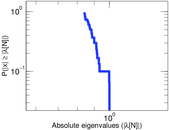
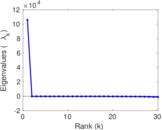
Matrix decompositions plots


Downloads
References
|
[1]
|
Jérôme Kunegis.
KONECT – The Koblenz Network Collection.
In Proc. Int. Conf. on World Wide Web Companion, pages
1343–1350, 2013.
[ http ]
|
|
[2]
|
Julian McAuley and Jure Leskovec.
Learning to discover social circles in ego networks.
In Adv. in Neural Inf. Process. Syst., pages 548–556. 2012.
|
 KONECT ‣ Networks ‣
Buy Me a Coffee
KONECT ‣ Networks ‣
Buy Me a Coffee