Flixster
This is the social network of Flixster, a movie rating site on which people can
meet others with a similar movie taste. The network is undirected and
unweighted.
Metadata
Statistics
| Size | n = | 2,523,386
|
| Volume | m = | 7,918,801
|
| Loop count | l = | 0
|
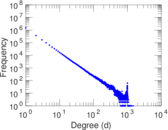
| Wedge count | s = | 1,735,571,393
|
| Claw count | z = | 370,427,745,071
|
| Cross count | x = | 74,755,363,821,014
|
| Triangle count | t = | 7,897,122
|
| Square count | q = | 454,368,595
|
| 4-Tour count | T4 = | 10,593,071,934
|
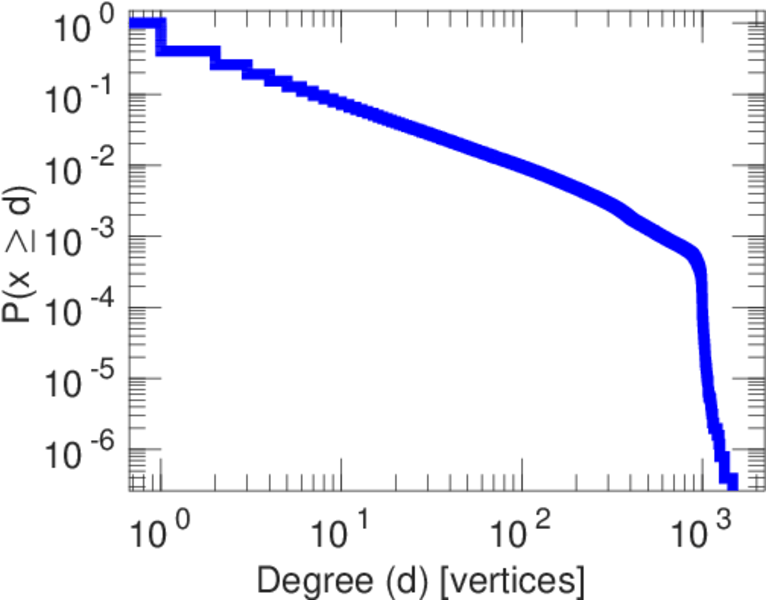
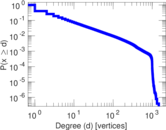
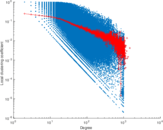
| Maximum degree | dmax = | 1,474
|
| Average degree | d = | 6.276 33
|
| Fill | p = | 2.487 27 × 10−6
|
| Size of LCC | N = | 2,523,386
|
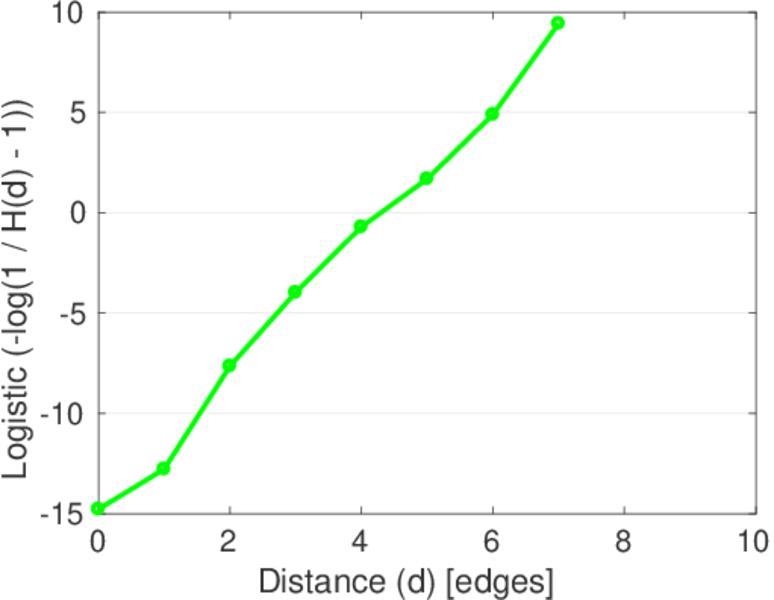
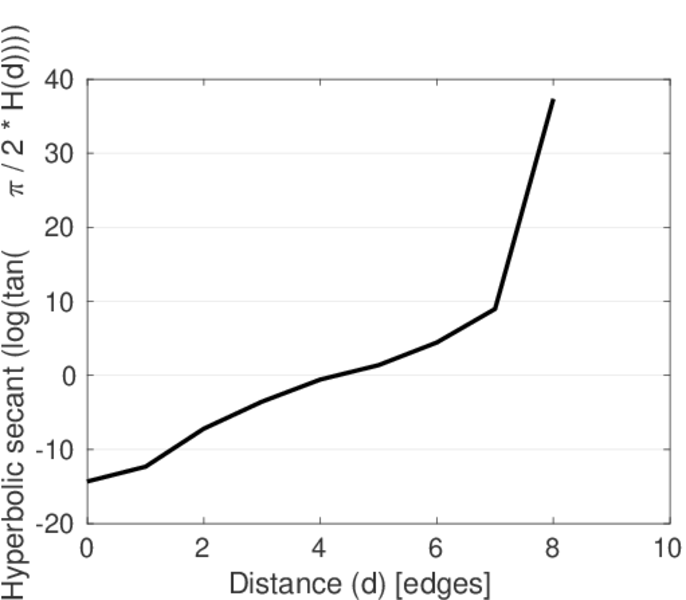
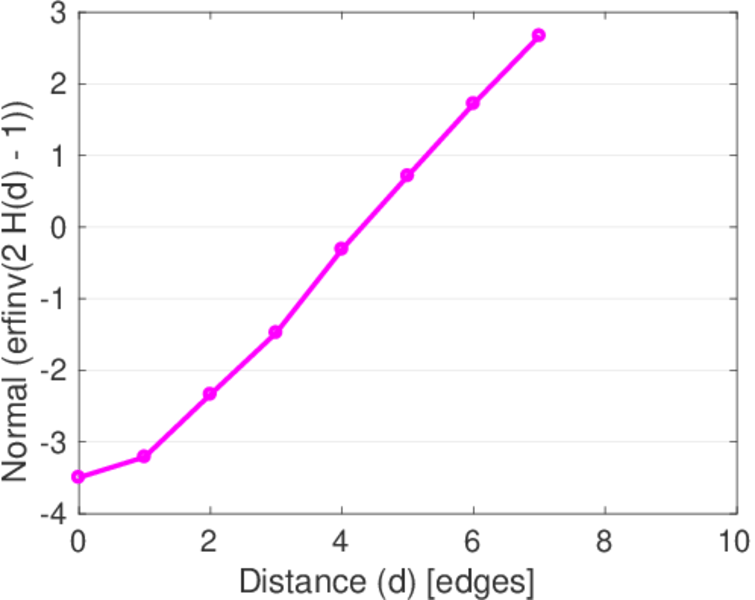
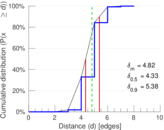
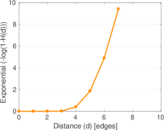
| Diameter | δ = | 8
|
| 50-Percentile effective diameter | δ0.5 = | 4.331 57
|
| 90-Percentile effective diameter | δ0.9 = | 5.380 07
|
| Median distance | δM = | 5
|
| Mean distance | δm = | 4.815 72
|
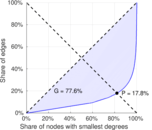
| Gini coefficient | G = | 0.775 506
|
| Balanced inequality ratio | P = | 0.177 717
|
| Relative edge distribution entropy | Her = | 0.863 745
|
| Power law exponent | γ = | 2.594 10
|
| Tail power law exponent | γt = | 1.911 00
|
| Tail power law exponent with p | γ3 = | 1.911 00
|
| p-value | p = | 0.000 00
|
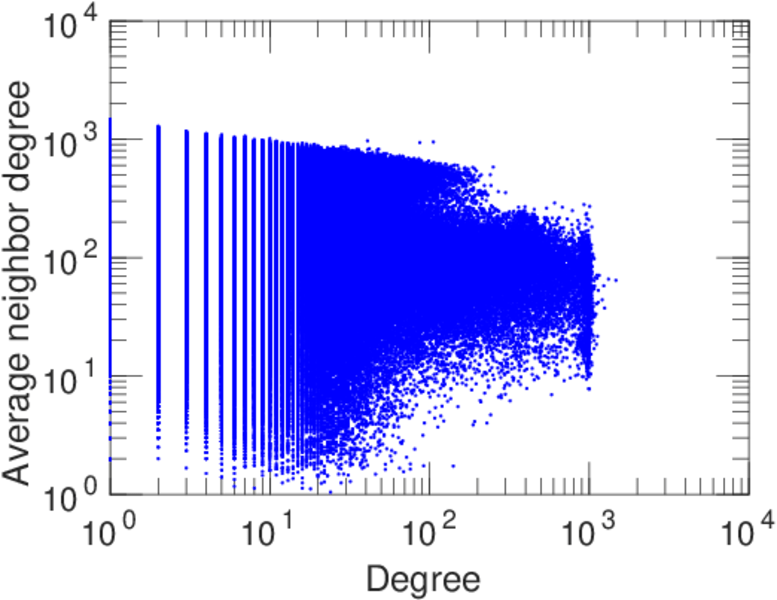
| Degree assortativity | ρ = | −0.321 231
|
| Degree assortativity p-value | pρ = | 0.000 00
|
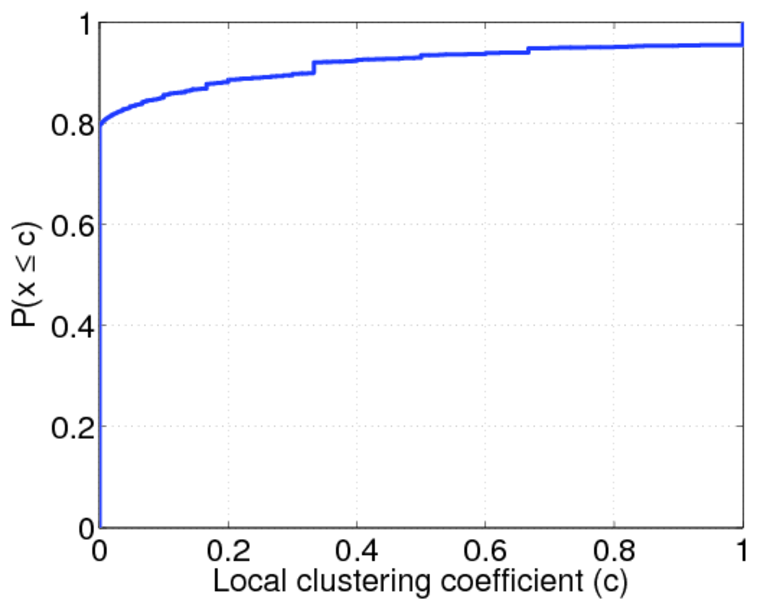
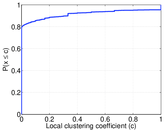
| Clustering coefficient | c = | 0.013 650 5
|
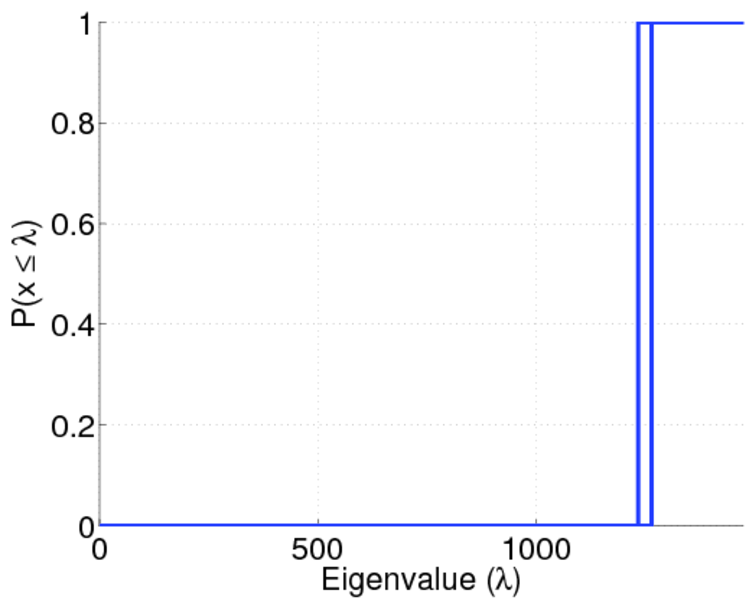
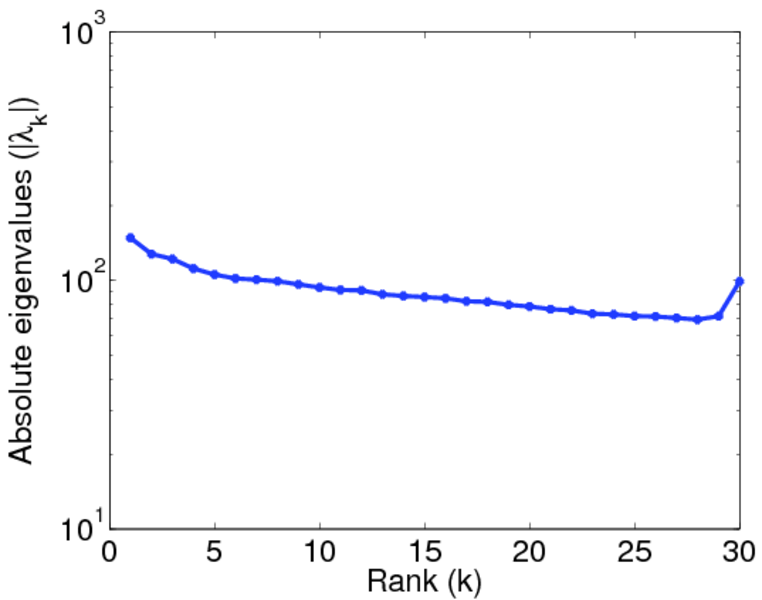
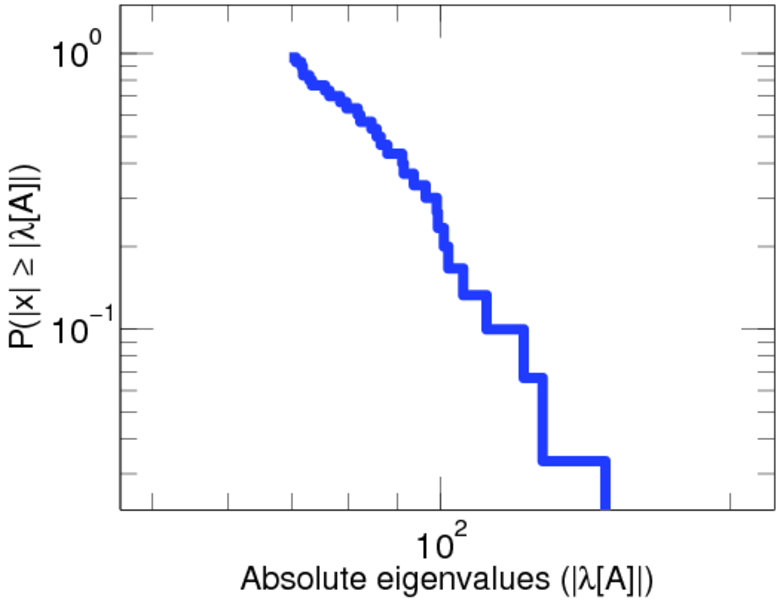
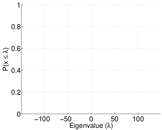
| Spectral norm | α = | 148.325
|
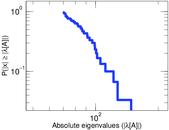
| Spectral separation | |λ1[A] / λ2[A]| = | 1.161 72
|
| Non-bipartivity | bA = | 0.332 584
|
| Normalized non-bipartivity | bN = | 0.010 436 1
|
| Algebraic non-bipartivity | χ = | 0.020 154 1
|
| Spectral bipartite frustration | bK = | 0.000 802 782
|
| Controllability | C = | 2,330,814
|
| Relative controllability | Cr = | 0.923 685
|
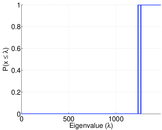
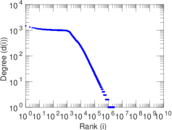
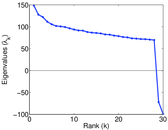
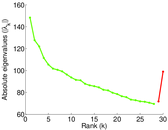
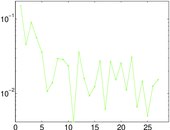
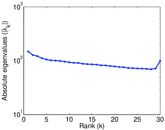
Plots


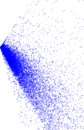
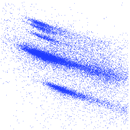


Matrix decompositions plots
Downloads
References
|
[1]
|
Jérôme Kunegis.
KONECT – The Koblenz Network Collection.
In Proc. Int. Conf. on World Wide Web Companion, pages
1343–1350, 2013.
[ http ]
|
|
[2]
|
R. Zafarani and H. Liu.
Social computing data repository at ASU, 2009.
[ http ]
|
 KONECT ‣ Networks ‣
Buy Me a Coffee
KONECT ‣ Networks ‣
Buy Me a Coffee