Gene fusion

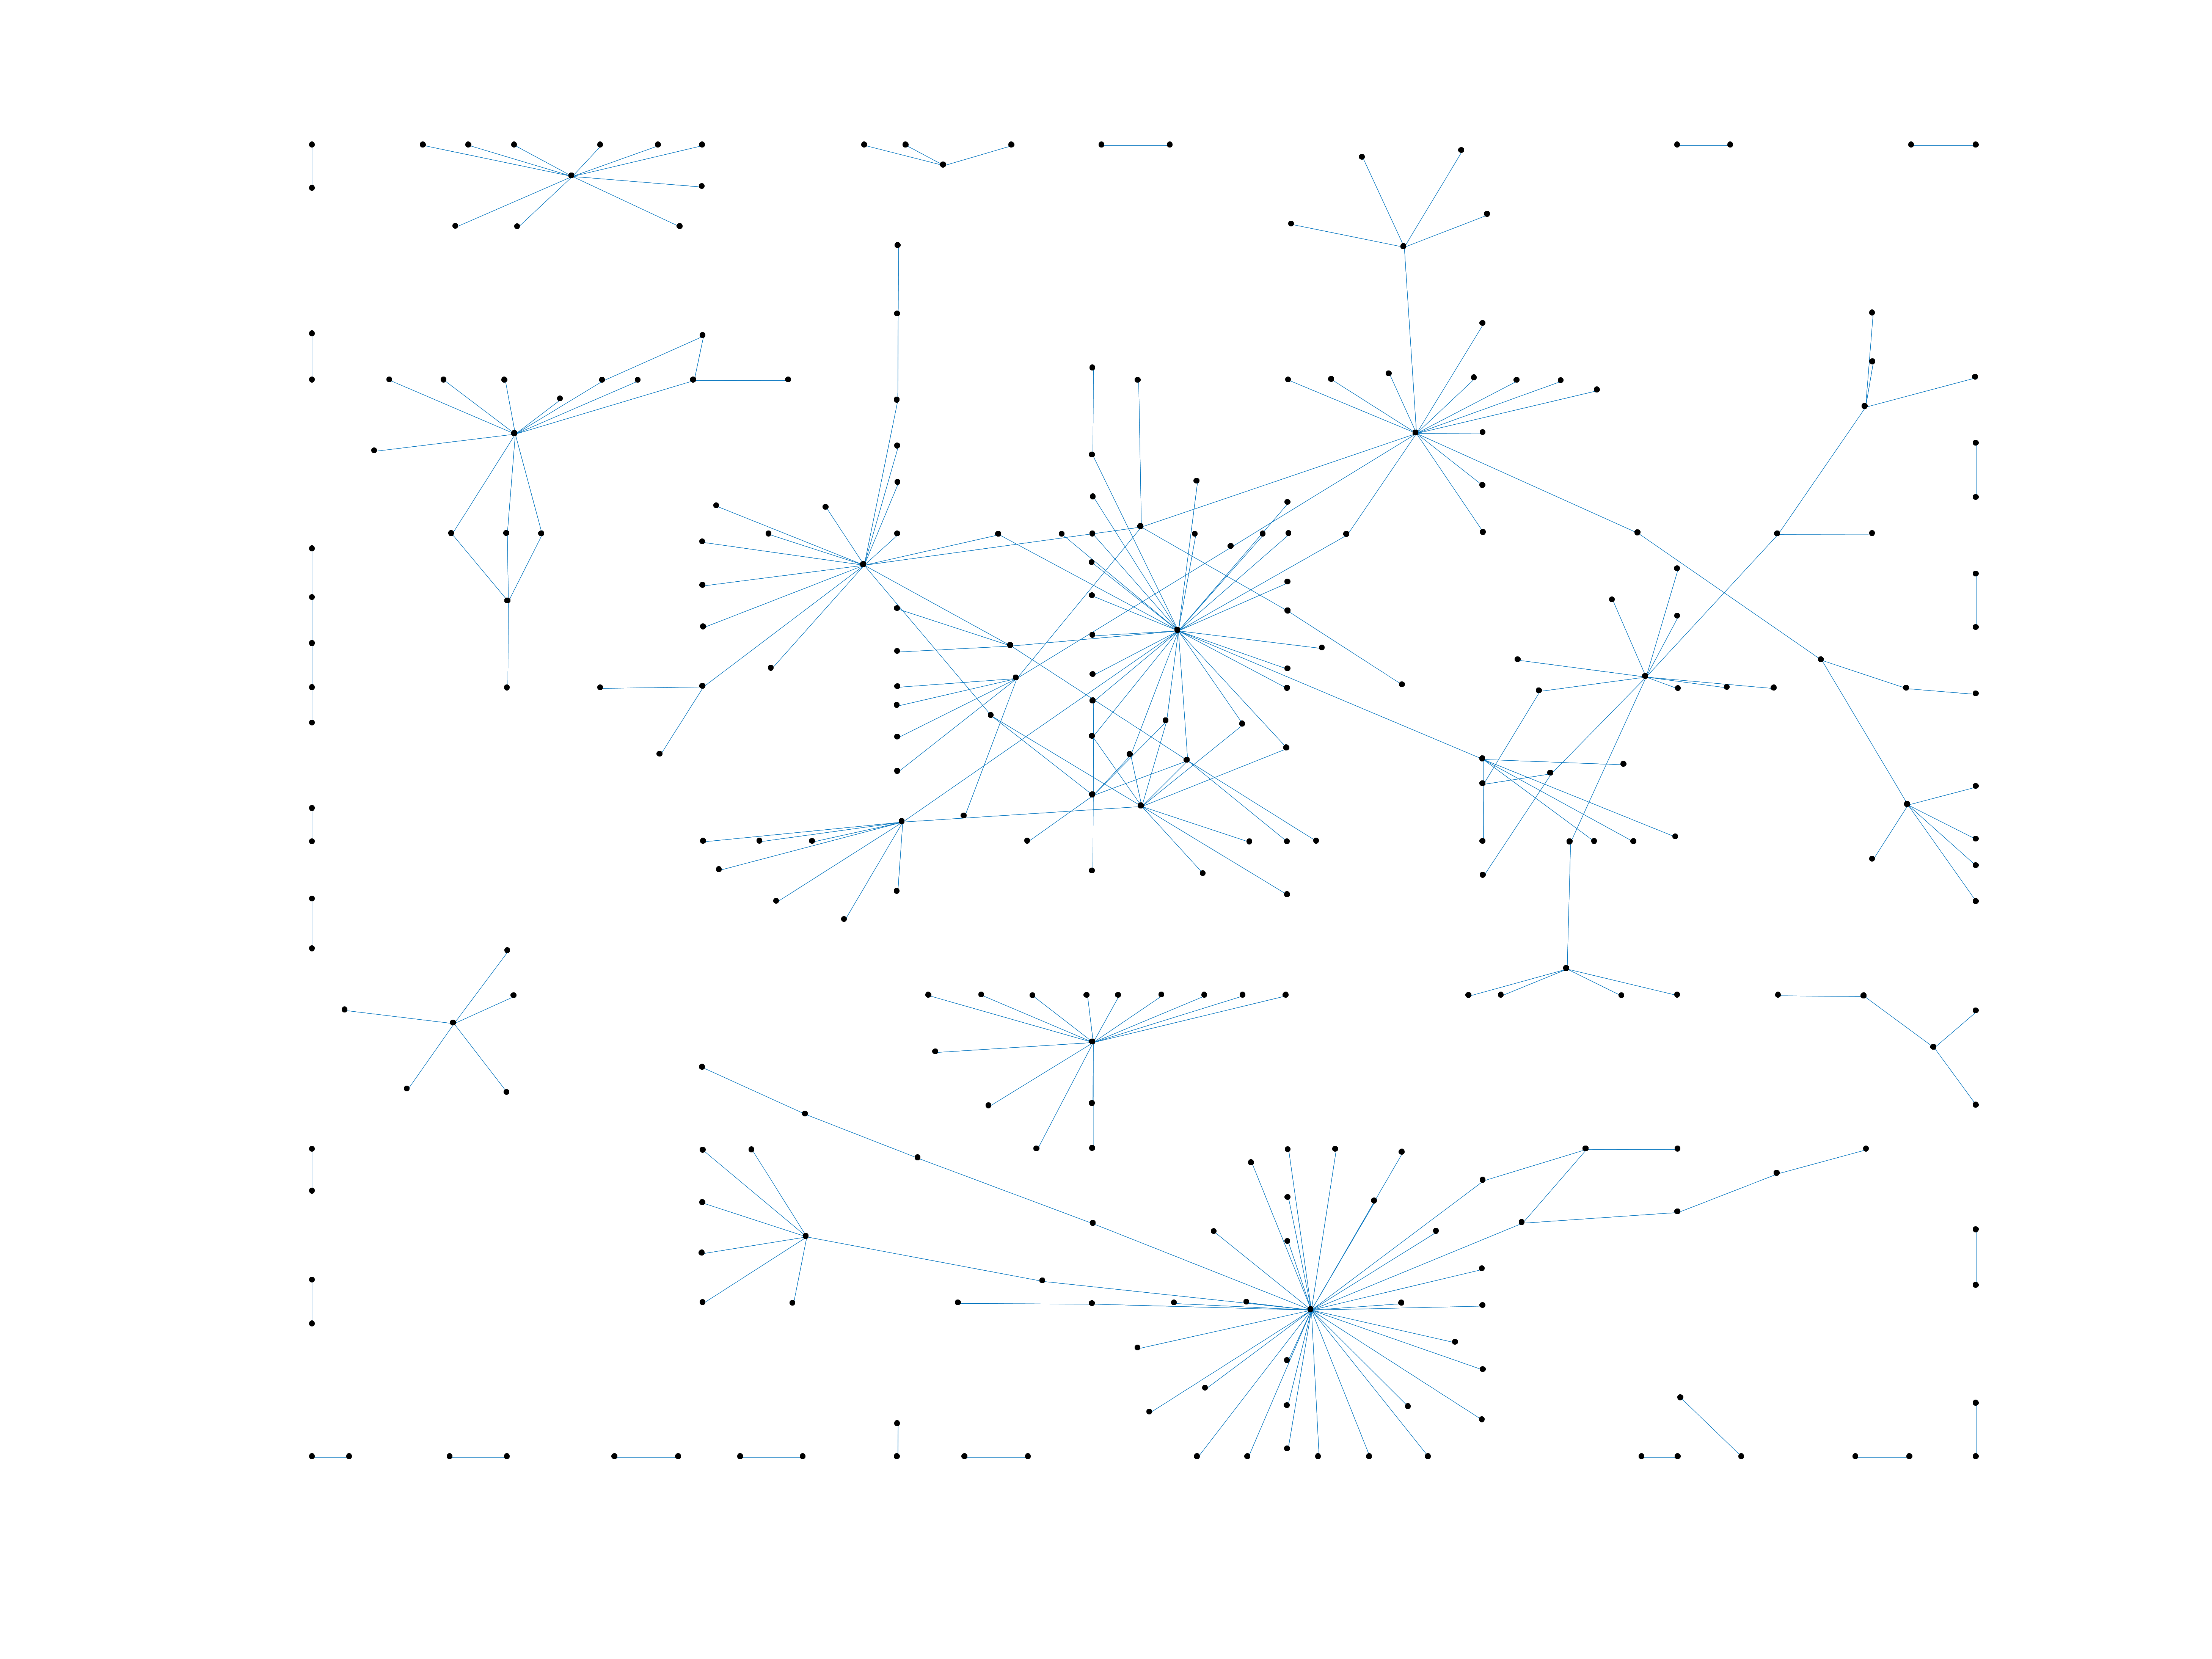
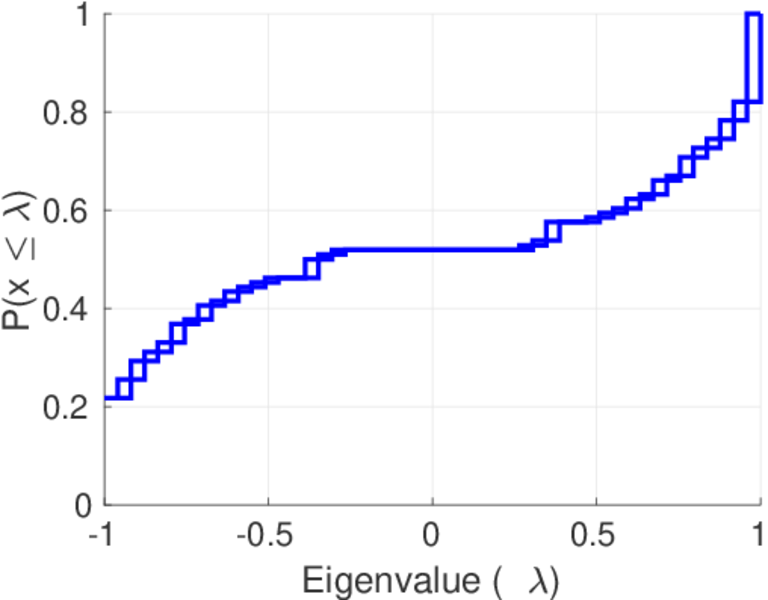
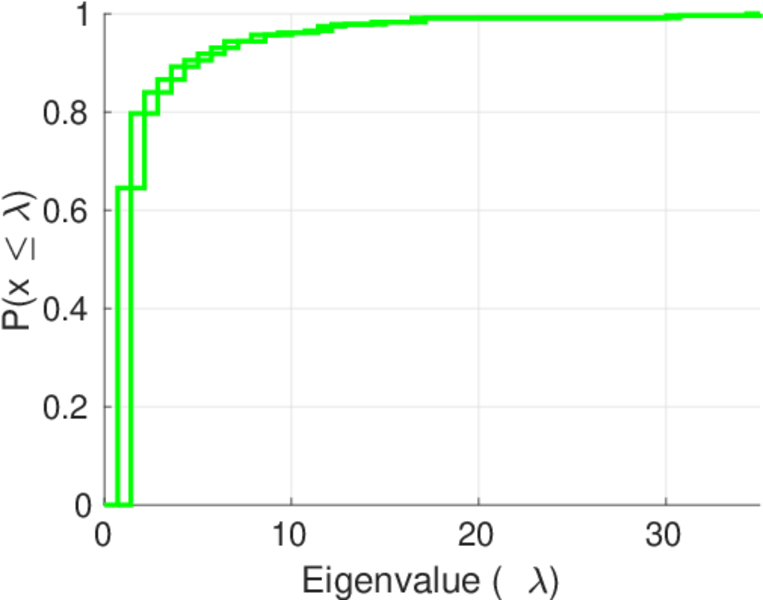
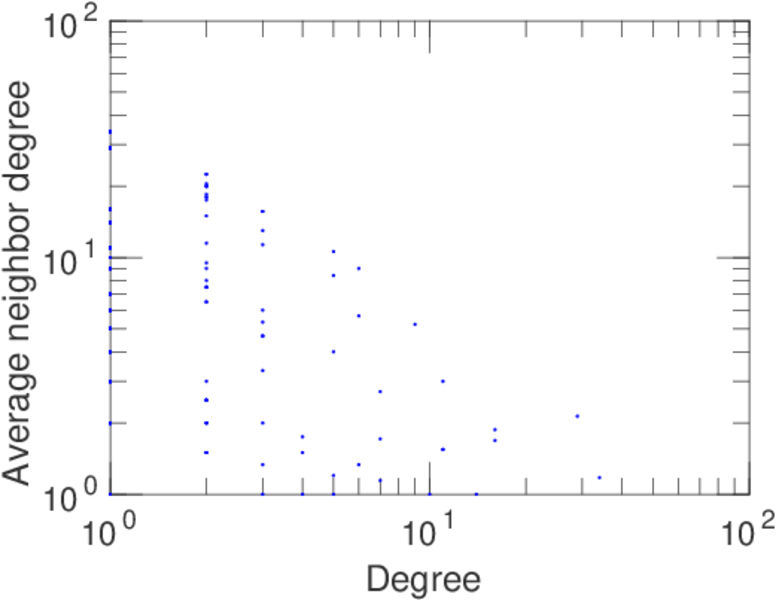
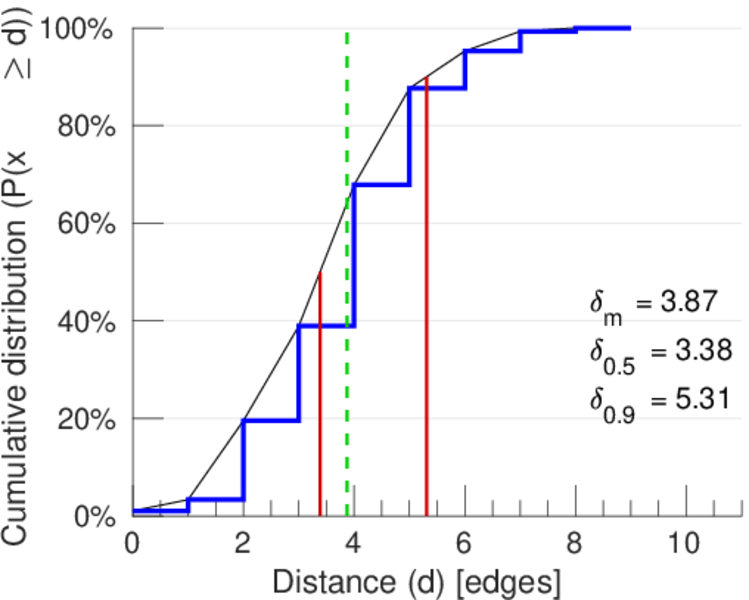
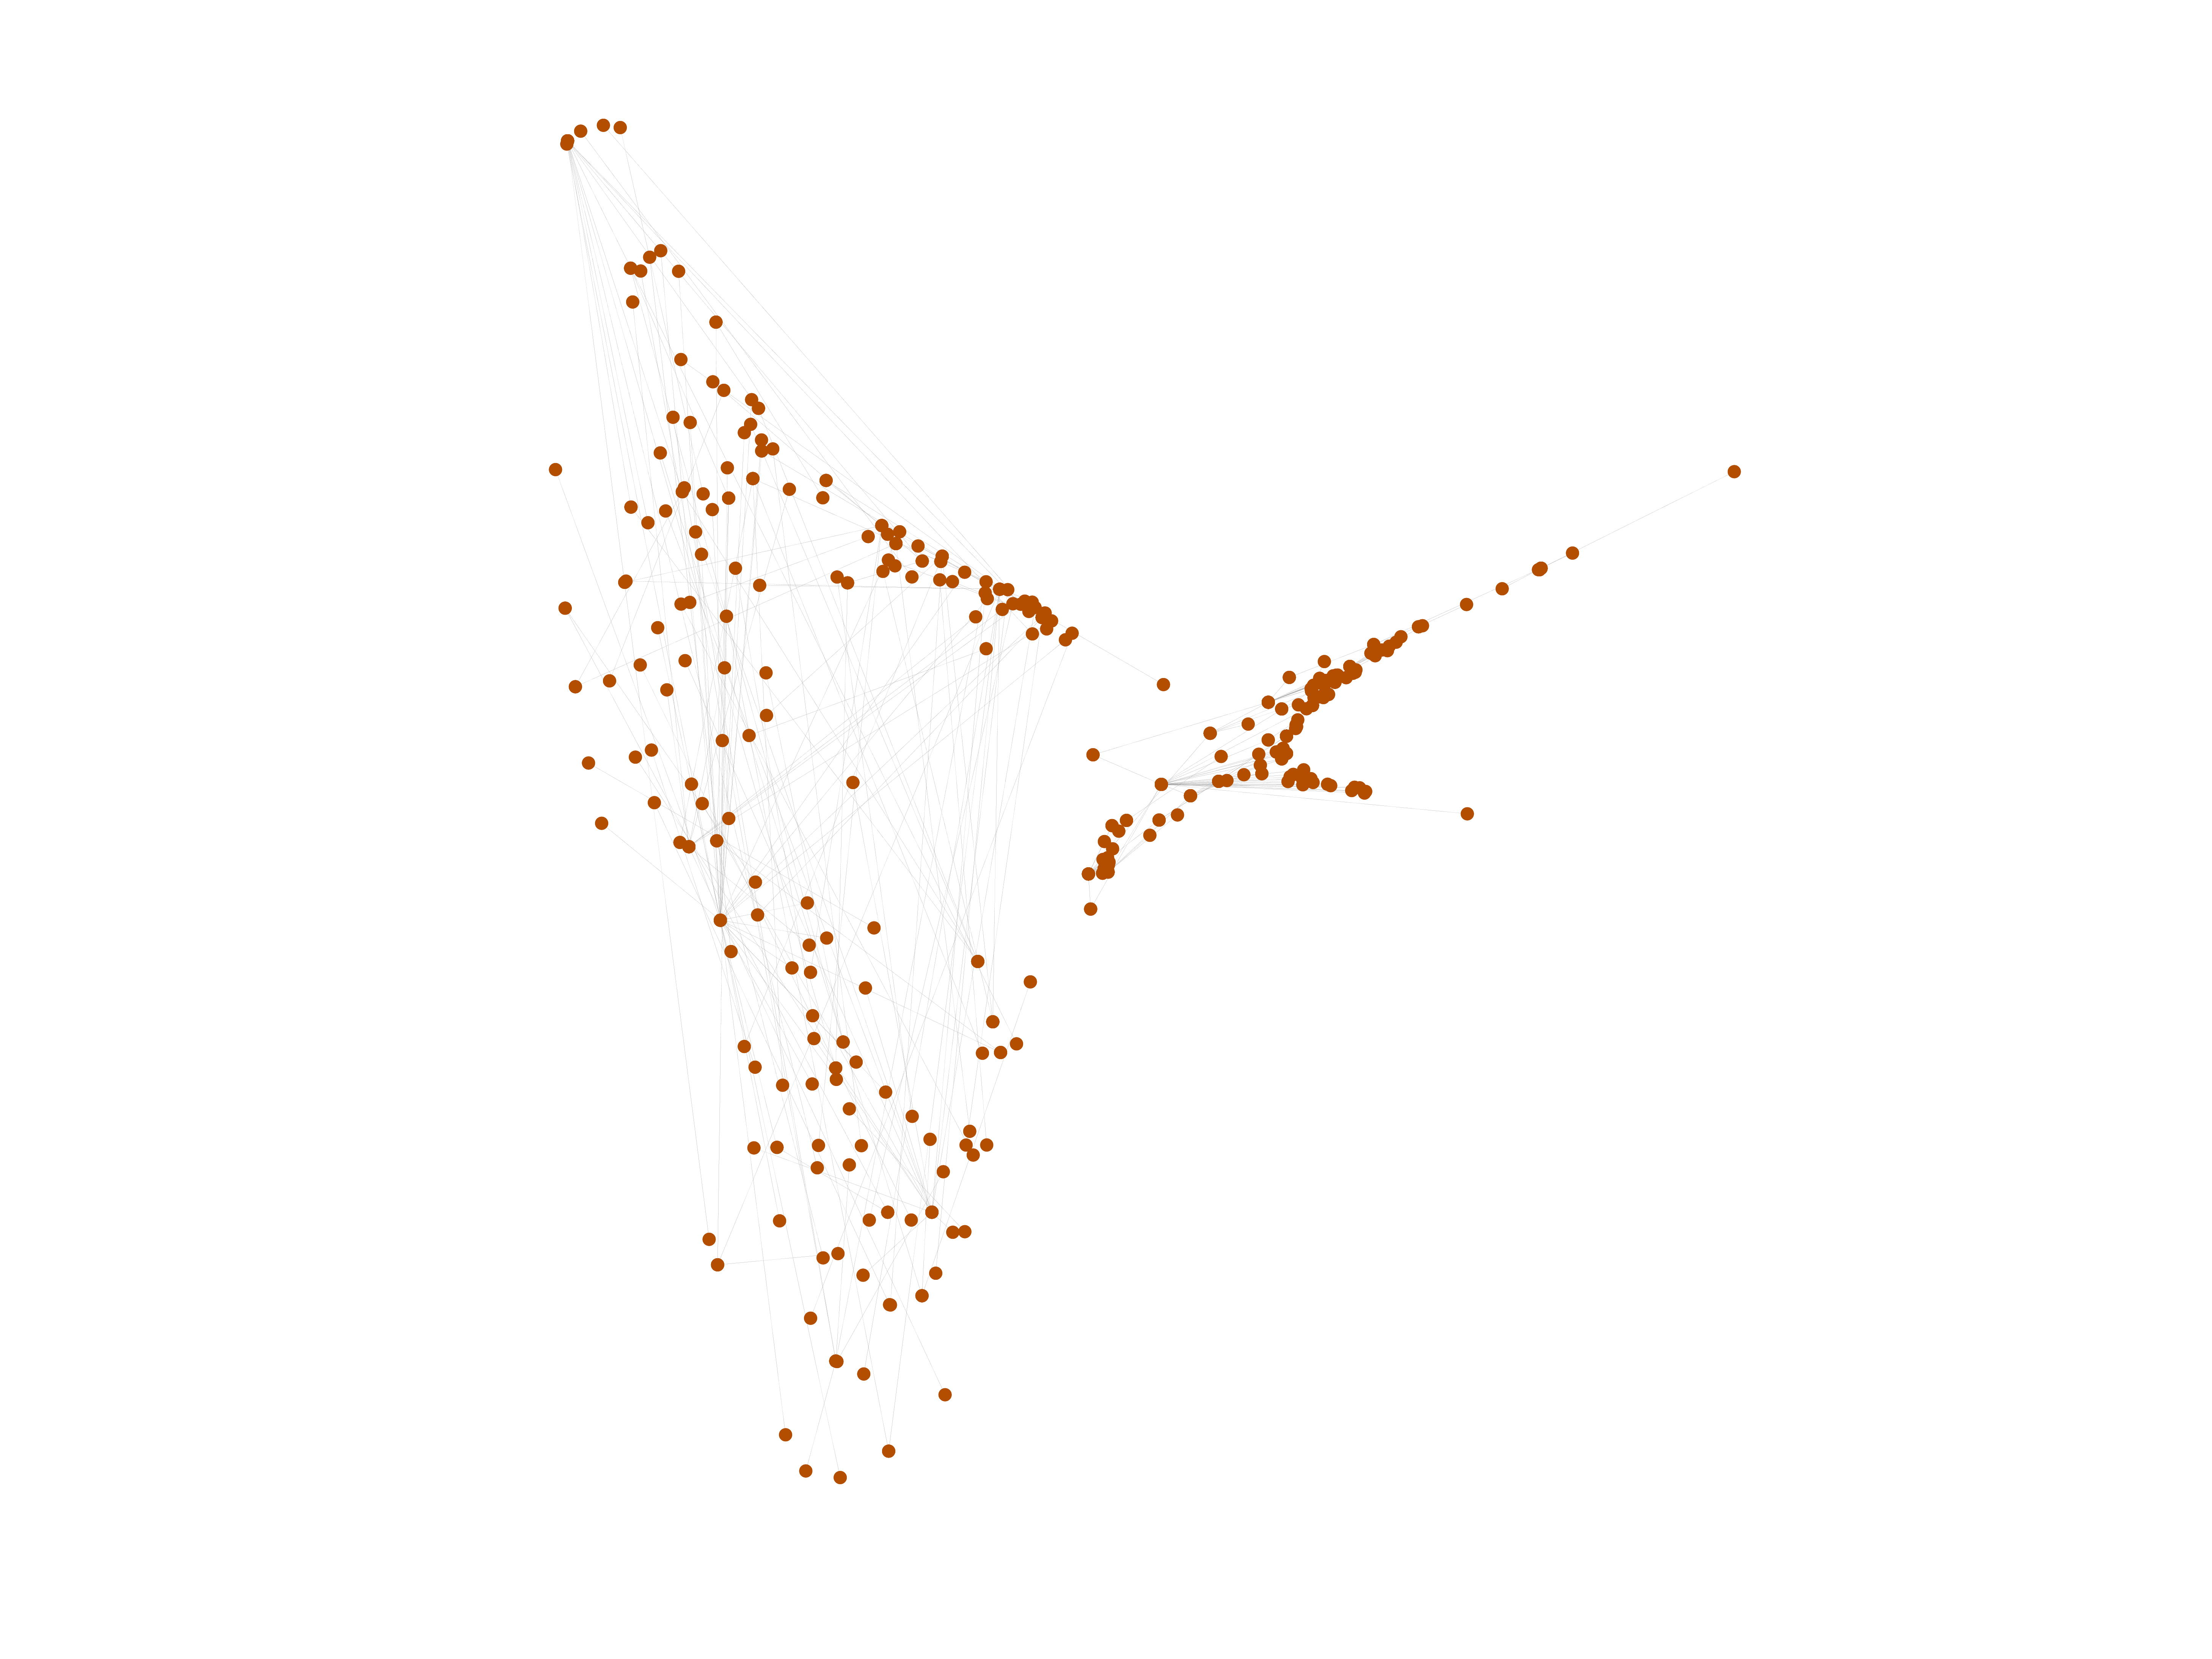
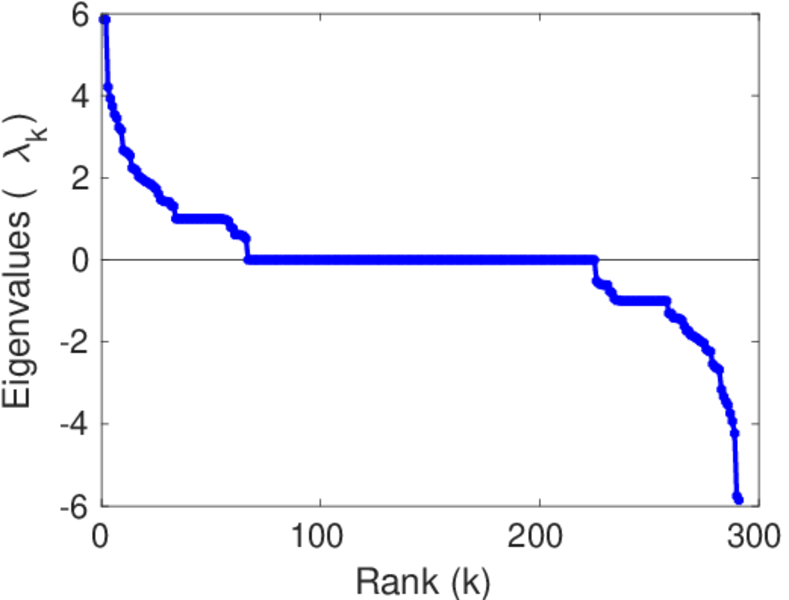
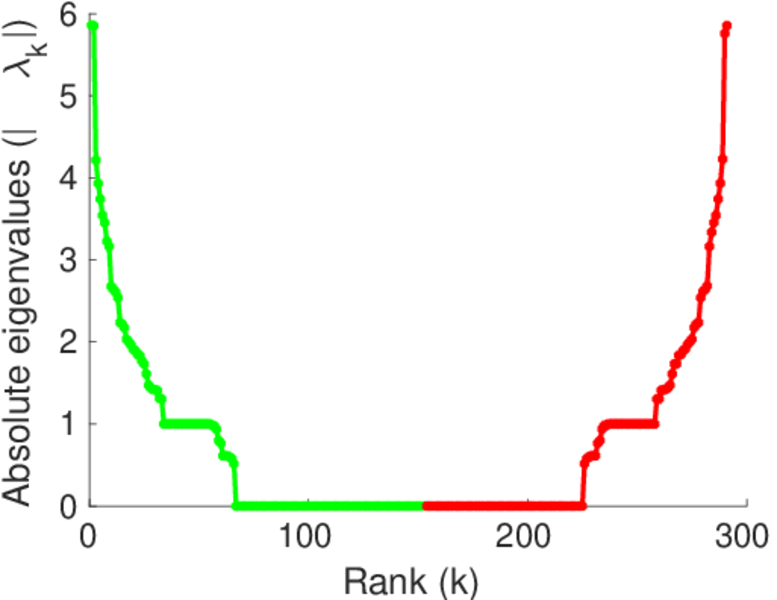
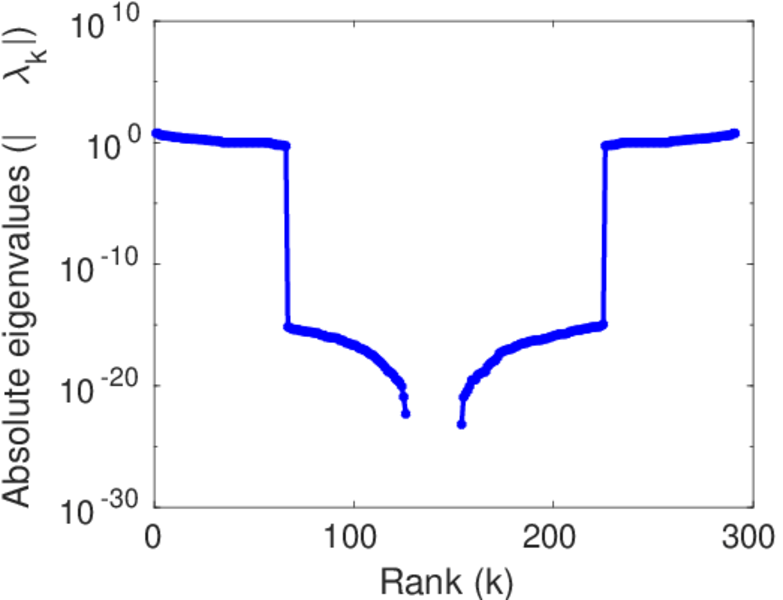
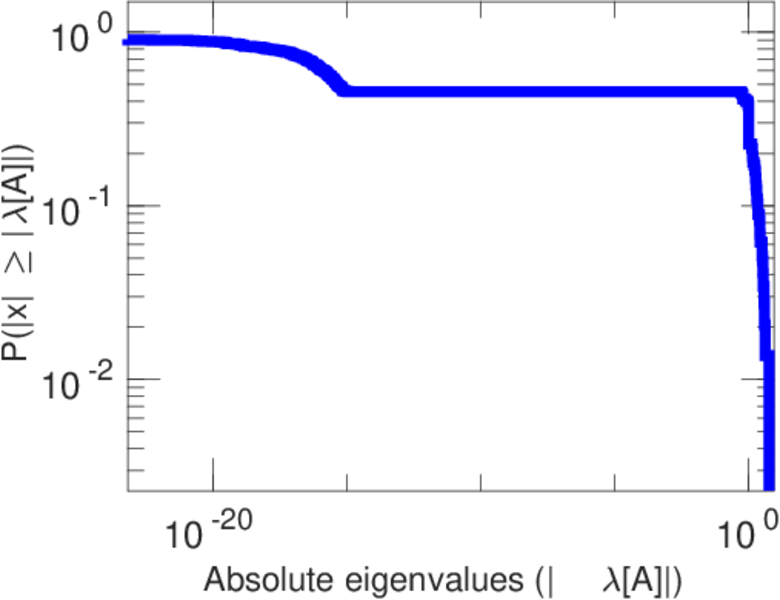
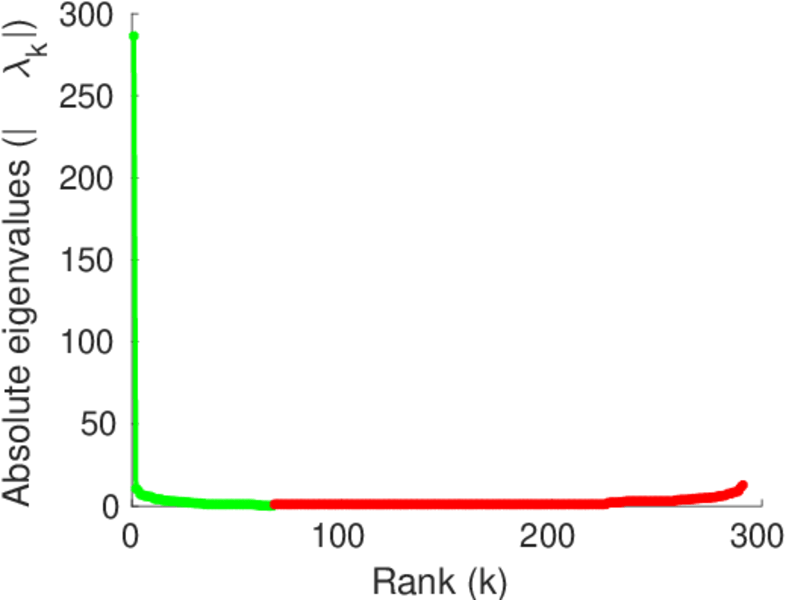
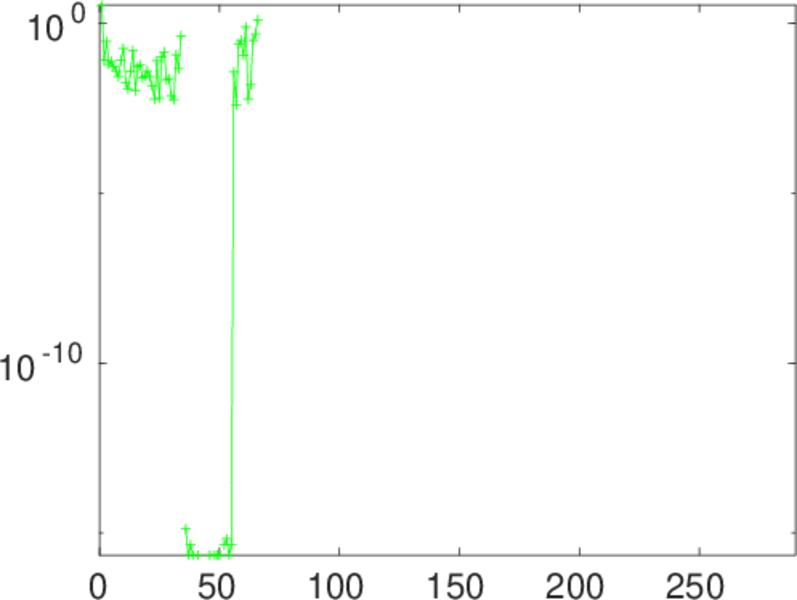
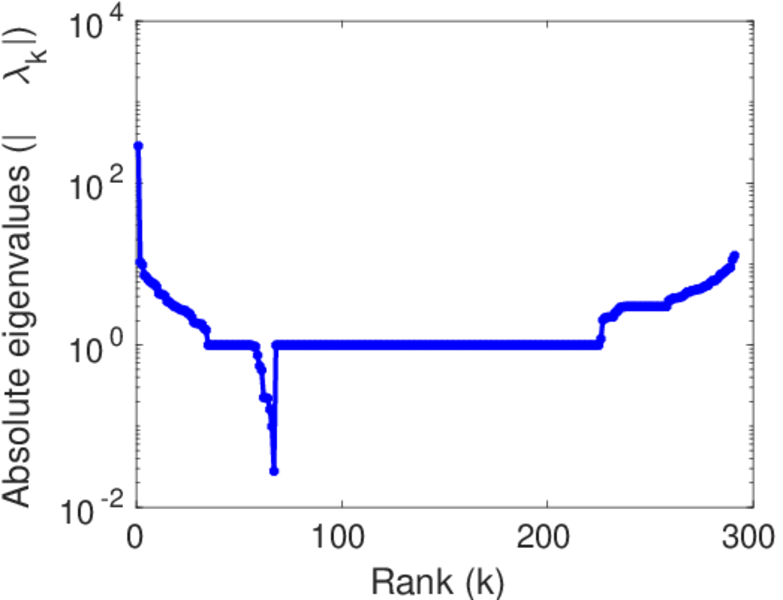
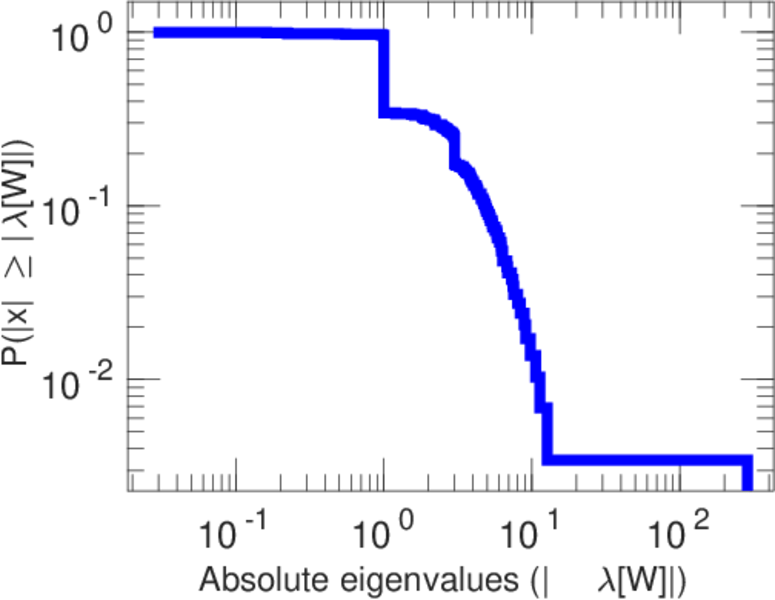
This is a gene fusion network. Nodes are genes, and two nodes are connected if the two genes have been observed to have fused during the emergence of cancer.

Metadata

CodeGF
Internal namegene_fusion
NameGene fusion
AvailabilityDataset is available for download
Consistency checkDataset passed all tests
Category
Miscellaneous network
Dataset timestamp 2006
Node meaningGene
Edge meaningObserved fusion during oncogenesis
Network formatUnipartite, undirected
Edge typeUnweighted, no multiple edges
LoopsDoes not contain loops
Snapshot Is a snapshot and likely to not contain all data

Statistics

Size n =291
Volume m =279
Loop count l =0
Wedge count s =1,786
Claw count z =12,060
Cross count x =76,272
Triangle count t =1
Square count q =41
4-Tour count T4 =8,030
Maximum degree dmax =34
Average degree d =1.917 53
Fill p =0.006 612 16
Size of LCC N =110
Diameter δ =9
50-Percentile effective diameter δ0.5 =3.383 24
90-Percentile effective diameter δ0.9 =5.308 95
Median distance δM =4
Mean distance δm =3.871 39
Gini coefficient G =0.431 672
Balanced inequality ratio P =0.340 502
Relative edge distribution entropy Her =0.901 129
Power law exponent γ =4.457 36
Tail power law exponent γt =2.501 00
Tail power law exponent with p γ3 =2.501 00
p-value p =0.060 000 0
Degree assortativity ρ =−0.354 688
Degree assortativity p-value pρ =5.512 93 × 10−18
Clustering coefficient c =0.001 679 73
Spectral norm α =5.858 17
Algebraic connectivity a =0.030 839 7
Spectral separation 1[A] / λ2[A]| =1.000 84
Non-bipartivity bA =0.000 835 519
Normalized non-bipartivity bN =0.006 500 11
Algebraic non-bipartivity χ =0.013 441 4
Spectral bipartite frustration bK =0.001 490 47
Controllability C =159
Relative controllability Cr =0.546 392

Plots

Fruchterman–Reingold graph drawing

Degree distribution

Cumulative degree distribution

Lorenz curve

Spectral distribution of the adjacency matrix

Spectral distribution of the normalized adjacency matrix

Spectral distribution of the Laplacian

Spectral graph drawing based on the adjacency matrix

Spectral graph drawing based on the Laplacian

Spectral graph drawing based on the normalized adjacency matrix

Degree assortativity

Zipf plot

Hop distribution

Double Laplacian graph drawing

Delaunay graph drawing

Clustering coefficient distribution

Average neighbor degree distribution

SynGraphy

Matrix decompositions plots

Downloads

References

[1] Jérôme Kunegis. KONECT – The Koblenz Network Collection. In Proc. Int. Conf. on World Wide Web Companion, pages 1343–1350, 2013. [ http ]
[2] Mattias Höglund, Attila Frigyesi, and Felix Mitelman. A gene fusion network in human neoplasia. Oncogene, 25(18):2674, 2006.