Github
This is the membership network of the software development hosting site GitHub.
The network is bipartite and contains users and projects, with links denoting
that a user is a member of a project.
Metadata
Statistics
| Size | n = | 177,386
|
| Left size | n1 = | 56,519
|
| Right size | n2 = | 120,867
|
| Volume | m = | 440,237
|
| Wedge count | s = | 53,048,506
|
| Claw count | z = | 17,233,019,660
|
| Cross count | x = | 9,927,710,269,155
|
| Square count | q = | 50,894,505
|
| 4-Tour count | T4 = | 620,327,470
|
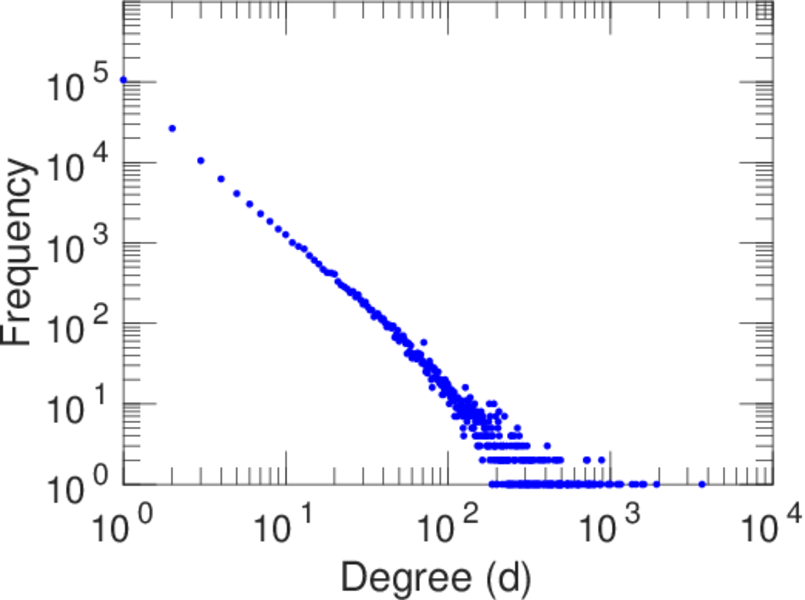
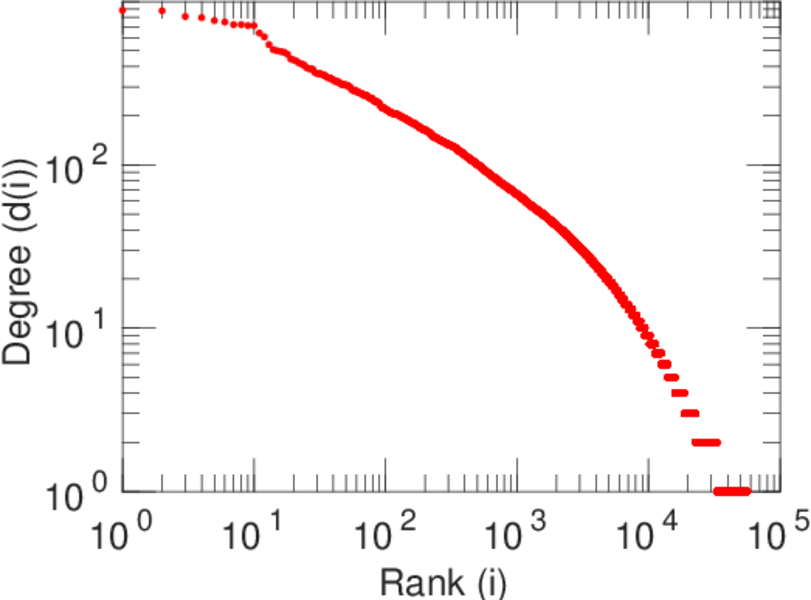
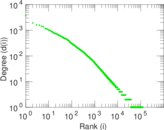
| Maximum degree | dmax = | 3,675
|
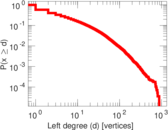
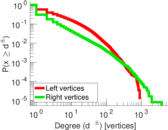
| Maximum left degree | d1max = | 884
|
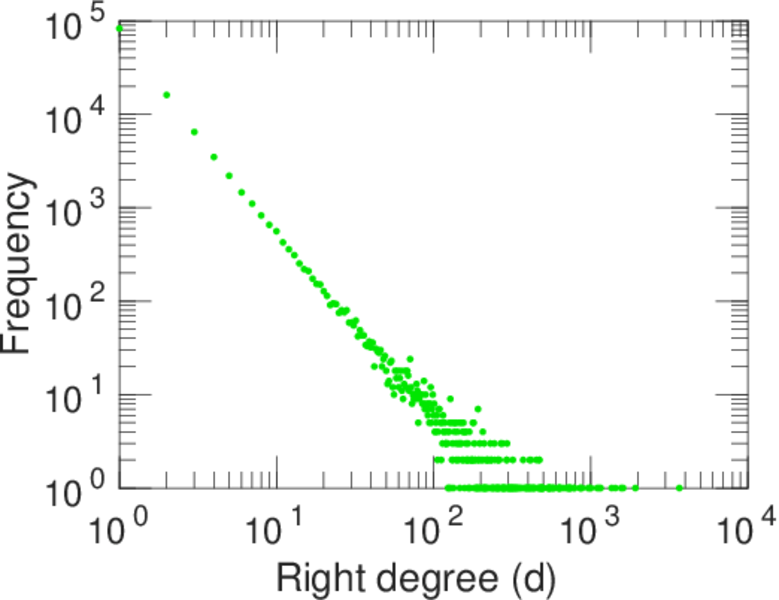
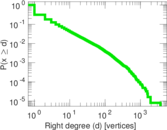
| Maximum right degree | d2max = | 3,675
|
| Average degree | d = | 4.963 60
|
| Average left degree | d1 = | 7.789 19
|
| Average right degree | d2 = | 3.642 33
|
| Fill | p = | 6.444 43 × 10−5
|
| Size of LCC | N = | 139,737
|
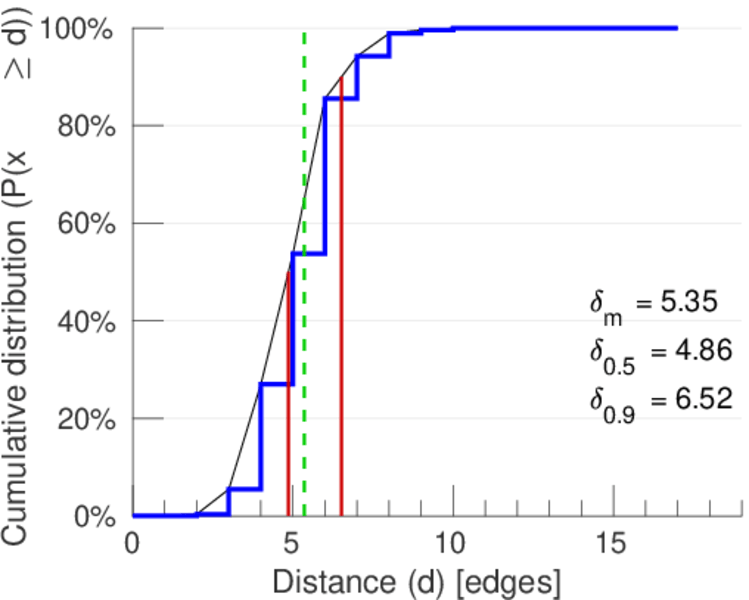
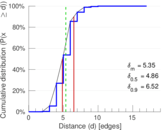
| Diameter | δ = | 22
|
| 50-Percentile effective diameter | δ0.5 = | 4.860 62
|
| 90-Percentile effective diameter | δ0.9 = | 6.516 22
|
| Median distance | δM = | 5
|
| Mean distance | δm = | 5.353 42
|
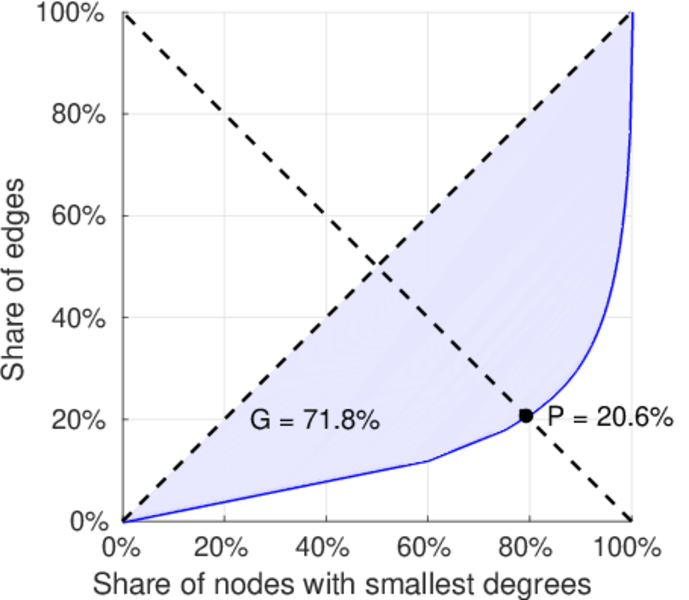
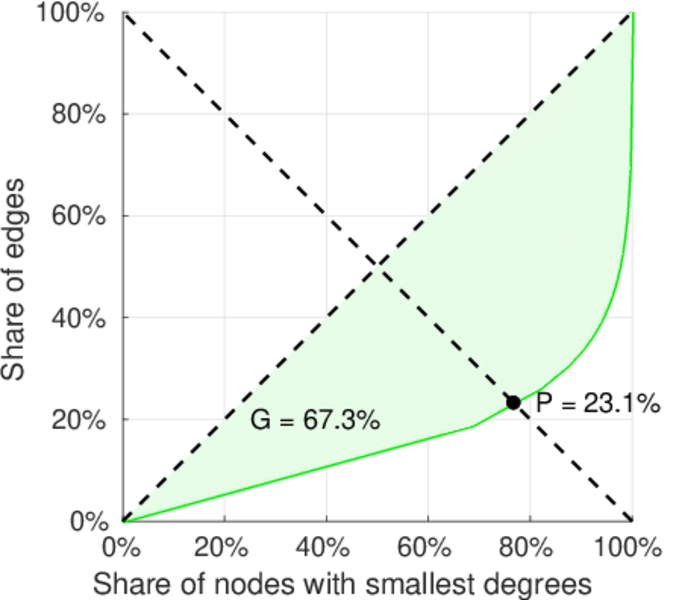
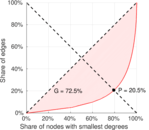
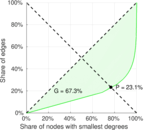
| Gini coefficient | G = | 0.744 516
|
| Balanced inequality ratio | P = | 0.199 248
|
| Left balanced inequality ratio | P1 = | 0.205 260
|
| Right balanced inequality ratio | P2 = | 0.231 457
|
| Relative edge distribution entropy | Her = | 0.873 618
|
| Power law exponent | γ = | 2.612 40
|
| Tail power law exponent | γt = | 1.951 00
|
| Tail power law exponent with p | γ3 = | 1.951 00
|
| p-value | p = | 0.000 00
|
| Left tail power law exponent with p | γ3,1 = | 2.721 00
|
| Left p-value | p1 = | 0.011 000 0
|
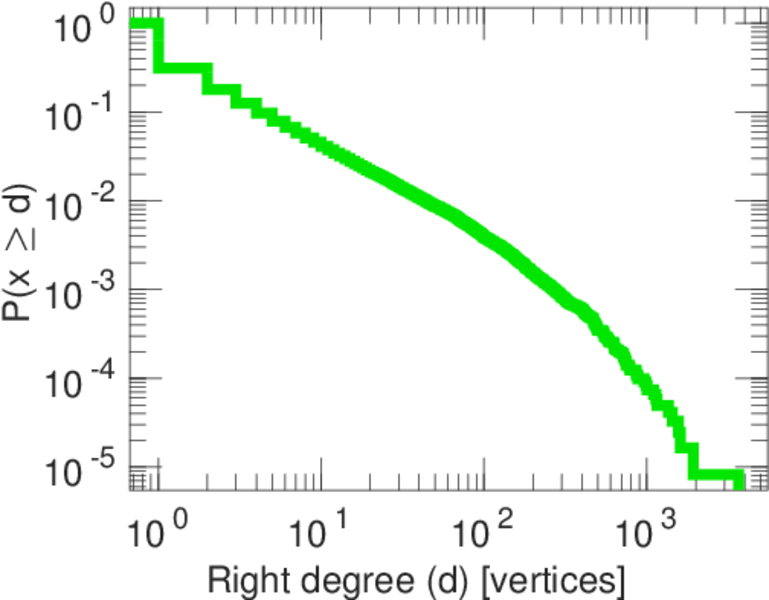
| Right tail power law exponent with p | γ3,2 = | 2.041 00
|
| Right p-value | p2 = | 0.001 000 00
|
| Degree assortativity | ρ = | −0.035 776 7
|
| Degree assortativity p-value | pρ = | 1.223 26 × 10−124
|
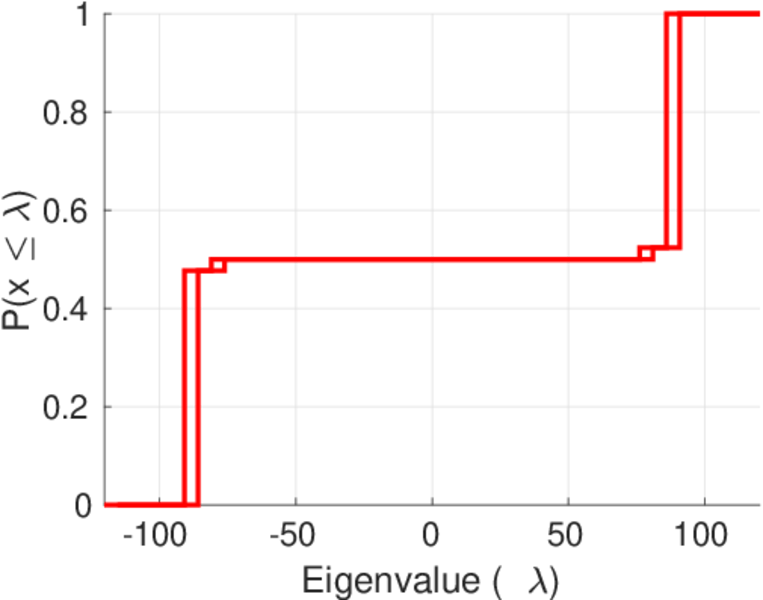
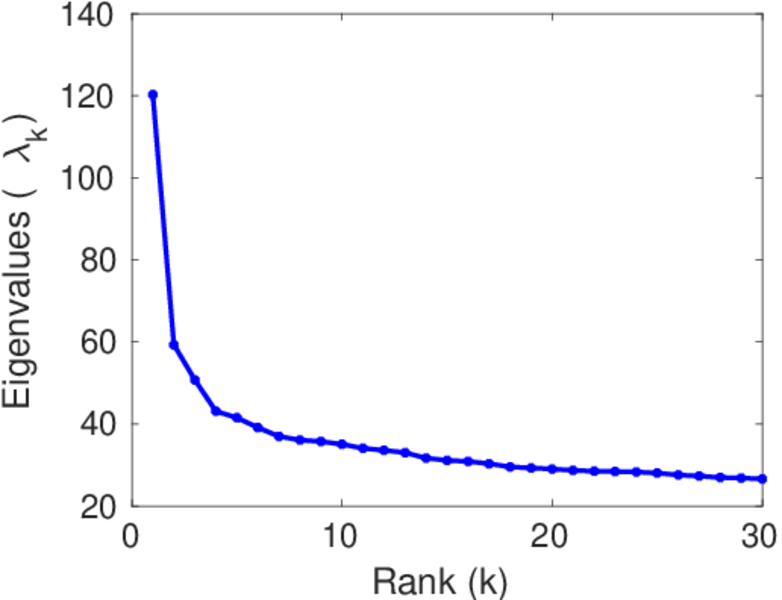
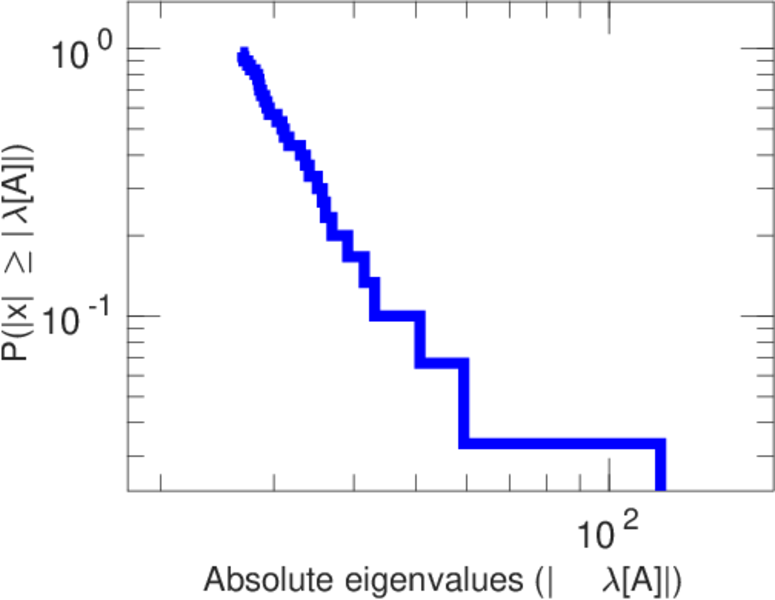
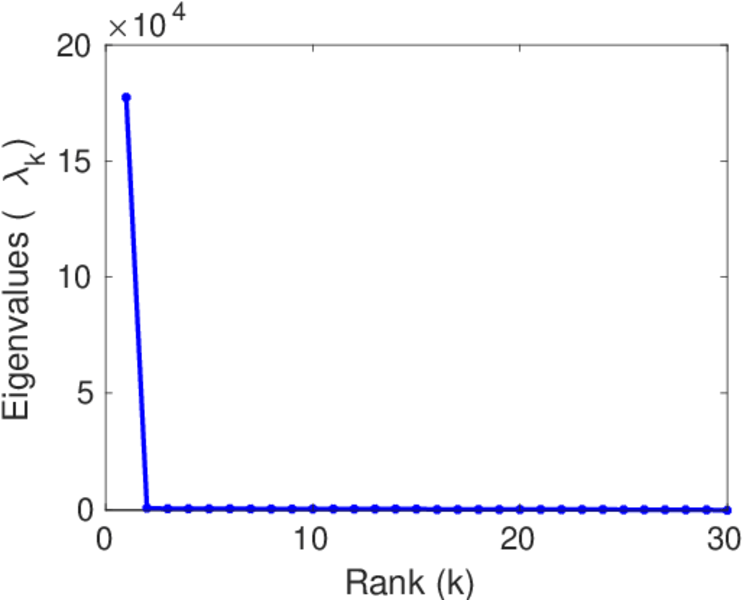
| Spectral norm | α = | 120.273
|
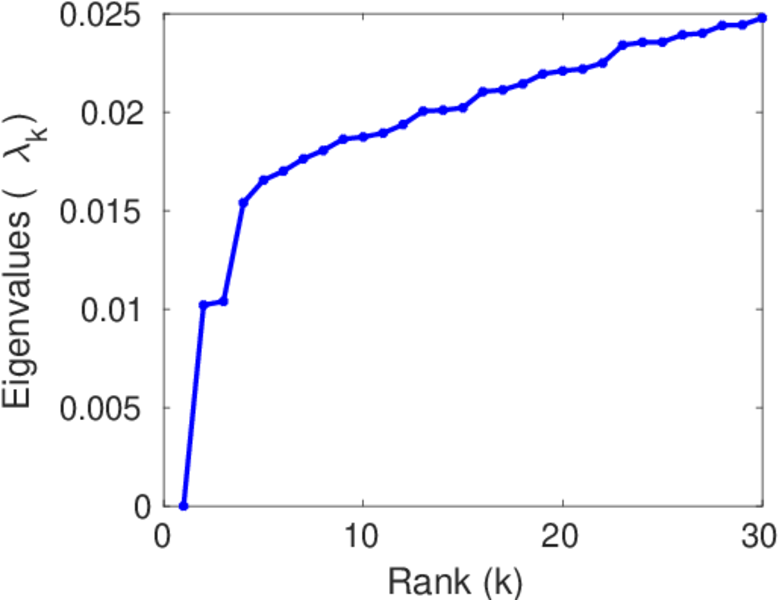
| Algebraic connectivity | a = | 0.010 203 8
|
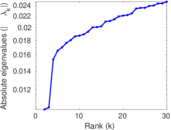
| Spectral separation | |λ1[A] / λ2[A]| = | 2.027 71
|
| Controllability | C = | 78,745
|
| Relative controllability | Cr = | 0.443 919
|
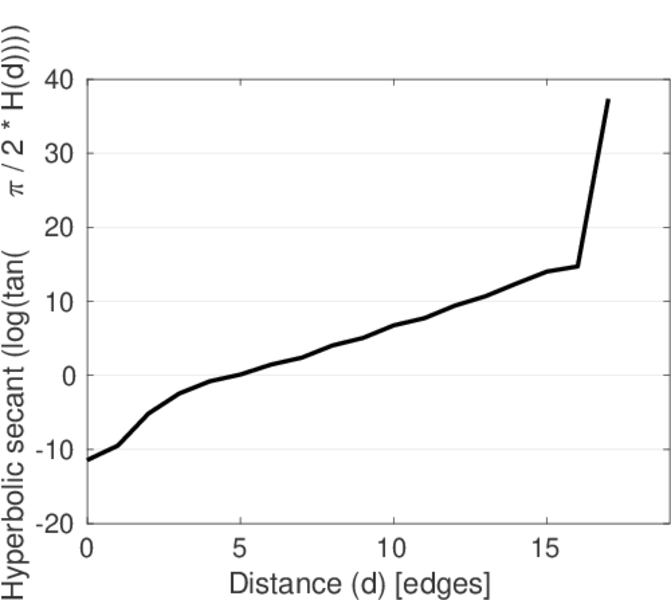
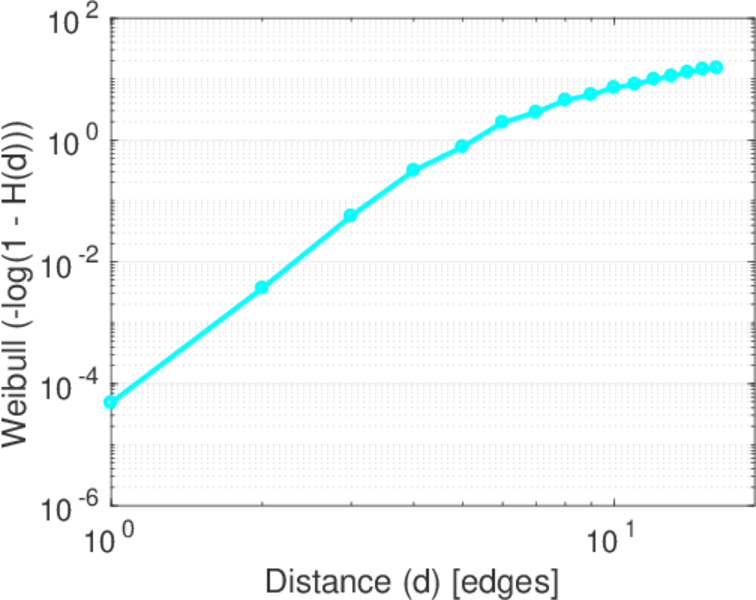
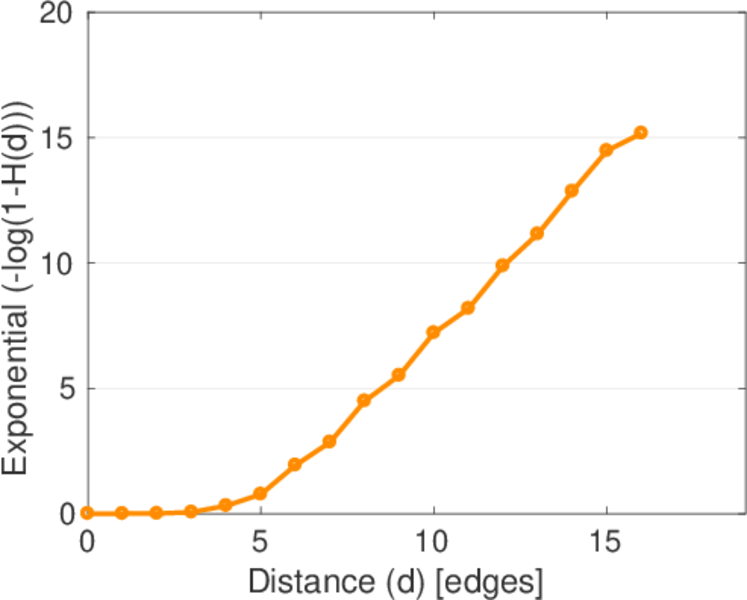
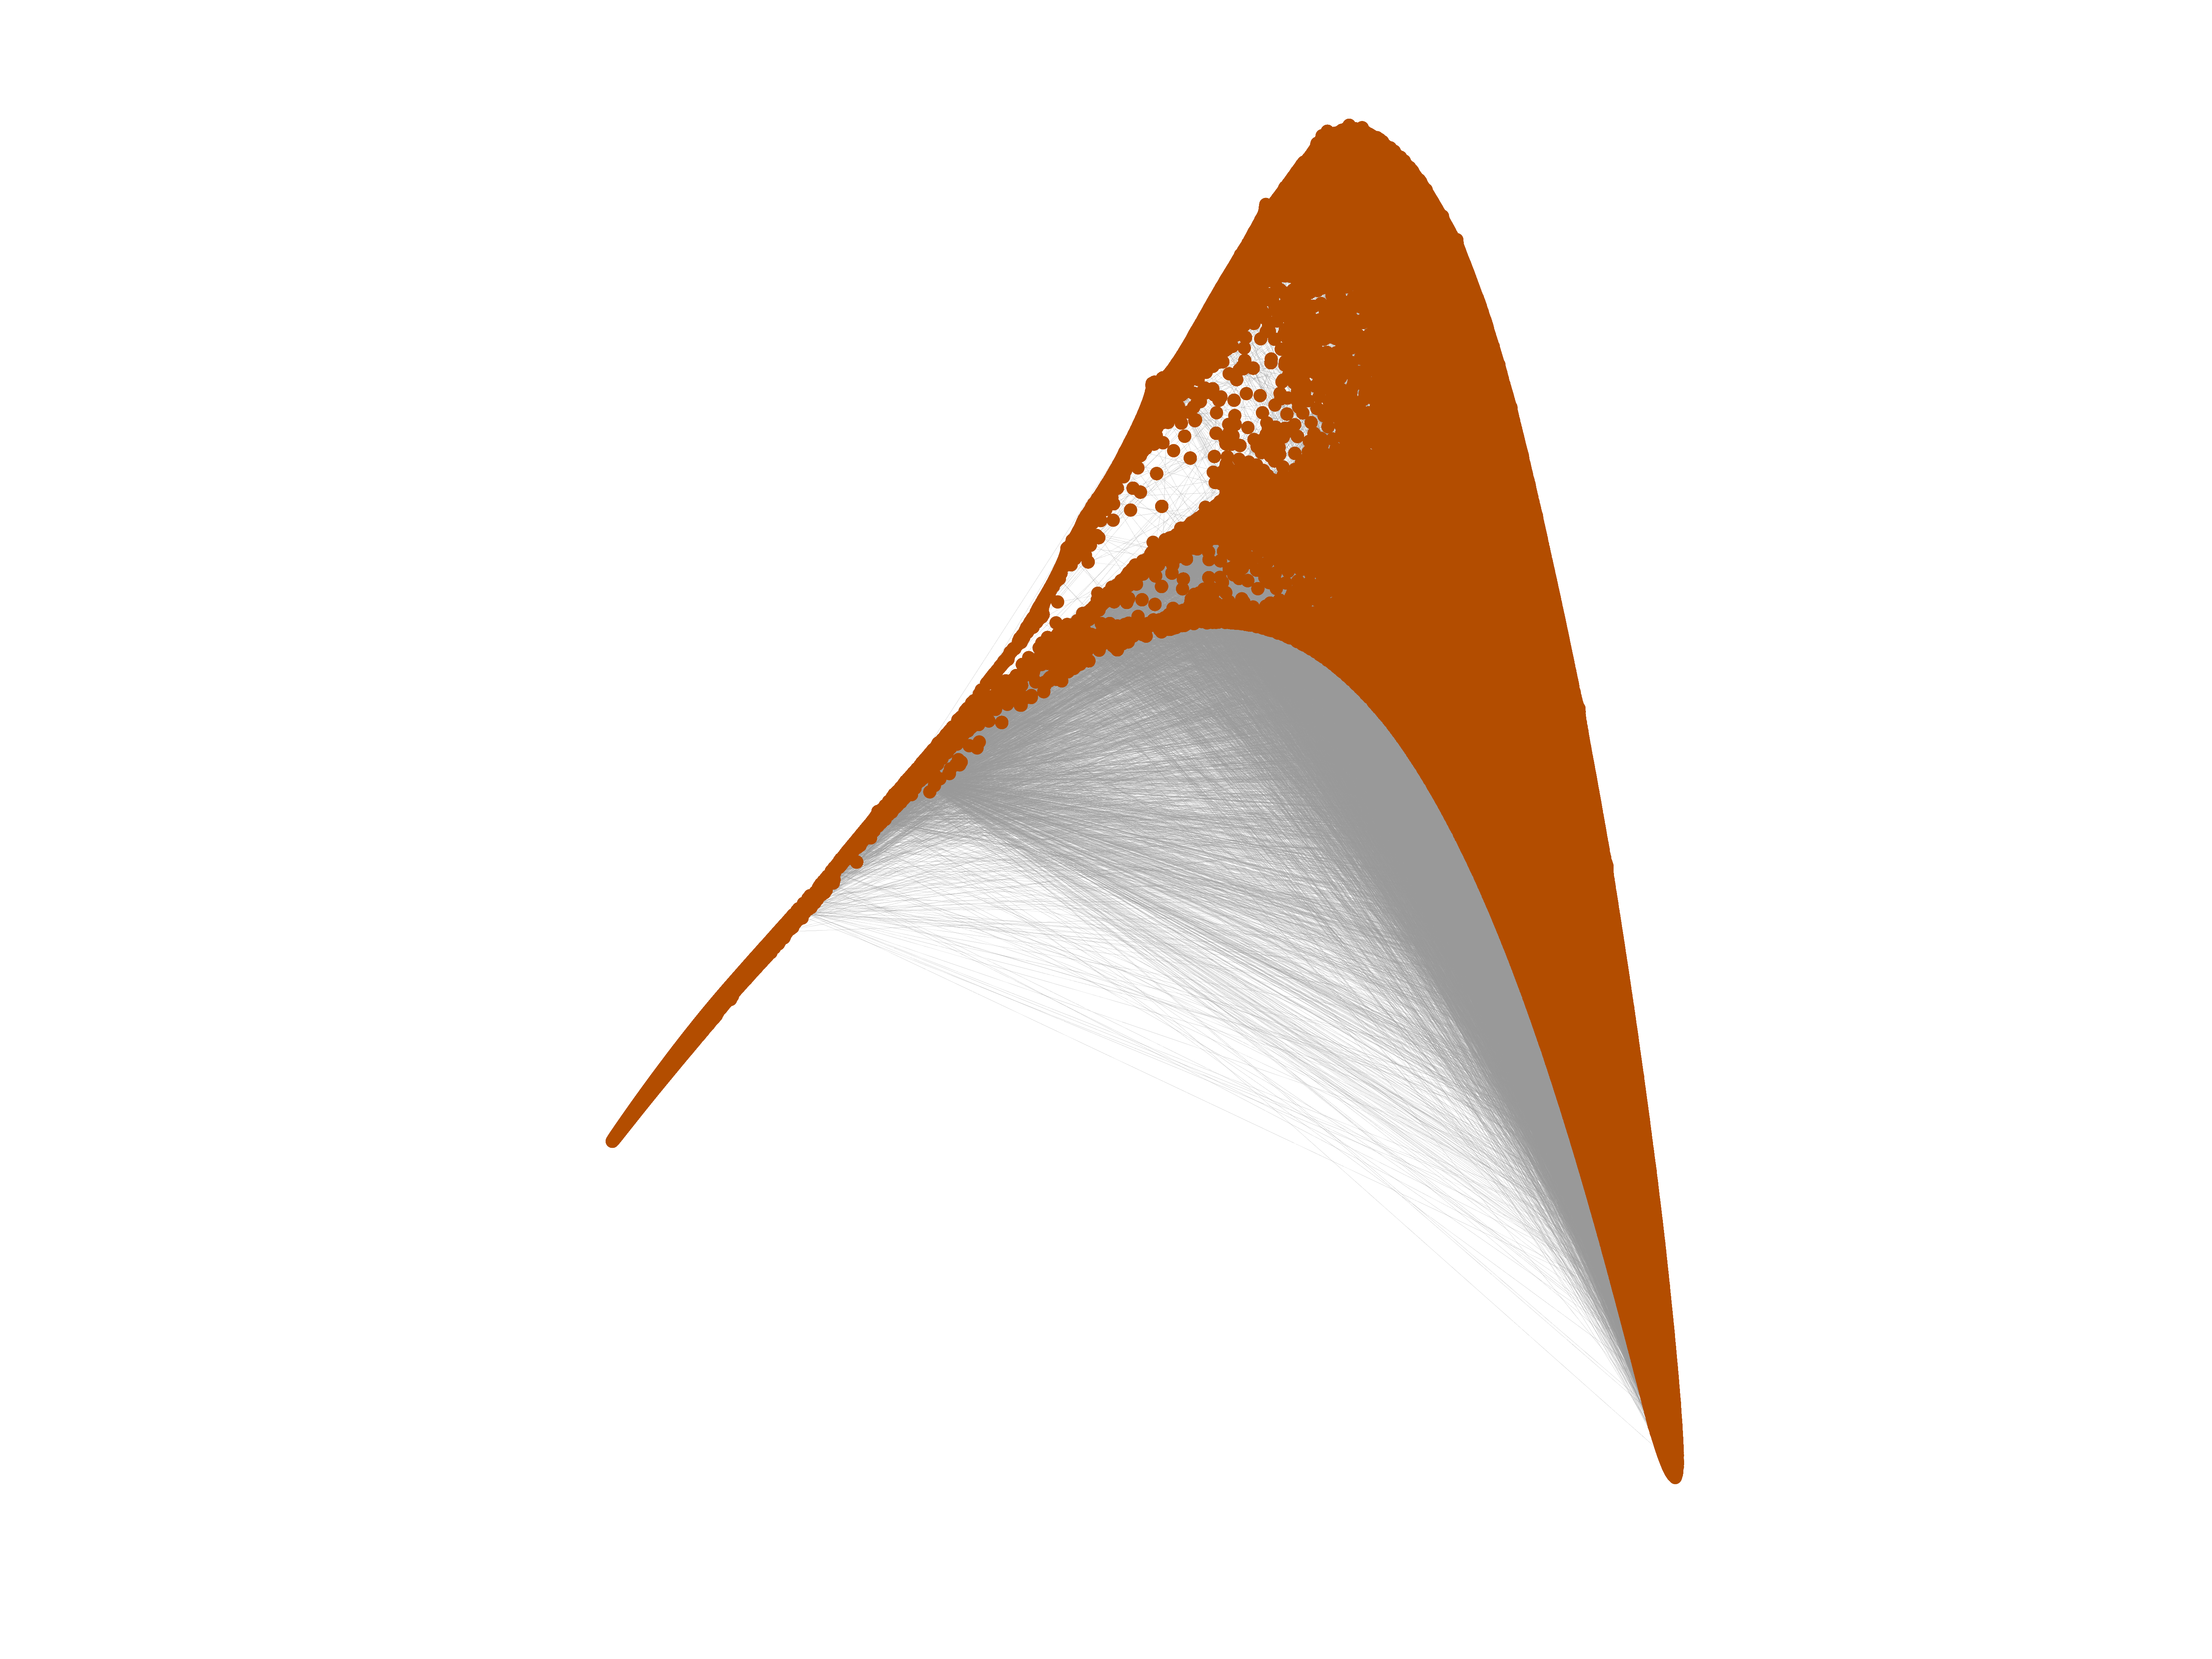
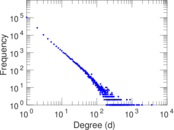
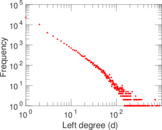
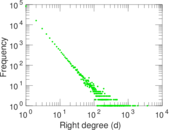
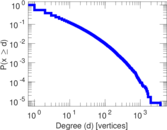
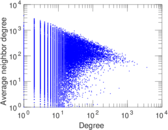
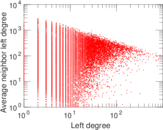
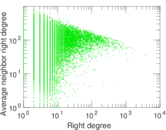
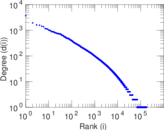
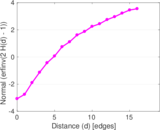
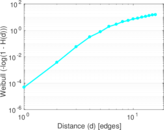
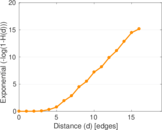
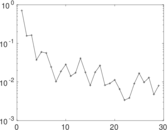
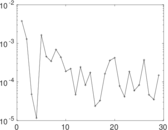
Plots


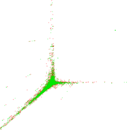
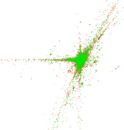


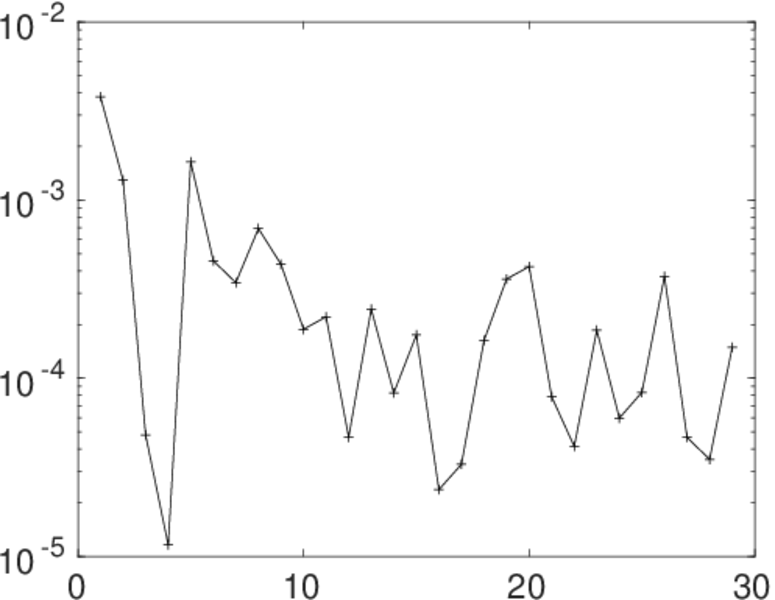
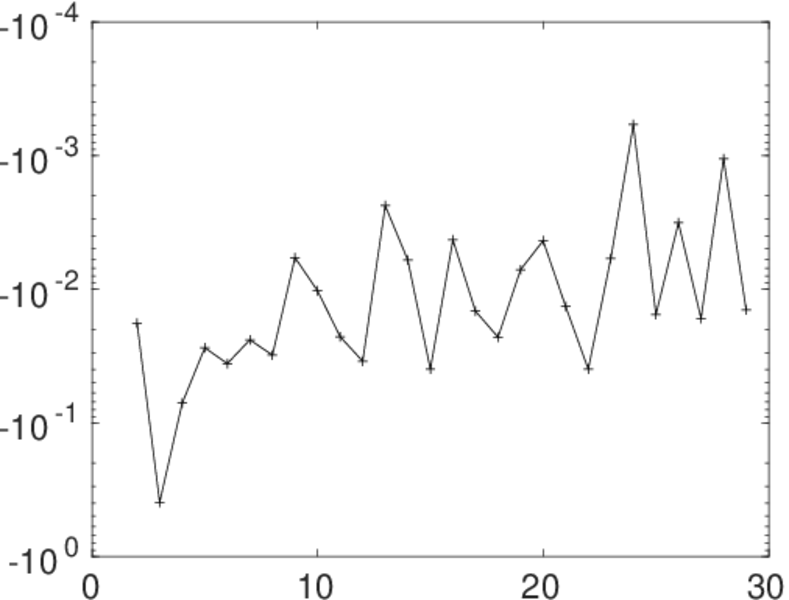
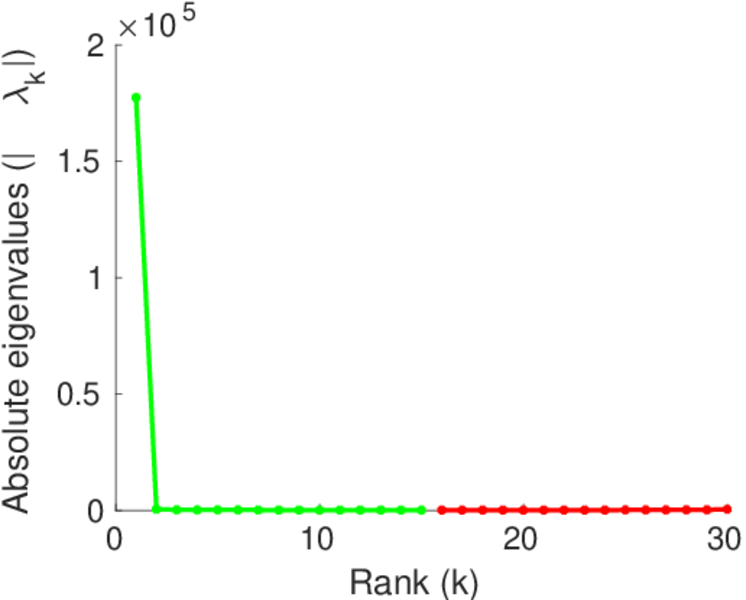
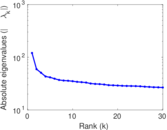
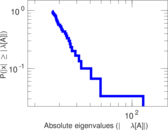
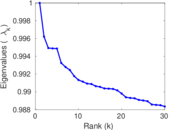
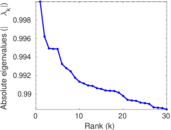
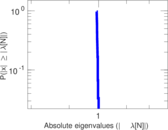
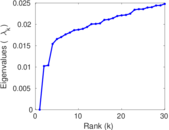
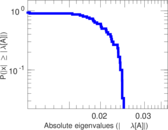
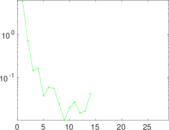
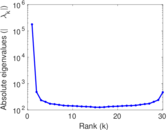
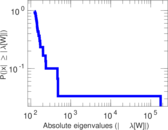
Matrix decompositions plots


Downloads
References
 KONECT ‣ Networks ‣
Buy Me a Coffee
KONECT ‣ Networks ‣
Buy Me a Coffee