HIV

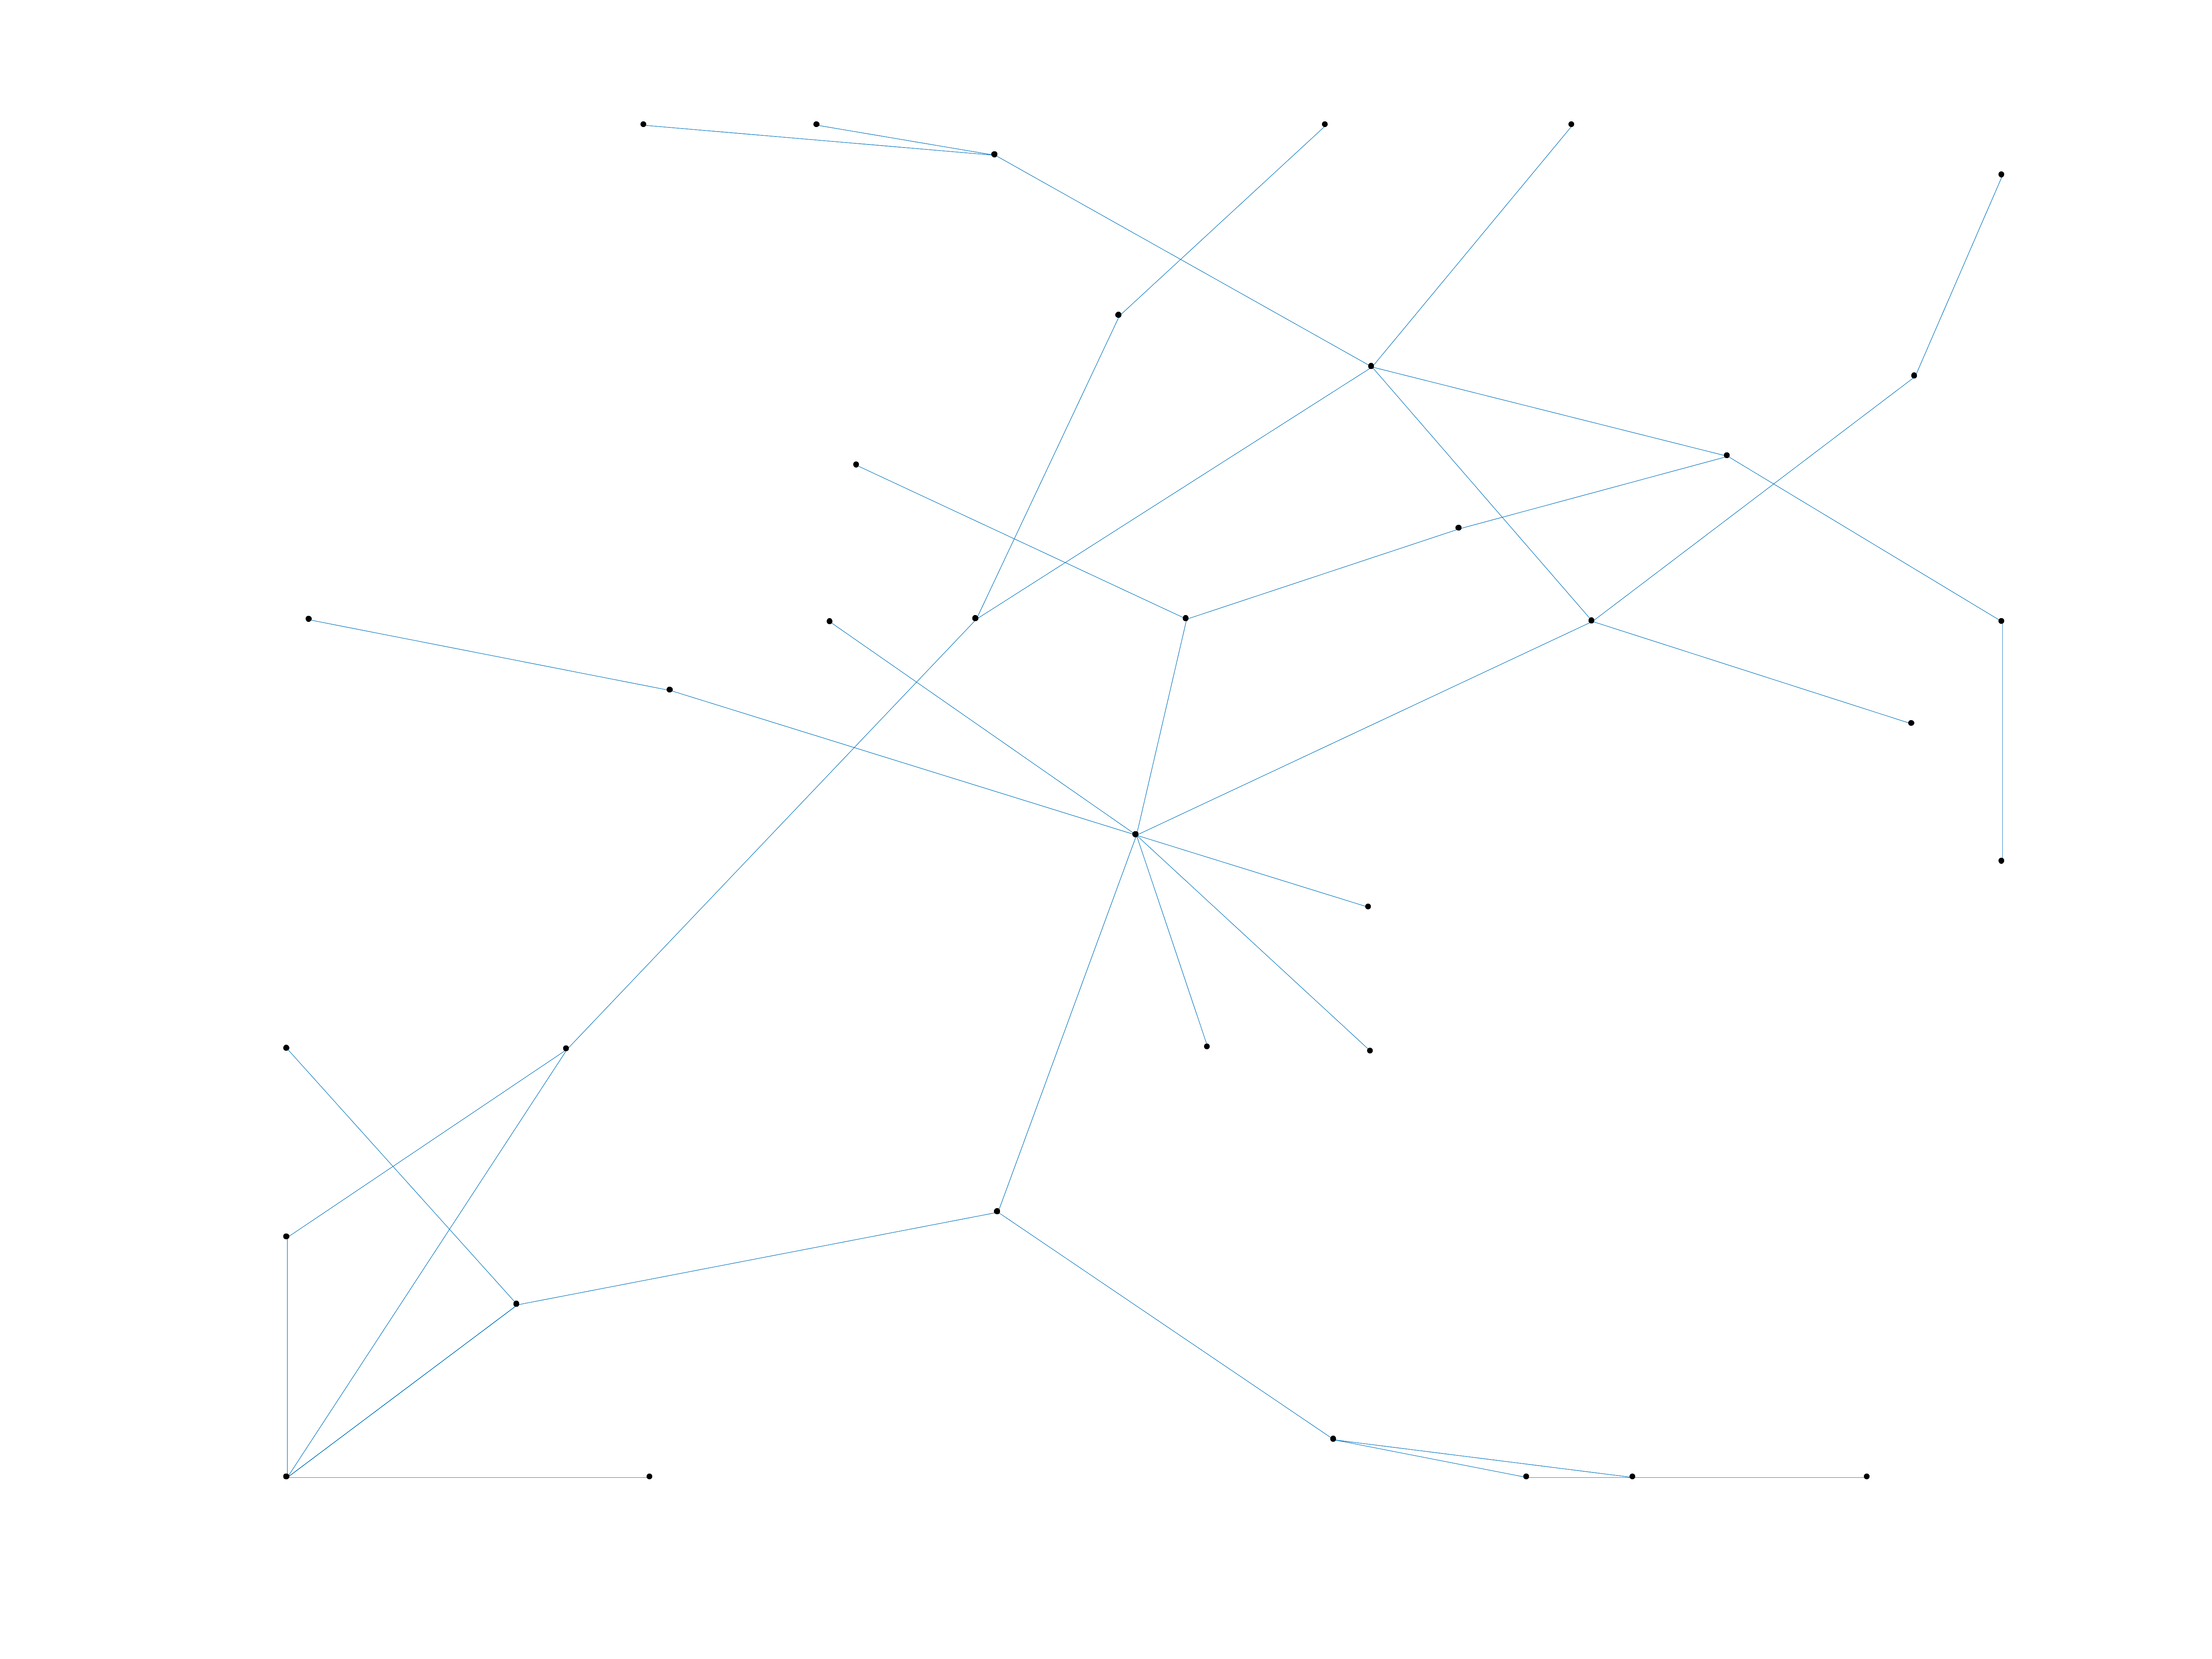
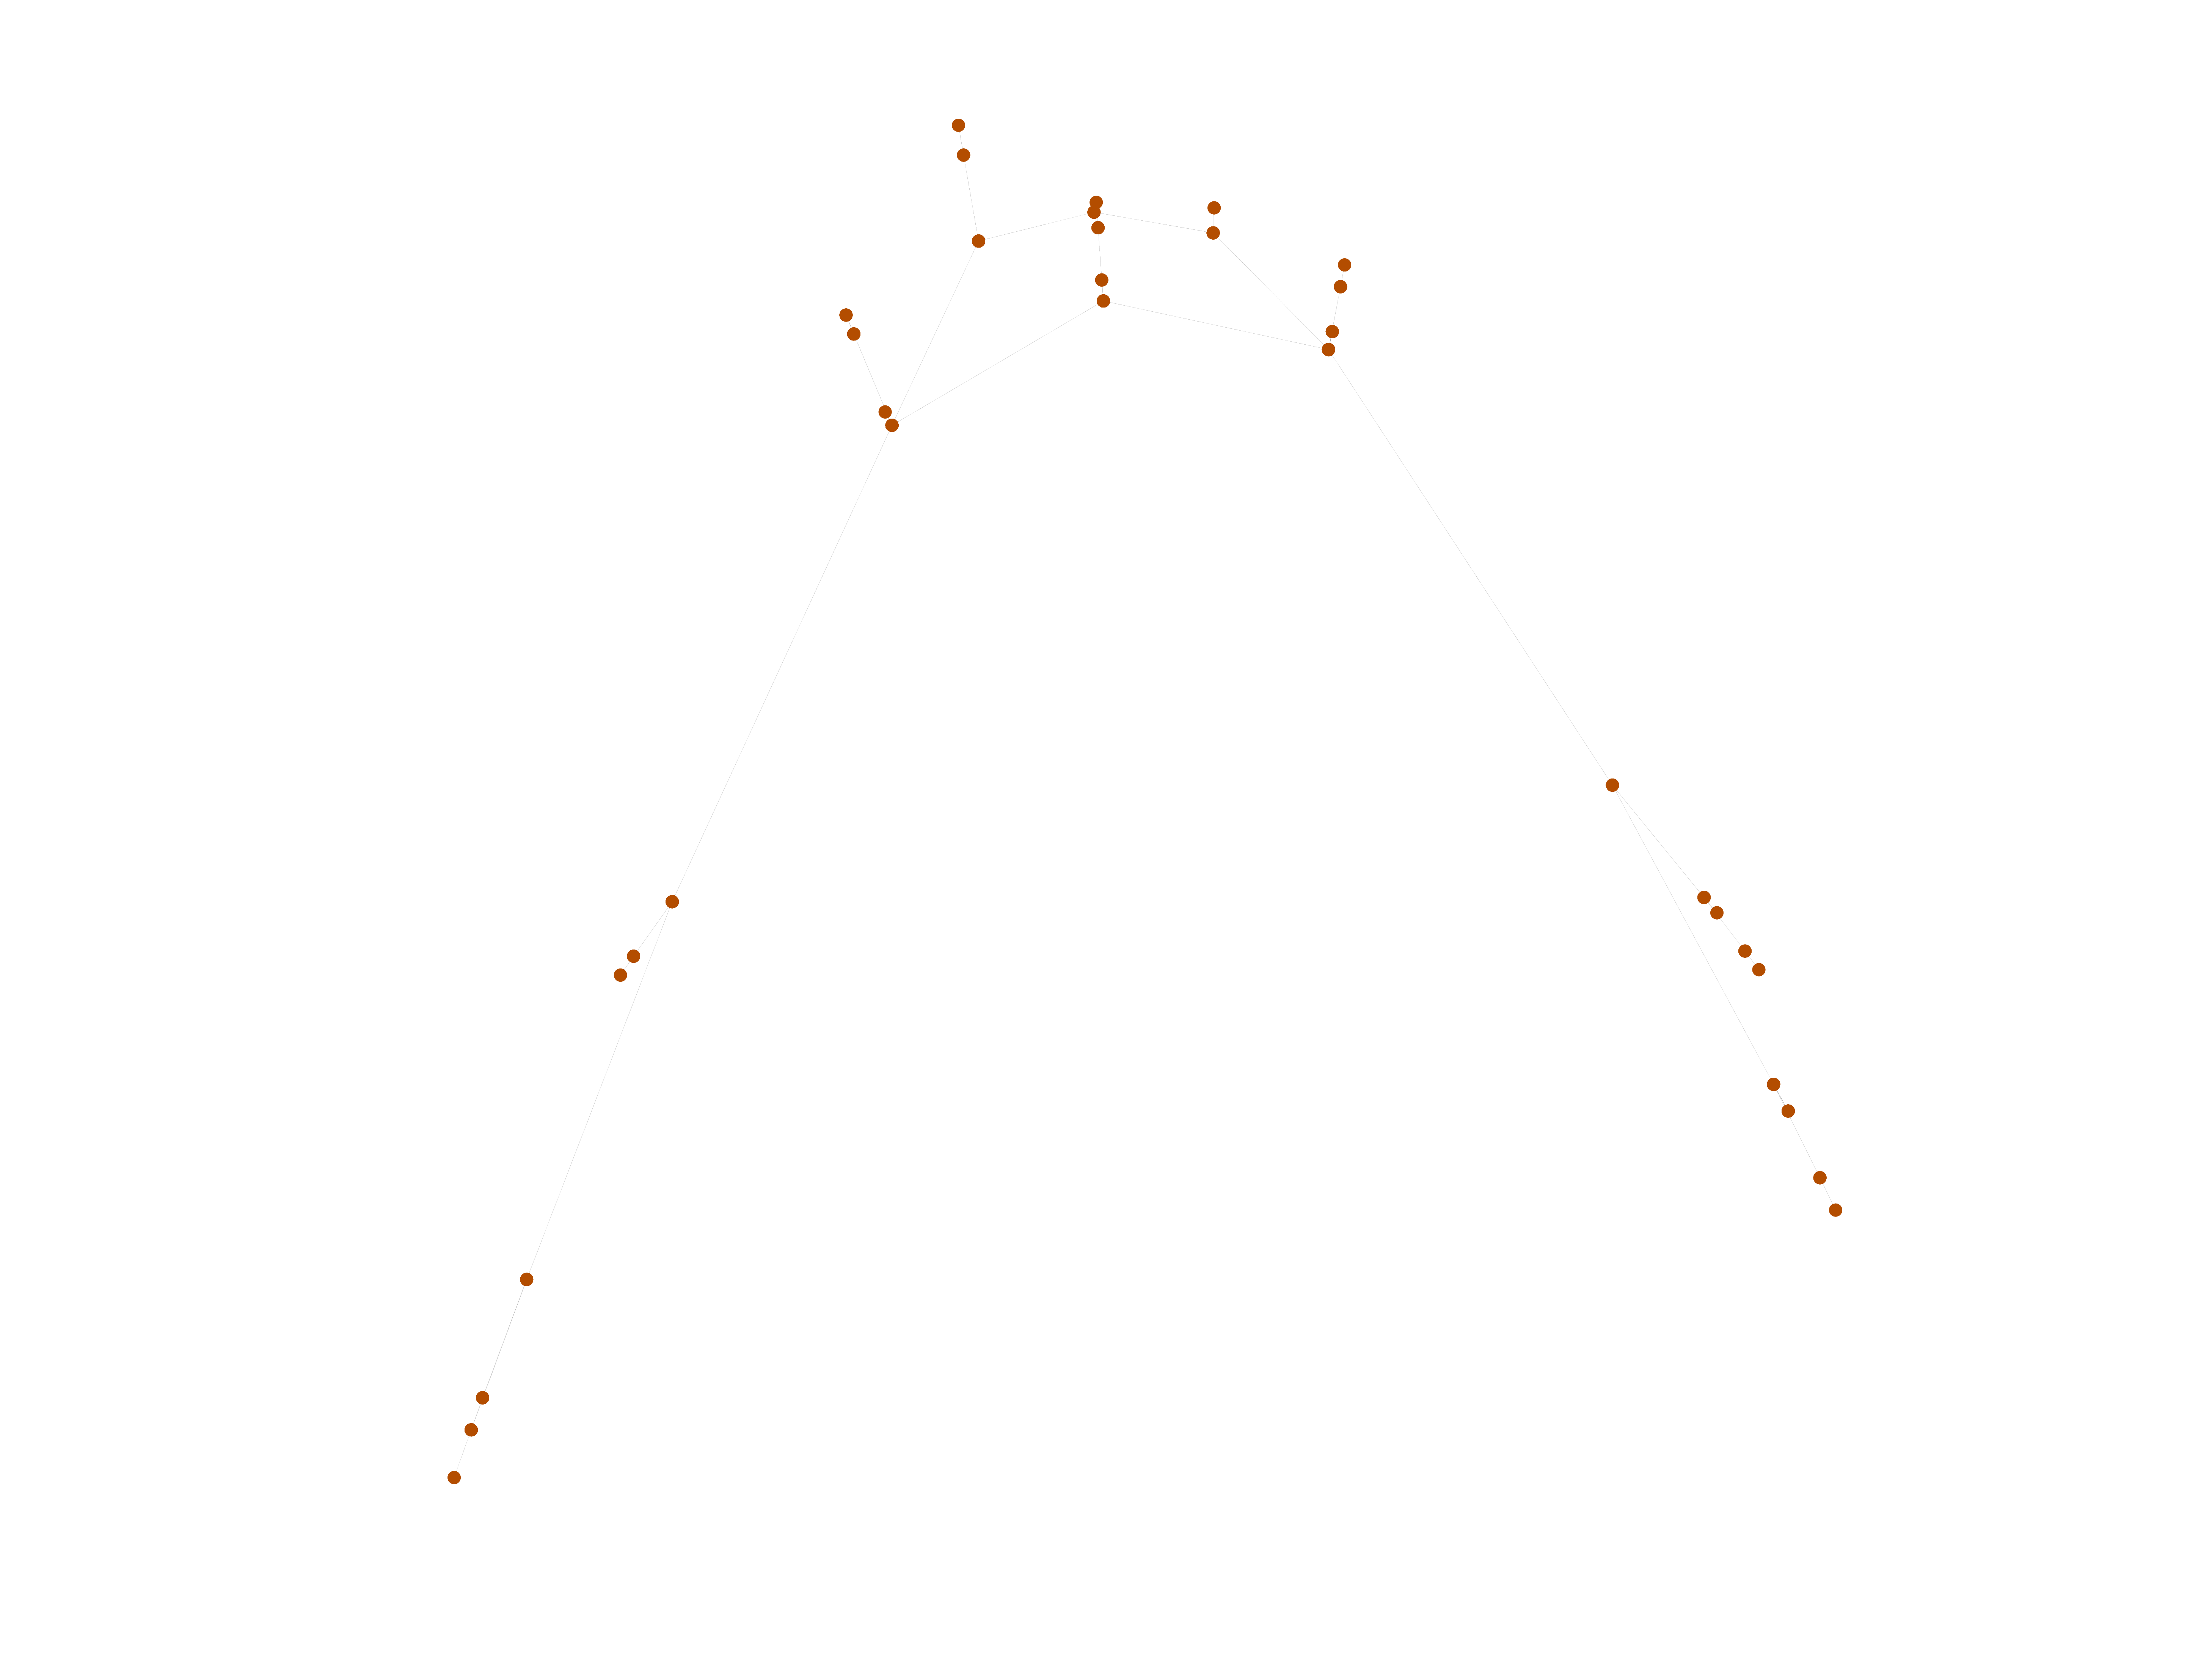
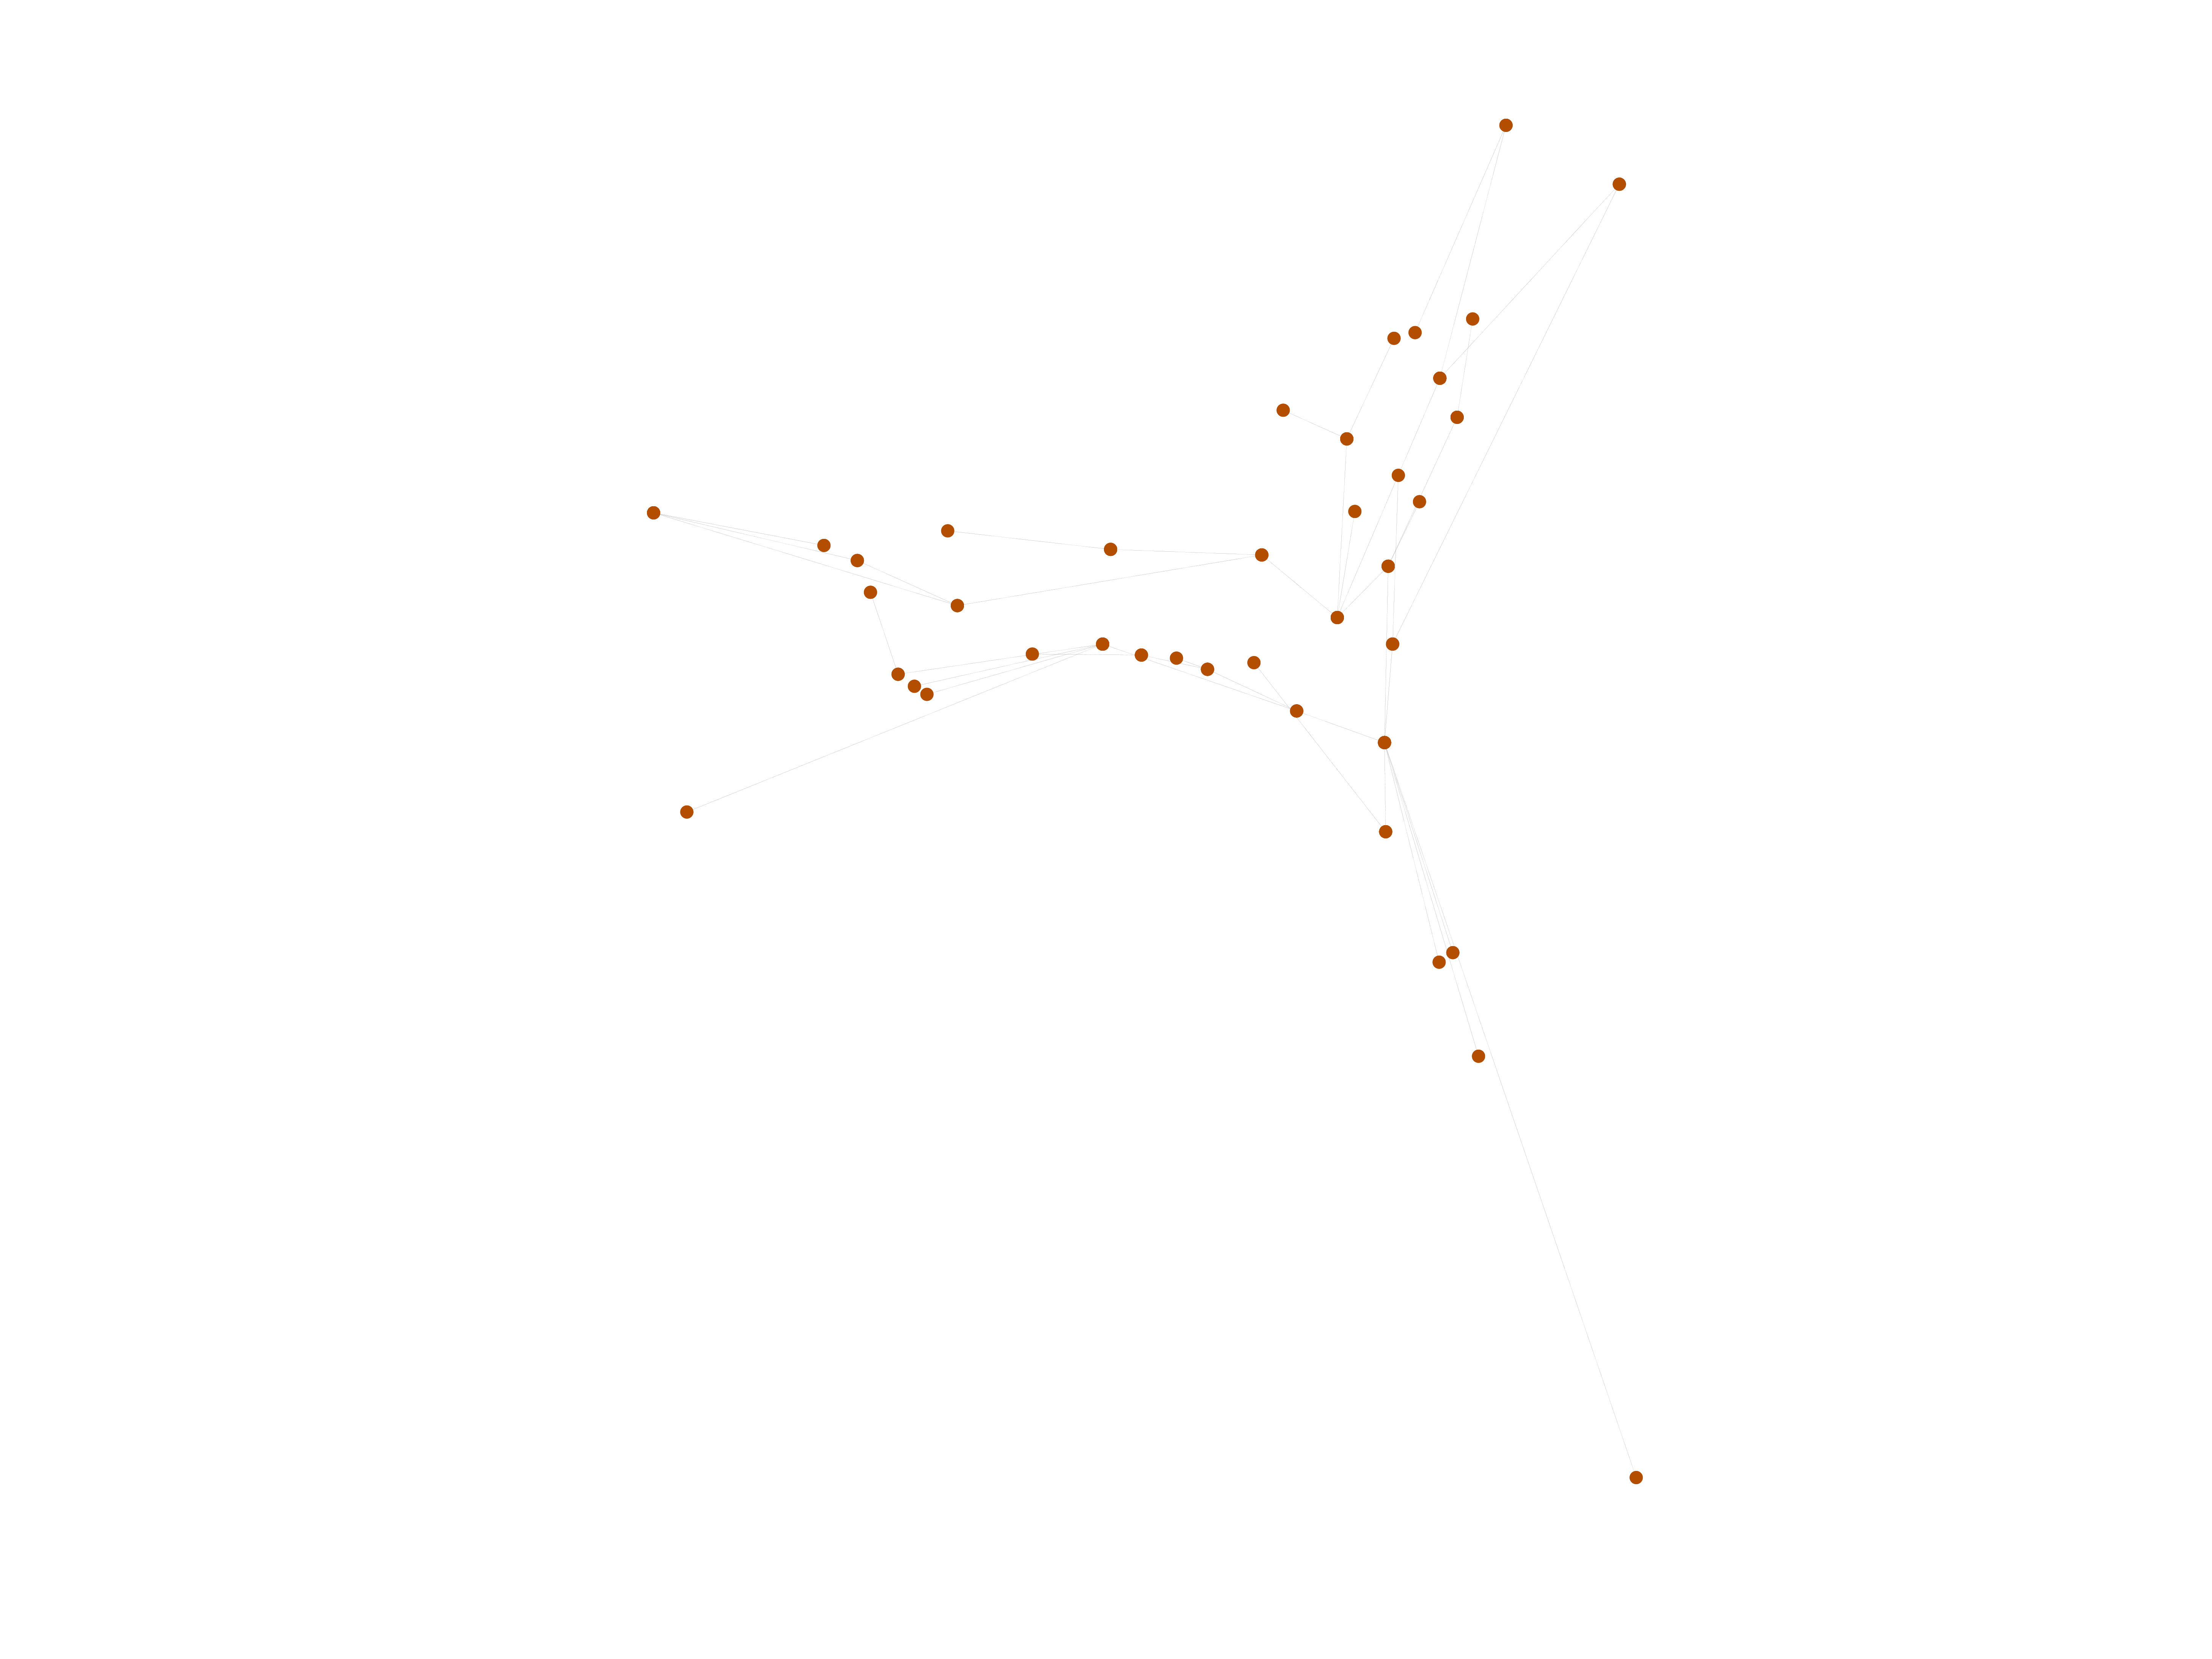
This is a network of sexual contacts between people involved in the early spread of the human immunodeficiency virus (HIV), in the United States of America (USA). This network is the origin of the phrase "patient zero," referring a person from which an infection spreads initially. Edges are undirected.

Metadata

CodeHI
Internal namehiv
NameHIV
AvailabilityDataset is available for download
Consistency checkDataset passed all tests
Category
Human contact network
Dataset timestamp 1984
Node meaningAIDS patient
Edge meaningSexual contact
Network formatUnipartite, undirected
Edge typeUnweighted, no multiple edges
LoopsDoes not contain loops
Snapshot Is a snapshot and likely to not contain all data
Connectedness Only the largest connected component of the original data is included

Statistics

Size n =40
Volume m =41
Loop count l =0
Wedge count s =86
Claw count z =88
Cross count x =81
Triangle count t =1
Square count q =0
4-Tour count T4 =426
Maximum degree dmax =8
Average degree d =2.050 00
Fill p =0.052 564 1
Size of LCC N =40
Diameter δ =10
50-Percentile effective diameter δ0.5 =4.155 59
90-Percentile effective diameter δ0.9 =6.898 47
Median distance δM =5
Mean distance δm =4.664 78
Gini coefficient G =0.337 805
Balanced inequality ratio P =0.365 854
Relative edge distribution entropy Her =0.944 232
Power law exponent γ =2.903 07
Tail power law exponent γt =4.011 00
Tail power law exponent with p γ3 =4.011 00
p-value p =0.440 000
Degree assortativity ρ =−0.279 408
Degree assortativity p-value pρ =0.011 017 4
Clustering coefficient c =0.034 883 7
Spectral norm α =3.117 43
Algebraic connectivity a =0.046 109 3
Spectral separation 1[A] / λ2[A]| =1.000 32
Non-bipartivity bA =0.000 324 537
Normalized non-bipartivity bN =0.004 033 53
Algebraic non-bipartivity χ =0.008 041 22
Spectral bipartite frustration bK =0.000 980 636
Controllability C =8
Relative controllability Cr =0.200 000

Plots

Fruchterman–Reingold graph drawing

Degree distribution

Cumulative degree distribution

Lorenz curve

Spectral distribution of the adjacency matrix

Spectral distribution of the normalized adjacency matrix

Spectral distribution of the Laplacian

Spectral graph drawing based on the adjacency matrix

Spectral graph drawing based on the Laplacian

Spectral graph drawing based on the normalized adjacency matrix

Degree assortativity

Zipf plot

Hop distribution

Double Laplacian graph drawing

Delaunay graph drawing

Clustering coefficient distribution

Average neighbor degree distribution

SynGraphy

Matrix decompositions plots

Downloads

References

[1] Jérôme Kunegis. KONECT – The Koblenz Network Collection. In Proc. Int. Conf. on World Wide Web Companion, pages 1343–1350, 2013. [ http ]
[2] David M. Auerbach, William W. Darrow, Harold W. Jaffe, and James W. Curran. Cluster of cases of the acquired immune deficiency syndrome: Patients linked by sexual contact. The Am. J. of Med., 76(3):487–492, 1984.