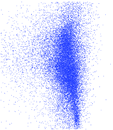
Hyves
This is the social network of Hyves, a Dutch online social network. The
network is undirected and unweighted.
Metadata
Statistics
| Size | n = | 1,402,673
|
| Volume | m = | 2,777,419
|
| Loop count | l = | 0
|
| Wedge count | s = | 1,447,128,030
|
| Claw count | z = | 10,748,028,522,268
|
| Cross count | x = | 73,480,895,626,790,352
|
| Triangle count | t = | 752,401
|
| Square count | q = | 47,825,228
|
| 4-Tour count | T4 = | 6,176,668,782
|
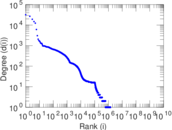
| Maximum degree | dmax = | 31,883
|
| Average degree | d = | 3.960 18
|
| Fill | p = | 2.823 31 × 10−6
|
| Size of LCC | N = | 1,402,673
|
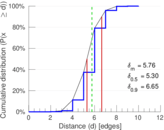
| Diameter | δ = | 10
|
| 50-Percentile effective diameter | δ0.5 = | 5.303 47
|
| 90-Percentile effective diameter | δ0.9 = | 6.649 47
|
| Median distance | δM = | 6
|
| Mean distance | δm = | 5.755 60
|
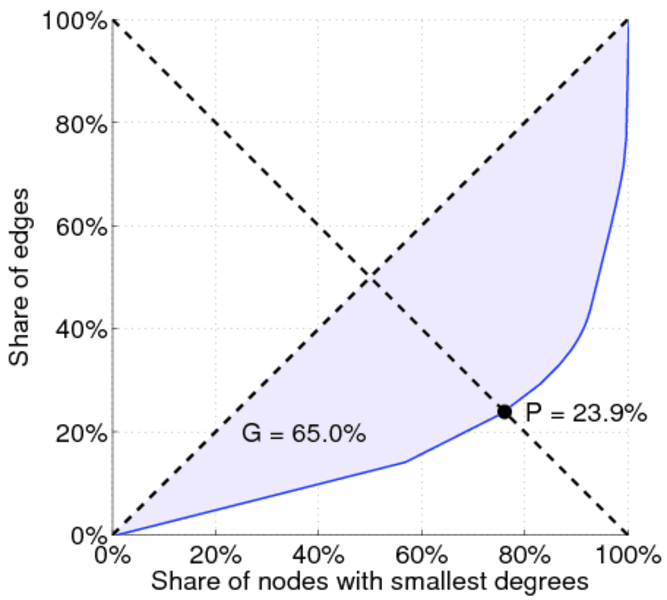
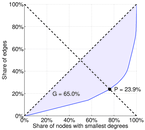
| Gini coefficient | G = | 0.650 239
|
| Balanced inequality ratio | P = | 0.238 800
|
| Relative edge distribution entropy | Her = | 0.905 995
|
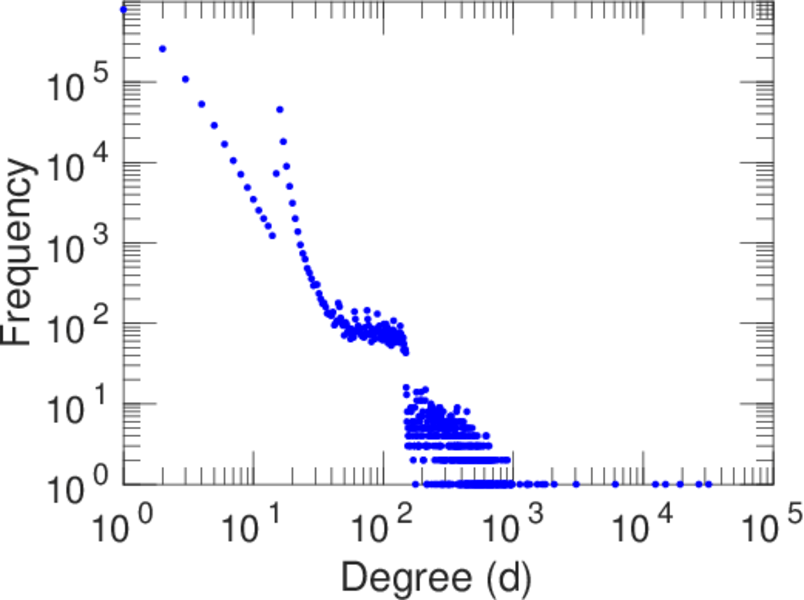
| Power law exponent | γ = | 2.658 00
|
| Tail power law exponent | γt = | 1.961 00
|
| Degree assortativity | ρ = | −0.023 415 2
|
| Degree assortativity p-value | pρ = | 0.000 00
|
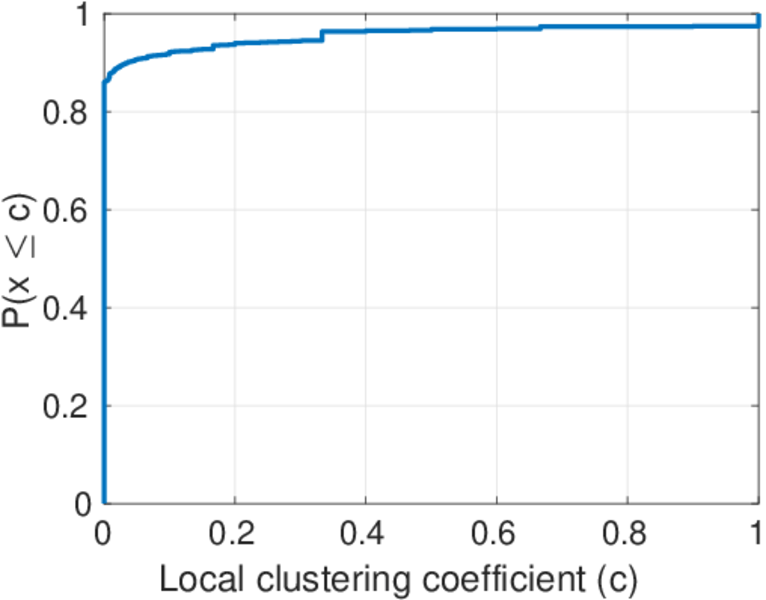
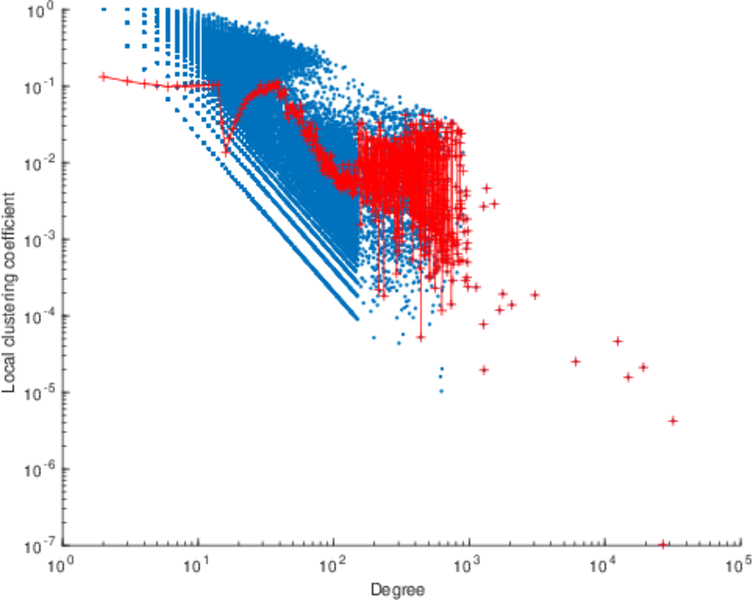
| Clustering coefficient | c = | 0.001 559 78
|
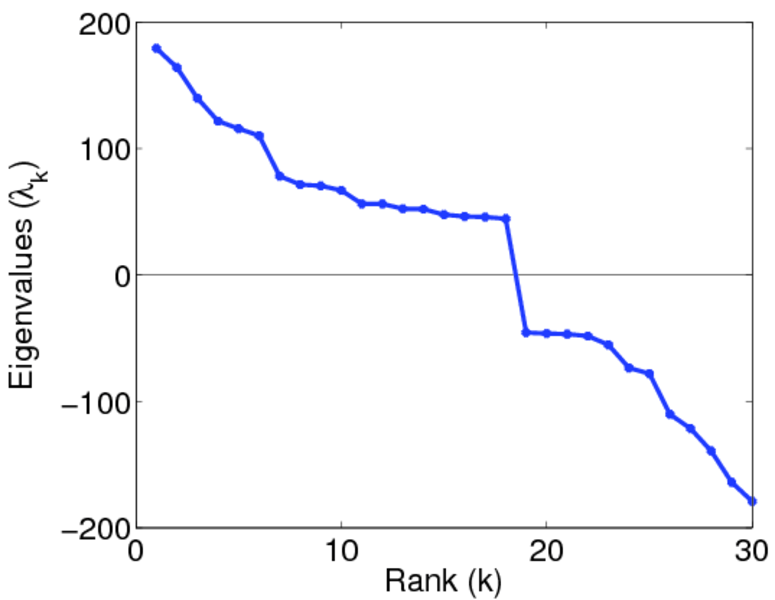
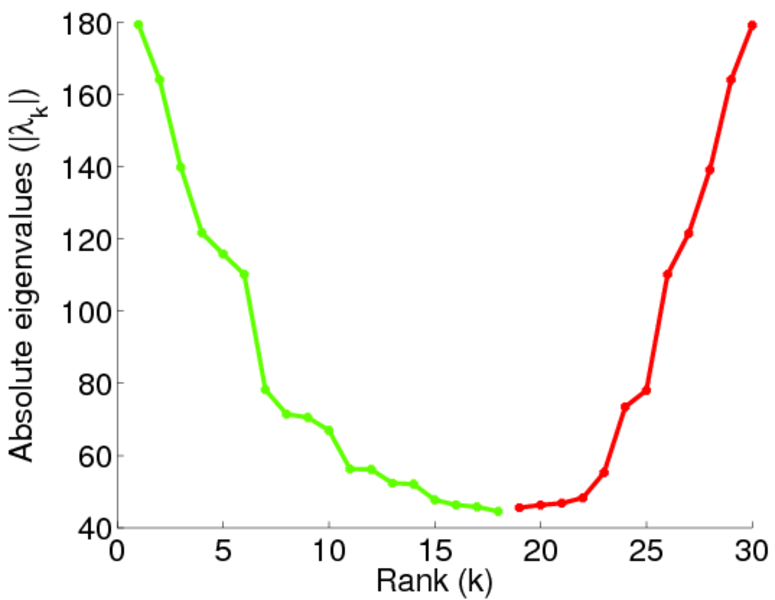
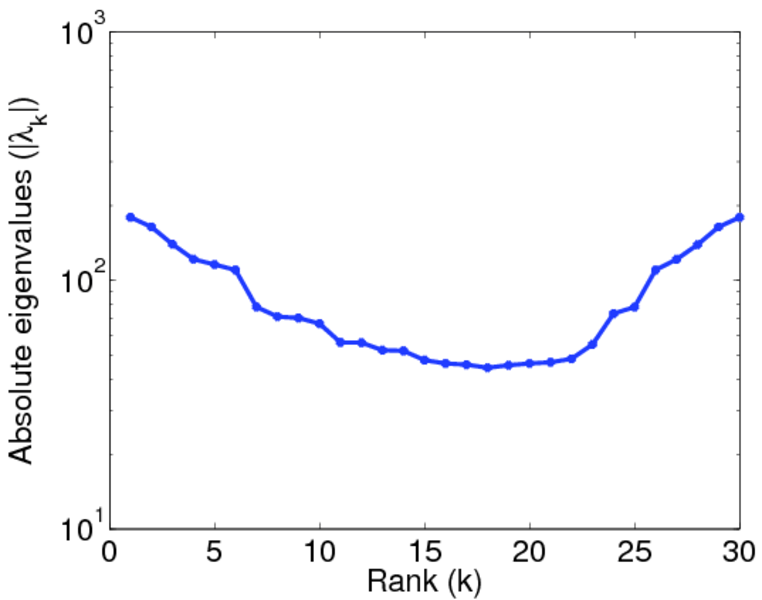
| Spectral norm | α = | 179.347
|
| Spectral separation | |λ1[A] / λ2[A]| = | 1.001 09
|
| Non-bipartivity | bA = | 0.001 090 33
|
| Normalized non-bipartivity | bN = | 0.020 659 5
|
| Algebraic non-bipartivity | χ = | 0.040 182 3
|
| Spectral bipartite frustration | bK = | 0.002 536 64
|
| Controllability | C = | 1,195,385
|
| Relative controllability | Cr = | 0.852 219
|
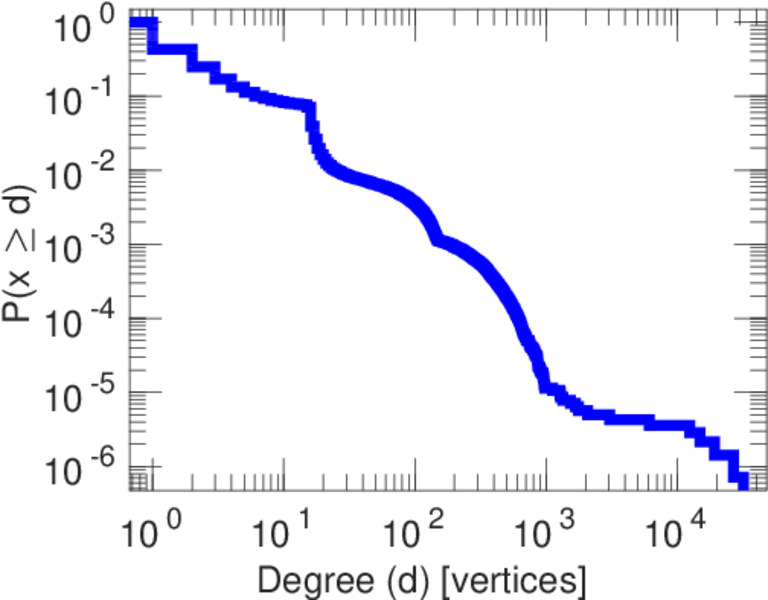
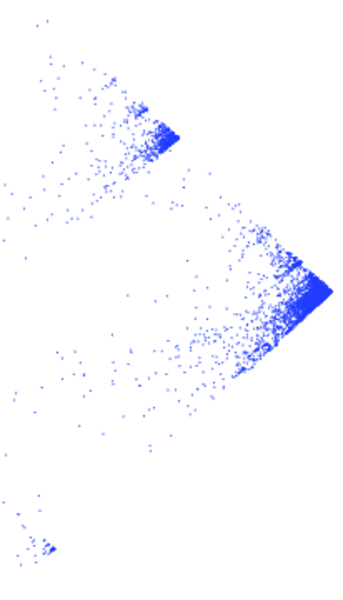
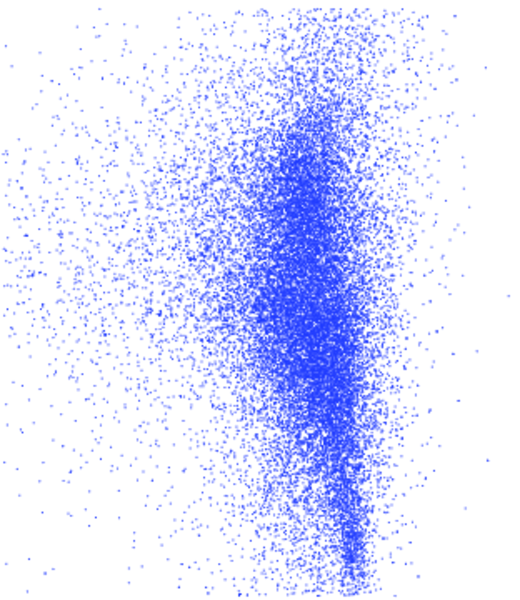
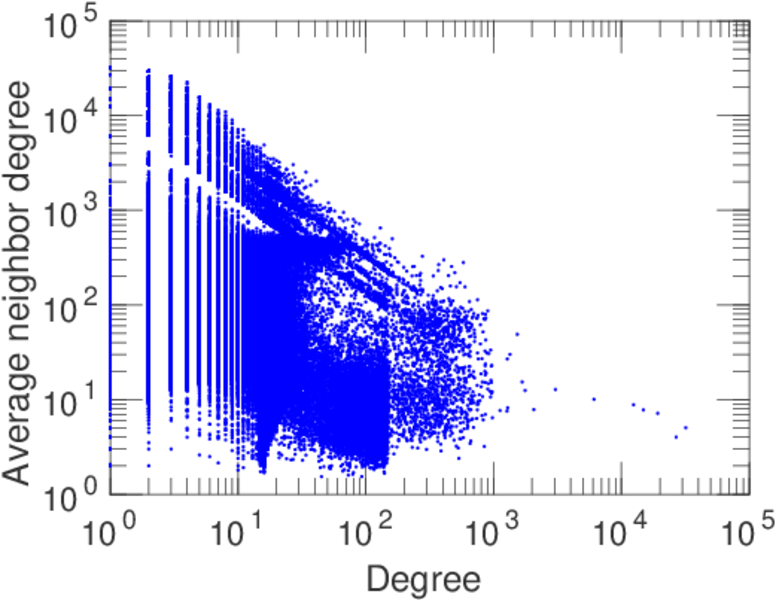
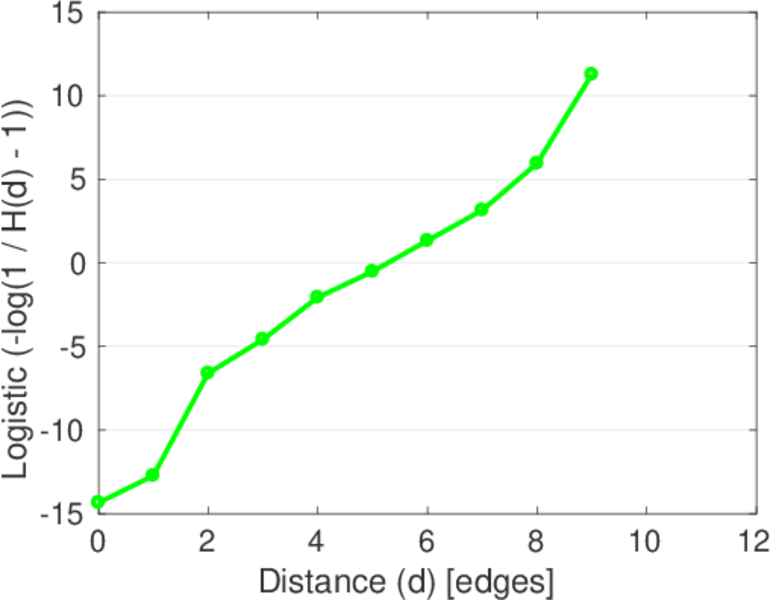
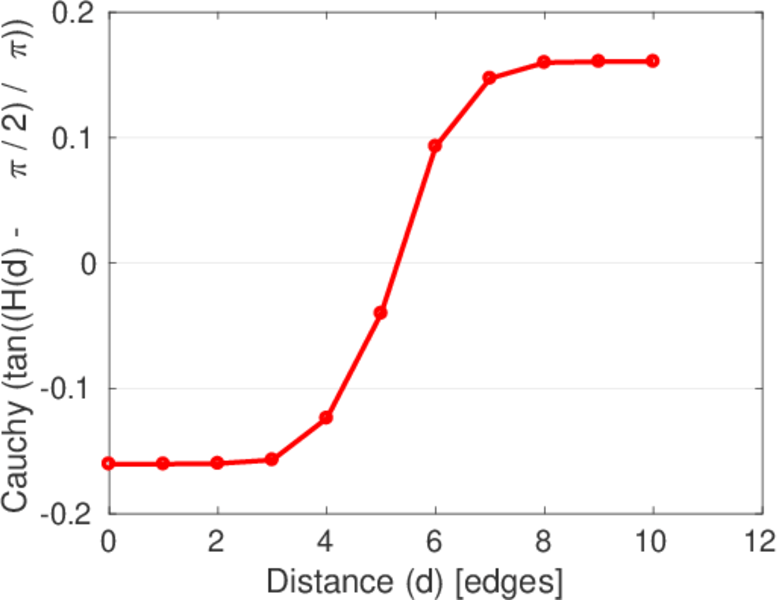
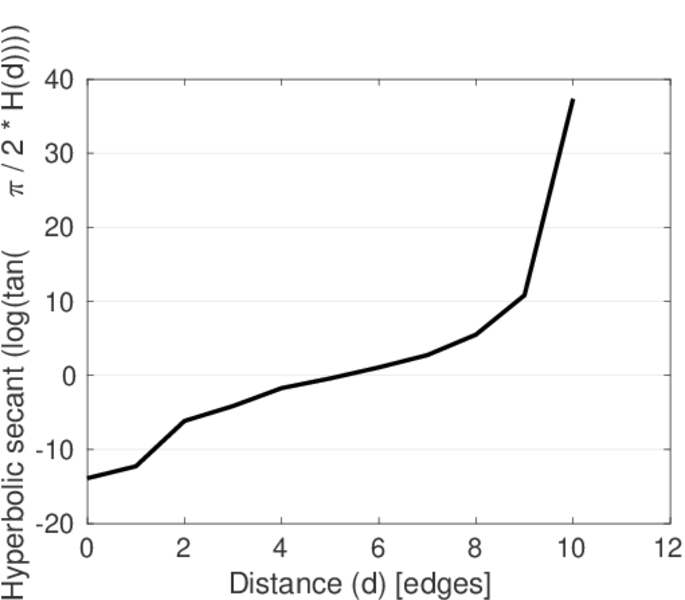
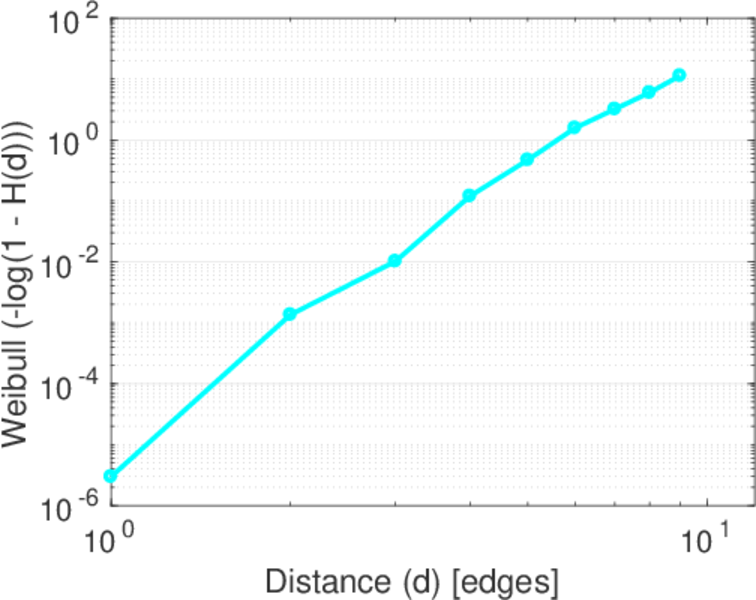
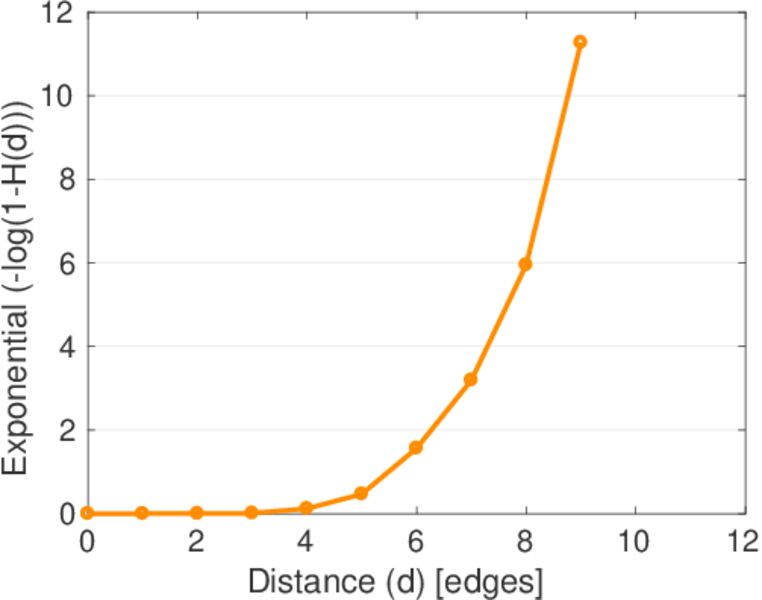
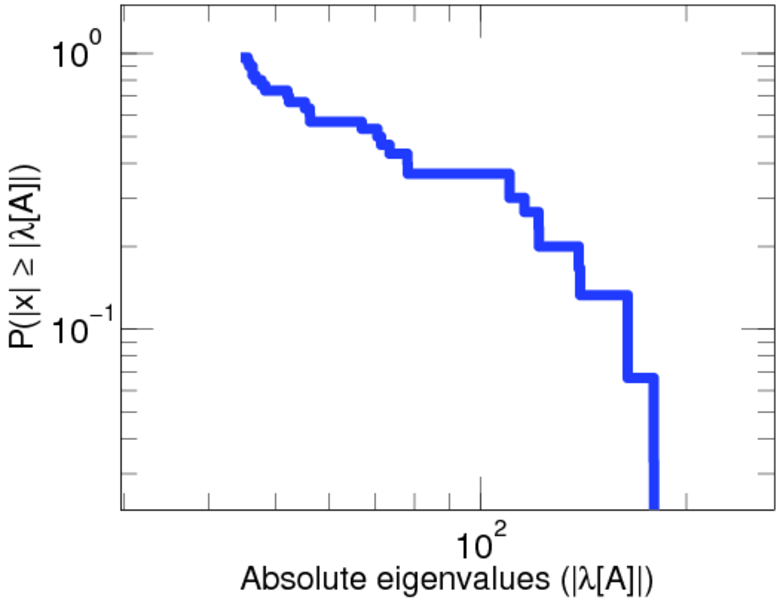
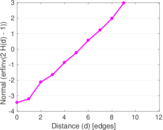
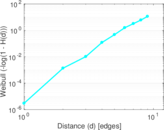
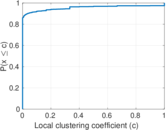
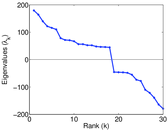
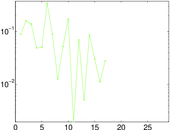
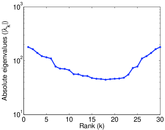
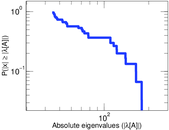
Plots


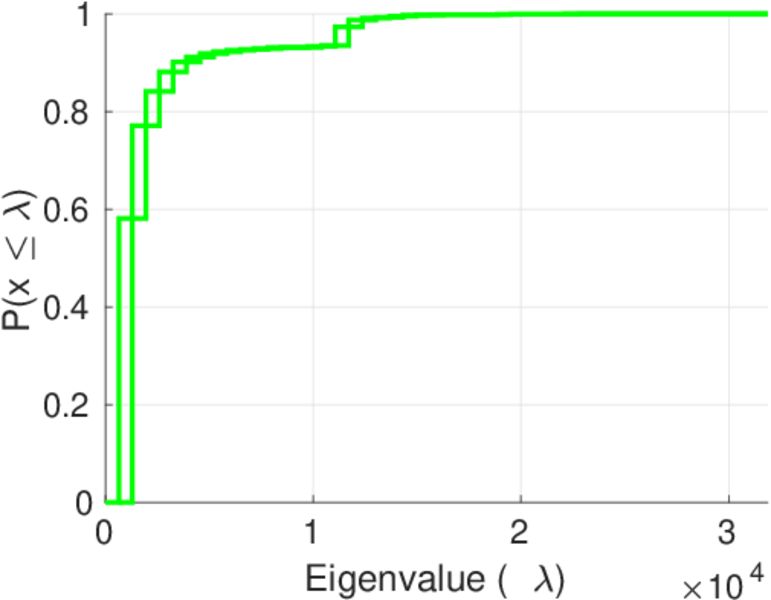
Matrix decompositions plots

Downloads
References
|
[1]
|
Jérôme Kunegis.
KONECT – The Koblenz Network Collection.
In Proc. Int. Conf. on World Wide Web Companion, pages
1343–1350, 2013.
[ http ]
|
|
[2]
|
R. Zafarani and H. Liu.
Social computing data repository at ASU, 2009.
[ http ]
|
 KONECT ‣ Networks ‣
Buy Me a Coffee
KONECT ‣ Networks ‣
Buy Me a Coffee