Iceland

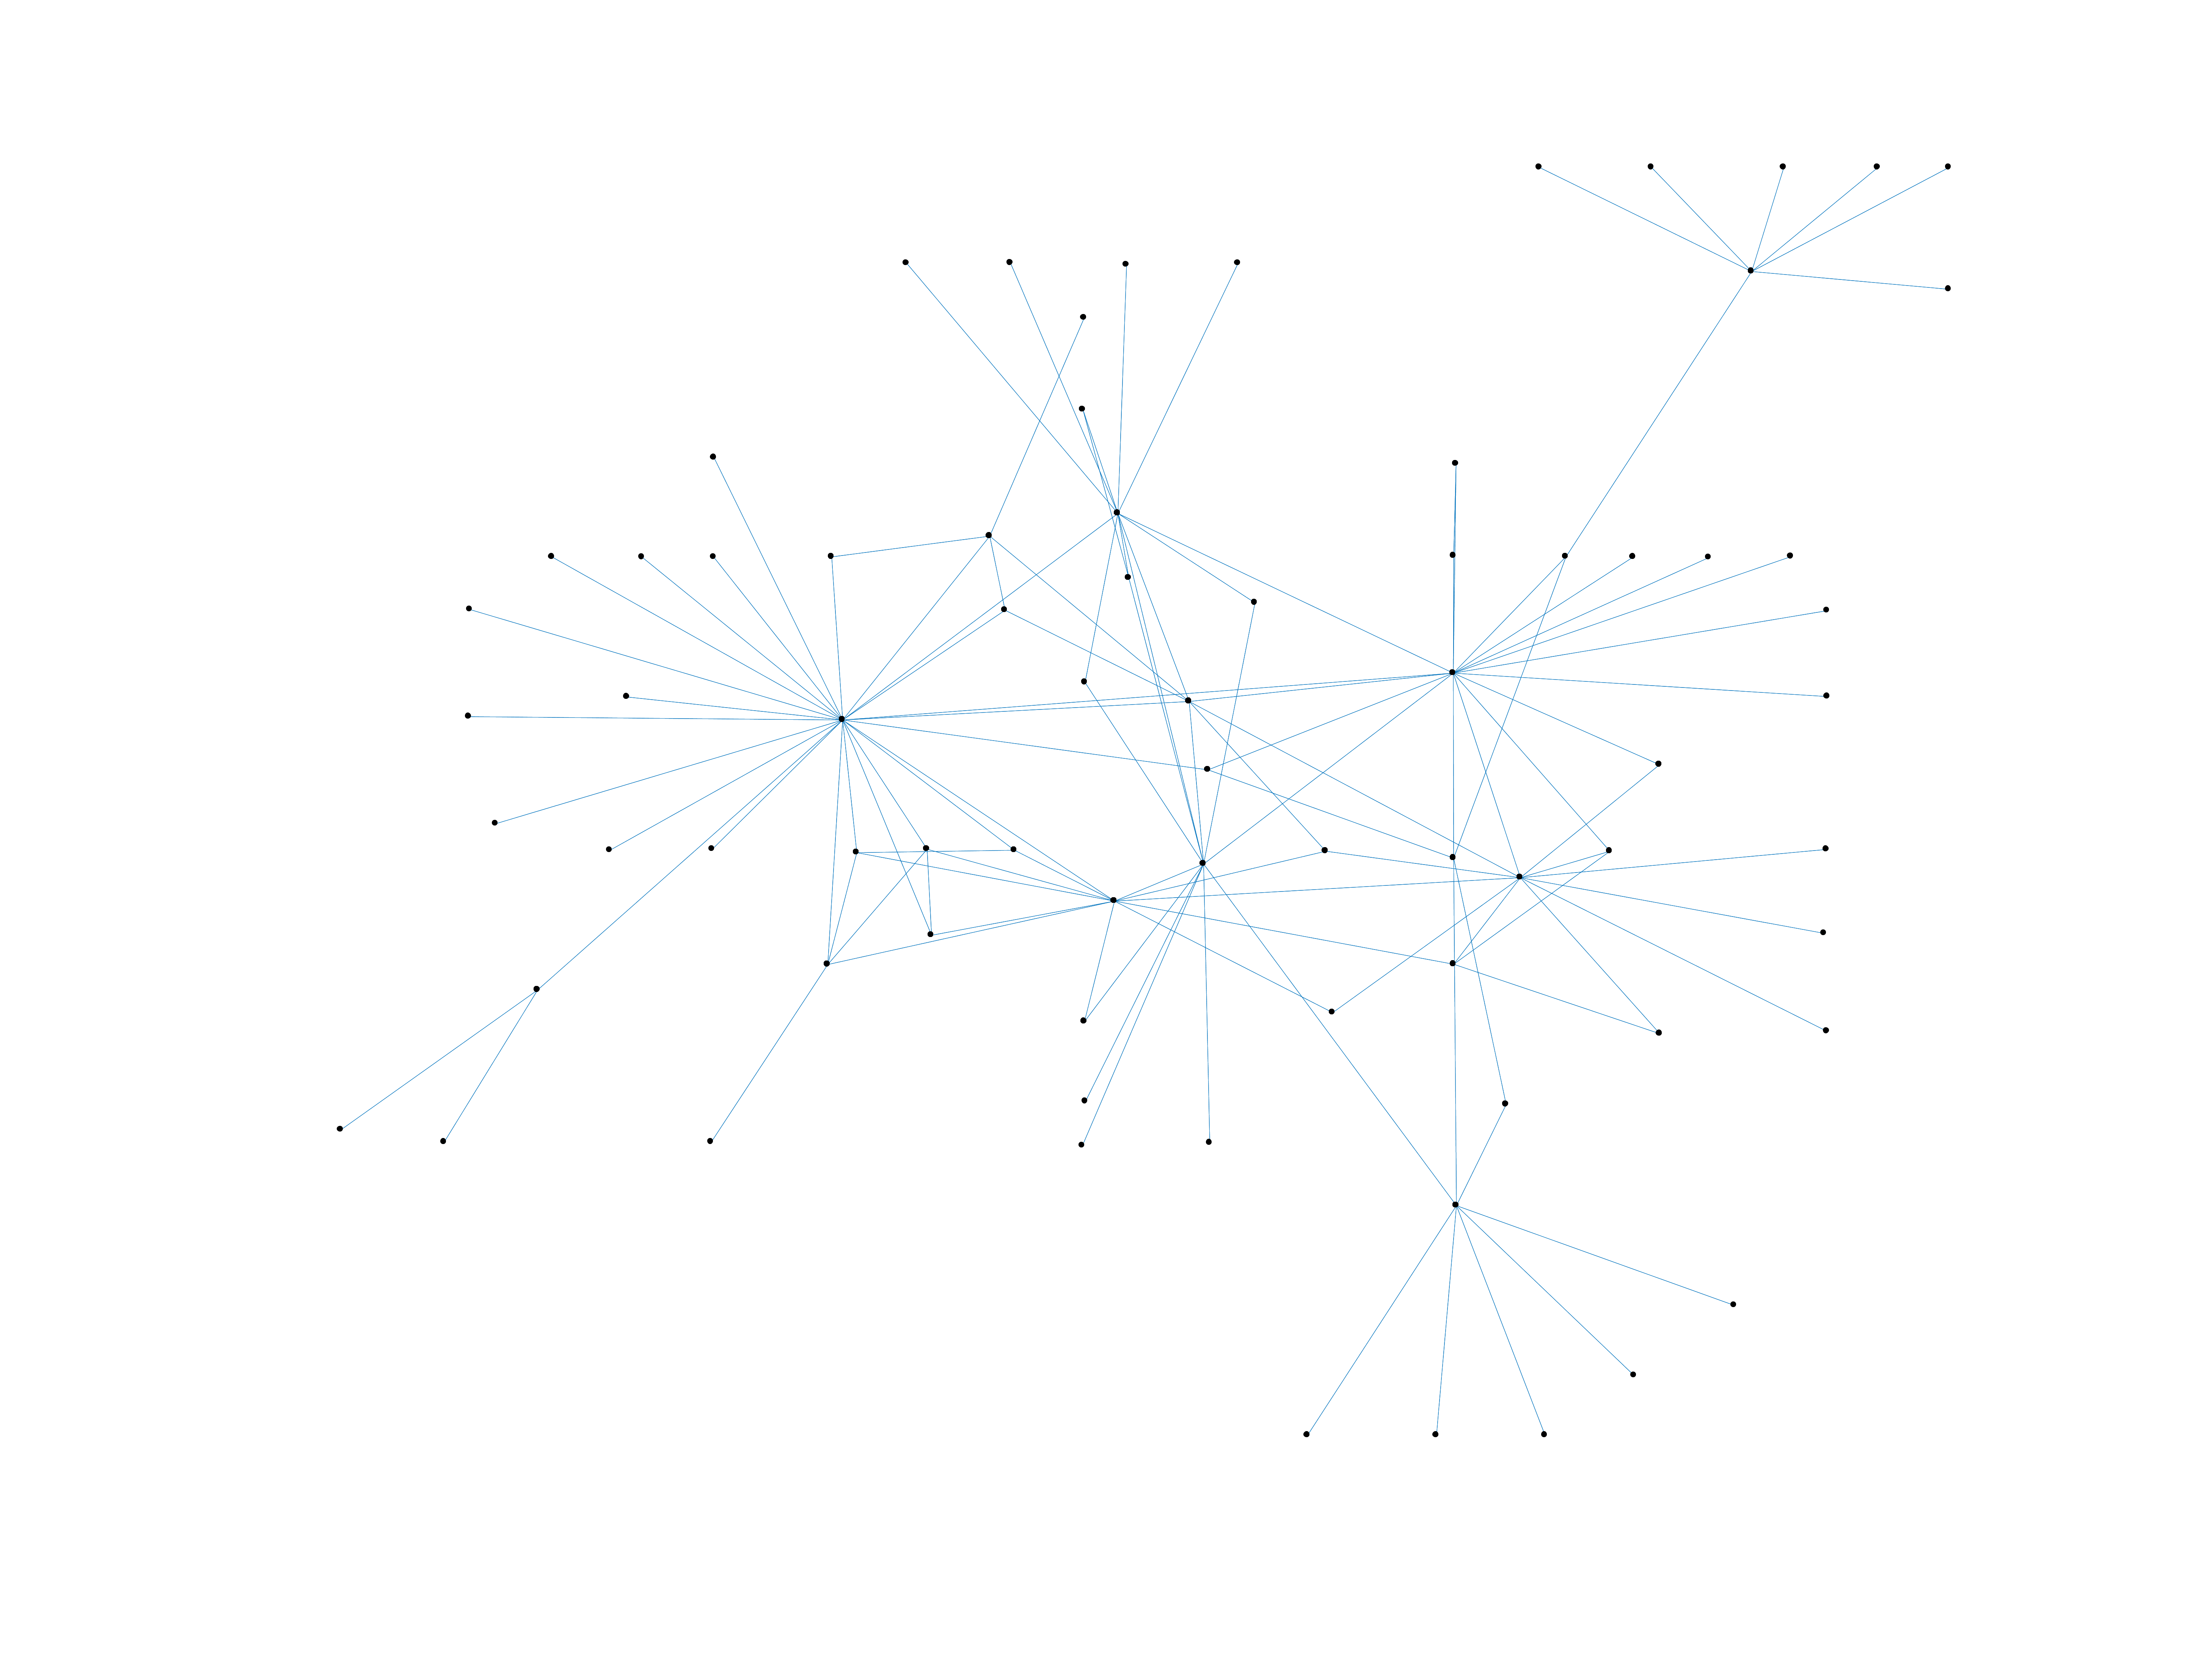
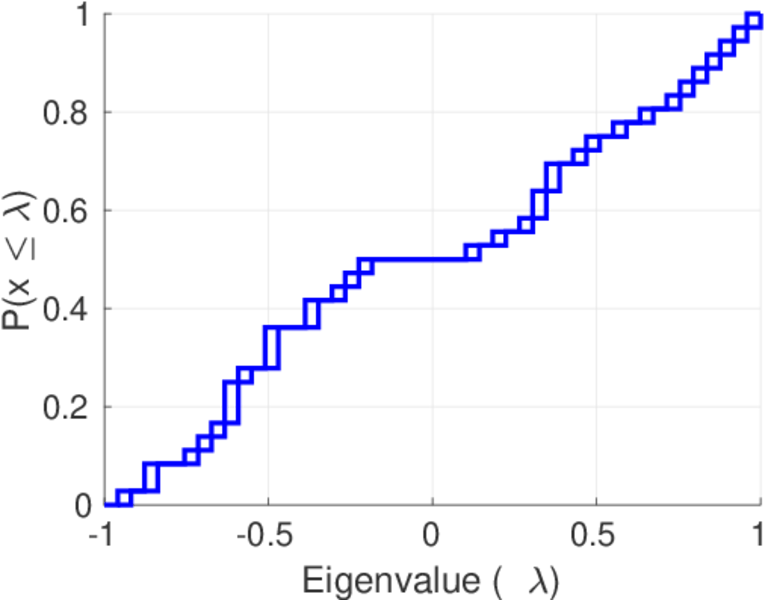
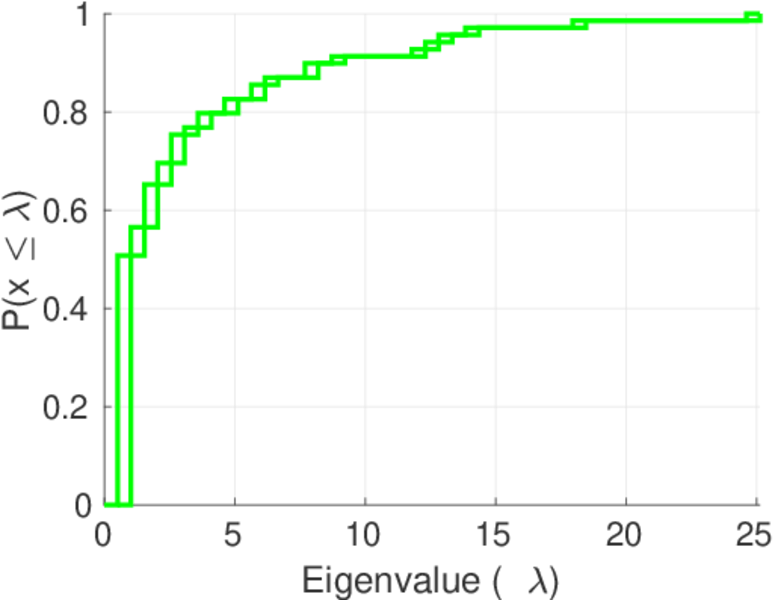
This is a network of sexual contacts of male homosexuals in Iceland, collected in 1992.

Metadata

CodeIC
Internal nameiceland
NameIceland
AvailabilityDataset is available for download
Consistency checkDataset passed all tests
Category
Human contact network
Dataset timestamp 1992
Node meaningPerson
Edge meaningSexual contact
Network formatUnipartite, undirected
Edge typeUnweighted, no multiple edges
LoopsDoes not contain loops
Snapshot Is a snapshot and likely to not contain all data
Connectedness Only the largest connected component of the original data is included

Statistics

Size n =75
Volume m =114
Loop count l =0
Wedge count s =839
Claw count z =3,782
Cross count x =15,179
Triangle count t =44
Square count q =81
4-Tour count T4 =4,232
Maximum degree dmax =24
Average degree d =3.040 00
Fill p =0.041 081 1
Size of LCC N =75
Diameter δ =6
50-Percentile effective diameter δ0.5 =2.611 21
90-Percentile effective diameter δ0.9 =4.383 29
Median distance δM =3
Mean distance δm =3.186 82
Gini coefficient G =0.520 936
Balanced inequality ratio P =0.285 088
Relative edge distribution entropy Her =0.875 261
Power law exponent γ =2.544 64
Tail power law exponent γt =1.921 00
Tail power law exponent with p γ3 =1.921 00
p-value p =0.256 000
Degree assortativity ρ =−0.401 272
Degree assortativity p-value pρ =3.129 94 × 10−10
Clustering coefficient c =0.157 330
Spectral norm α =6.817 48
Algebraic connectivity a =0.087 141 4
Spectral separation 1[A] / λ2[A]| =1.480 28
Non-bipartivity bA =0.324 454
Normalized non-bipartivity bN =0.045 396 4
Algebraic non-bipartivity χ =0.081 474 0
Spectral bipartite frustration bK =0.006 700 16
Controllability C =39
Relative controllability Cr =0.520 000

Plots

Fruchterman–Reingold graph drawing

Degree distribution

Cumulative degree distribution

Lorenz curve

Spectral distribution of the adjacency matrix

Spectral distribution of the normalized adjacency matrix

Spectral distribution of the Laplacian

Spectral graph drawing based on the adjacency matrix

Spectral graph drawing based on the Laplacian

Spectral graph drawing based on the normalized adjacency matrix

Degree assortativity

Zipf plot

Hop distribution

Double Laplacian graph drawing

Delaunay graph drawing

Clustering coefficient distribution

Average neighbor degree distribution

SynGraphy

Matrix decompositions plots

Downloads

References

[1] Jérôme Kunegis. KONECT – The Koblenz Network Collection. In Proc. Int. Conf. on World Wide Web Companion, pages 1343–1350, 2013. [ http ]
[2] Sigridur Haraldsdottir, Sunetra Gupta, and Roy M. Anderson. Preliminary studies of sexual networks in a make homosexual community in Iceland. J. of Acquir. Immune Defic. Syndr., 5(4):374–381, 1992.