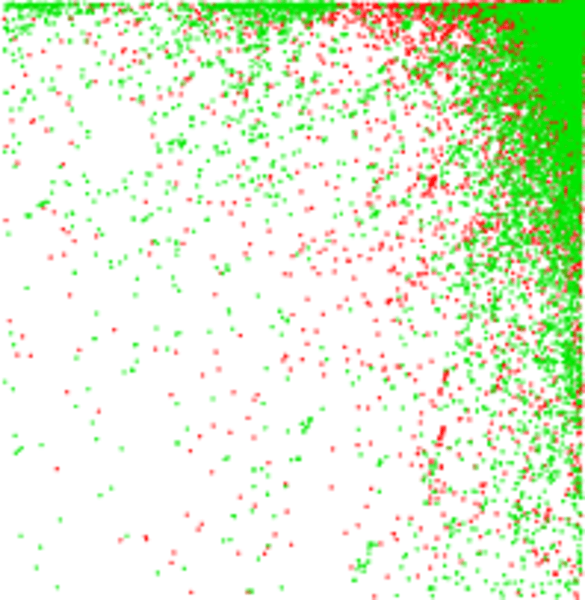
CiteSeer
This is an authorship network extracted from CiteSeer. The network is
bipartite. Left nodes are authors and right nodes are scientific publications.
An edge represents that an author has (co-)published a given publication.
Metadata
Statistics
| Size | n = | 286,748
|
| Left size | n1 = | 105,353
|
| Right size | n2 = | 181,395
|
| Volume | m = | 512,267
|
| Wedge count | s = | 6,600,745
|
| Claw count | z = | 141,351,614
|
| Cross count | x = | 4,706,439,420
|
| Square count | q = | 1,005,817
|
| 4-Tour count | T4 = | 35,474,306
|
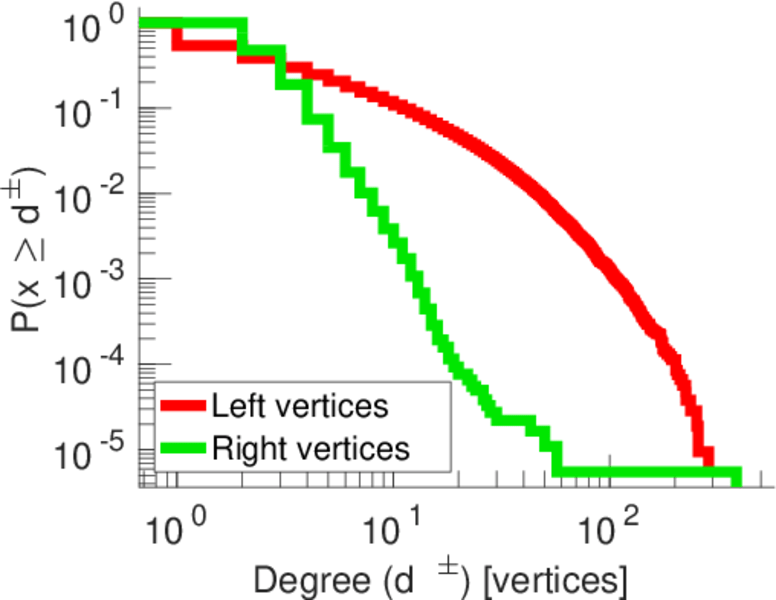
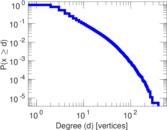
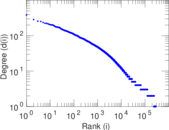
| Maximum degree | dmax = | 385
|
| Maximum left degree | d1max = | 286
|
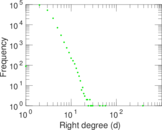
| Maximum right degree | d2max = | 385
|
| Average degree | d = | 3.572 94
|
| Average left degree | d1 = | 4.862 39
|
| Average right degree | d2 = | 2.824 04
|
| Fill | p = | 2.680 55 × 10−5
|
| Size of LCC | N = | 269,000
|
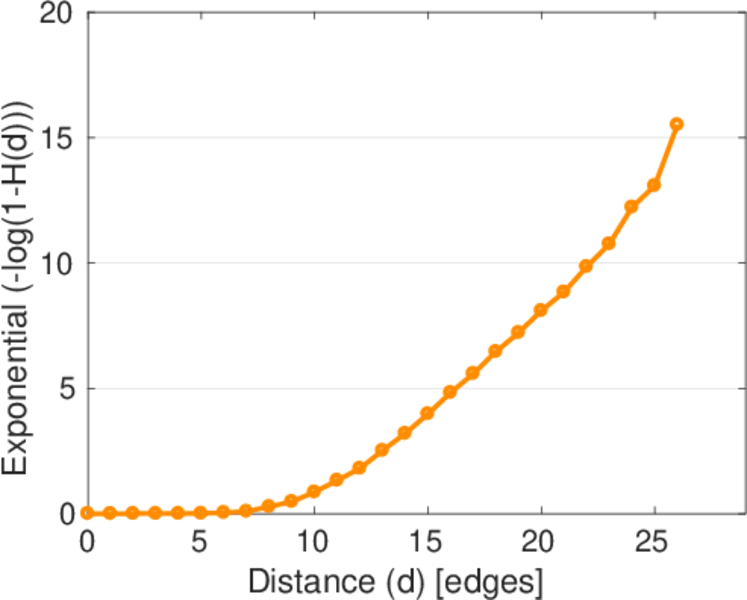
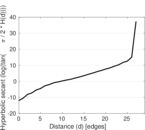
| Diameter | δ = | 34
|
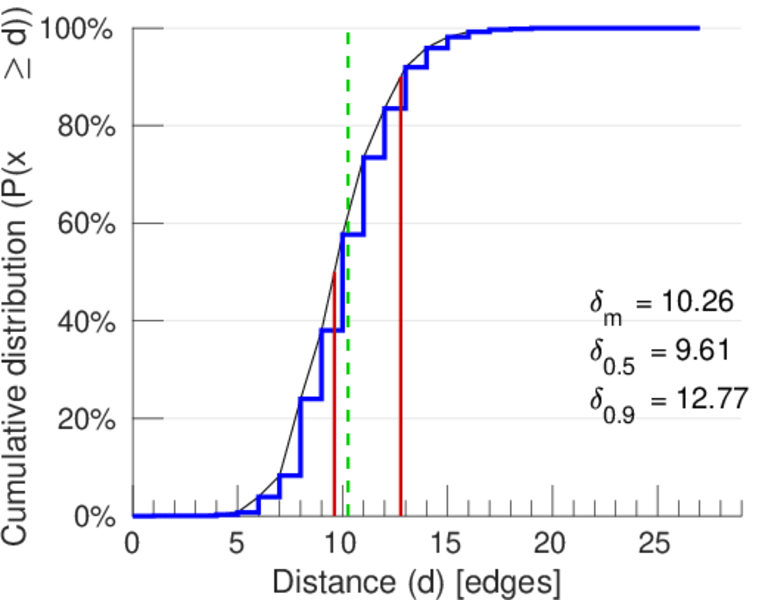
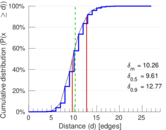
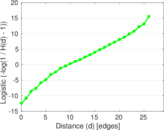
| 50-Percentile effective diameter | δ0.5 = | 9.609 52
|
| 90-Percentile effective diameter | δ0.9 = | 12.771 1
|
| Median distance | δM = | 10
|
| Mean distance | δm = | 10.256 5
|
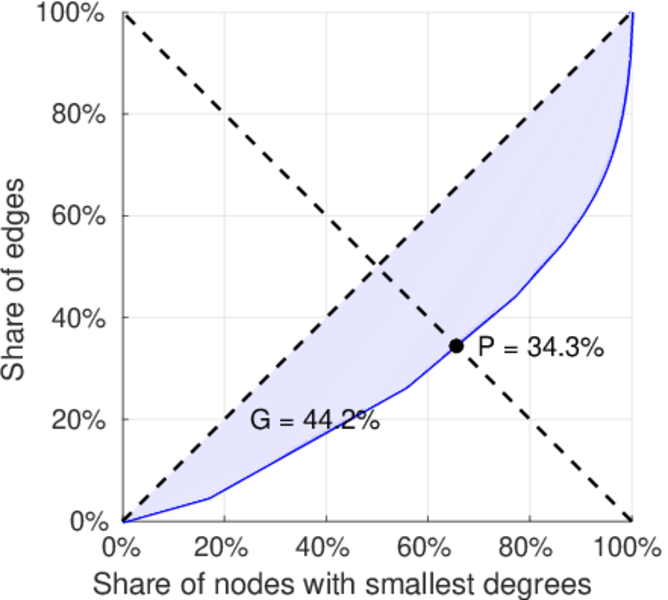
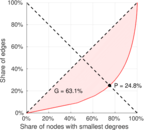
| Gini coefficient | G = | 0.433 609
|
| Balanced inequality ratio | P = | 0.341 086
|
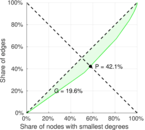
| Left balanced inequality ratio | P1 = | 0.247 713
|
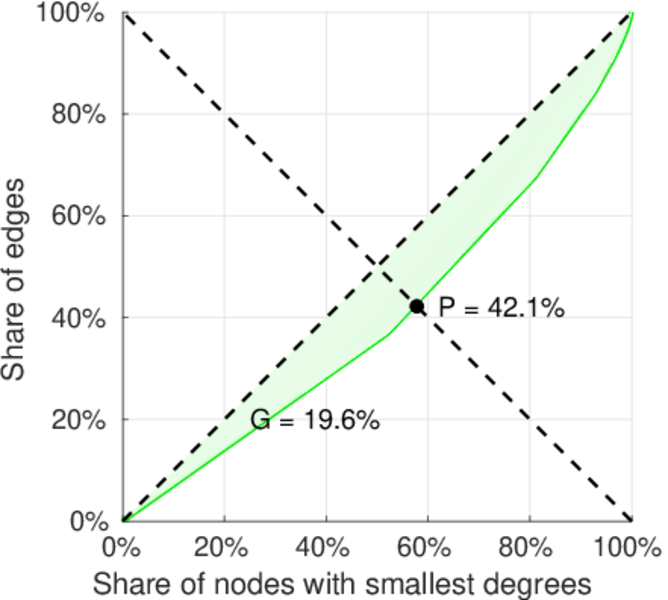
| Right balanced inequality ratio | P2 = | 0.420 591
|
| Relative edge distribution entropy | Her = | 0.960 274
|
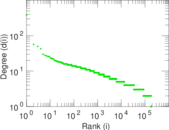
| Power law exponent | γ = | 2.073 83
|
| Tail power law exponent | γt = | 2.421 00
|
| Tail power law exponent with p | γ3 = | 2.421 00
|
| p-value | p = | 0.000 00
|
| Left tail power law exponent with p | γ3,1 = | 3.711 00
|
| Left p-value | p1 = | 0.003 000 00
|
| Right tail power law exponent with p | γ3,2 = | 4.881 00
|
| Right p-value | p2 = | 0.004 000 00
|
| Degree assortativity | ρ = | −0.024 252 2
|
| Degree assortativity p-value | pρ = | 1.642 04 × 10−67
|
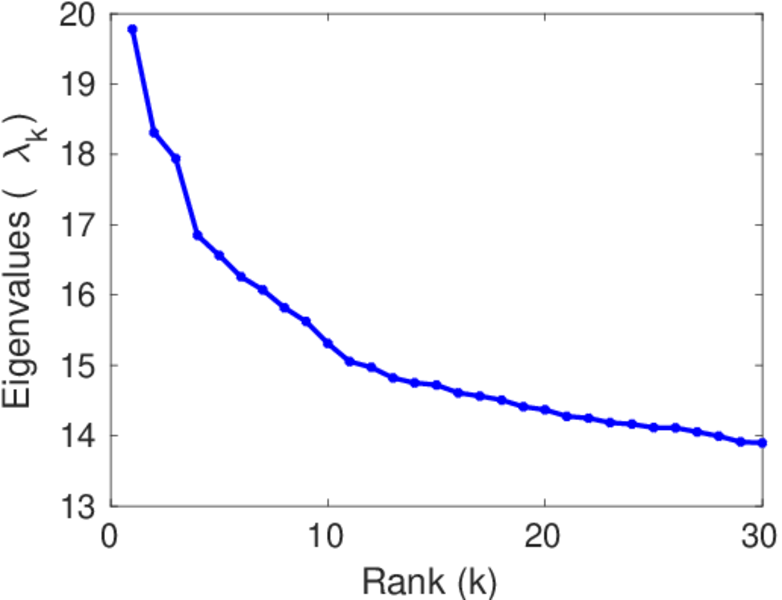
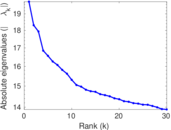
| Spectral norm | α = | 19.779 0
|
| Algebraic connectivity | a = | 0.004 724 70
|
| Spectral separation | |λ1[A] / λ2[A]| = | 1.080 33
|
| Controllability | C = | 114,852
|
| Relative controllability | Cr = | 0.400 533
|
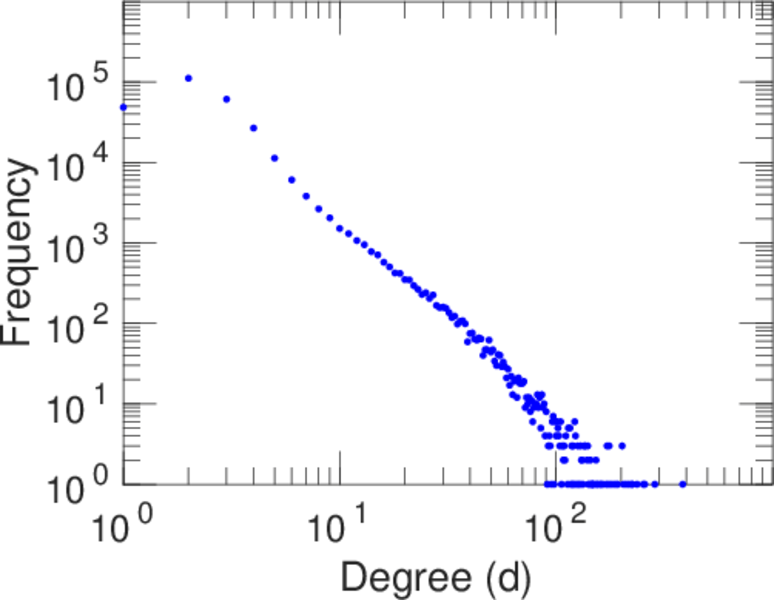
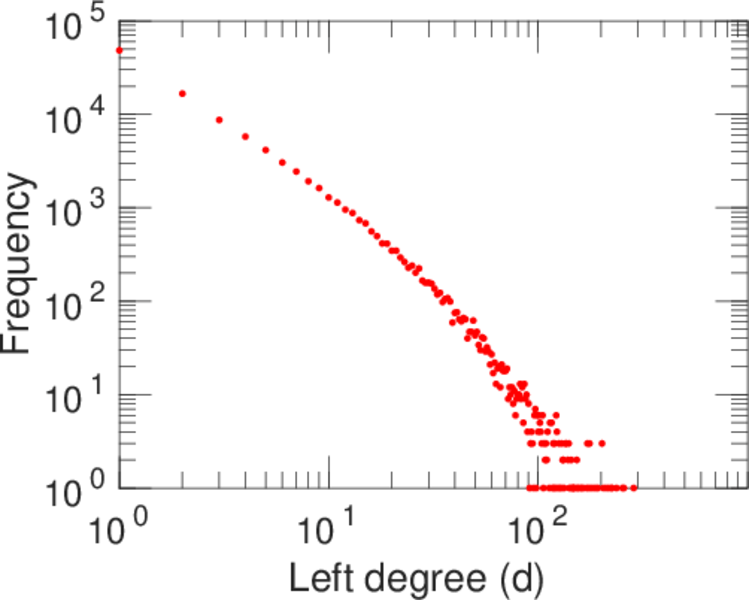
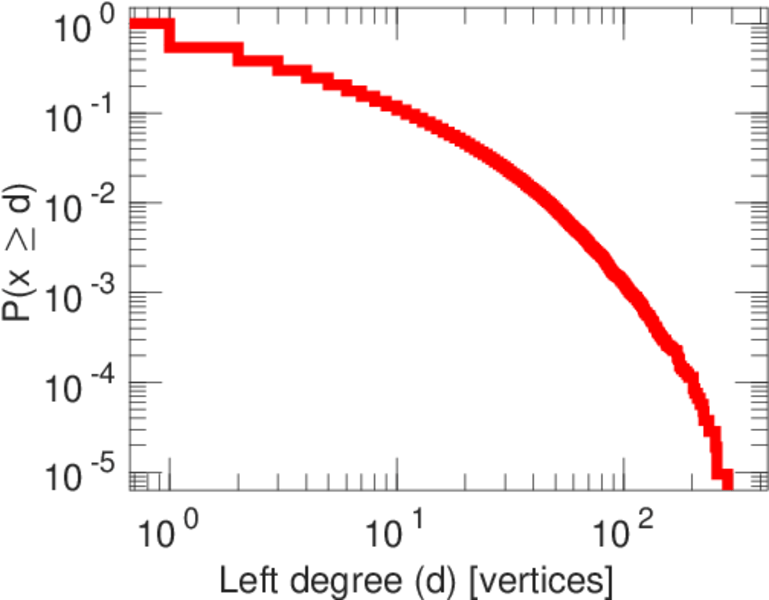
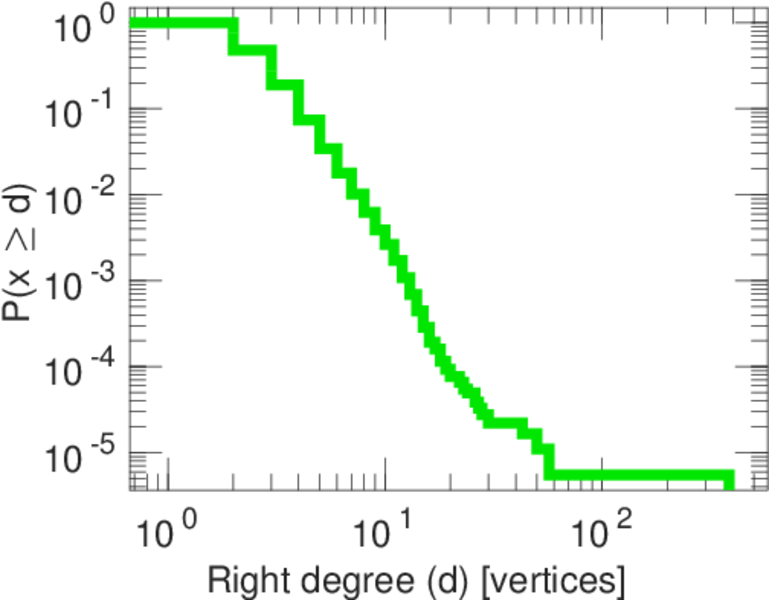
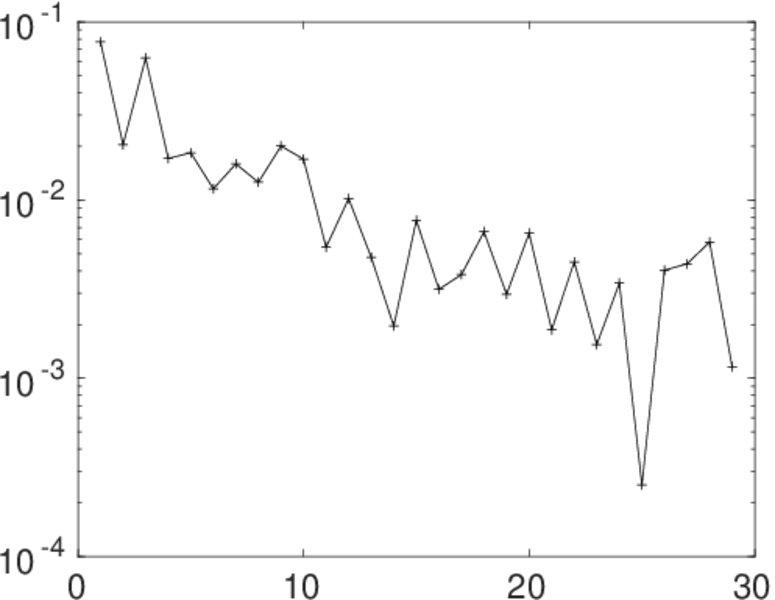
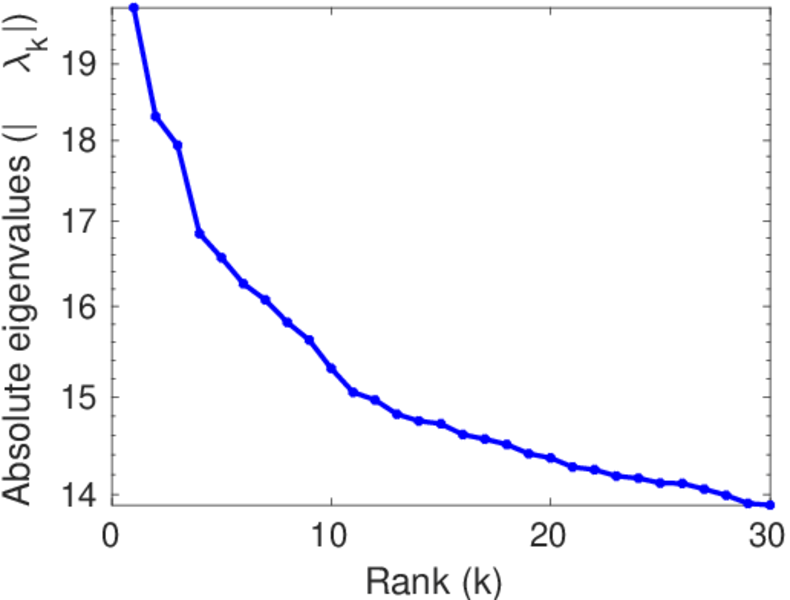
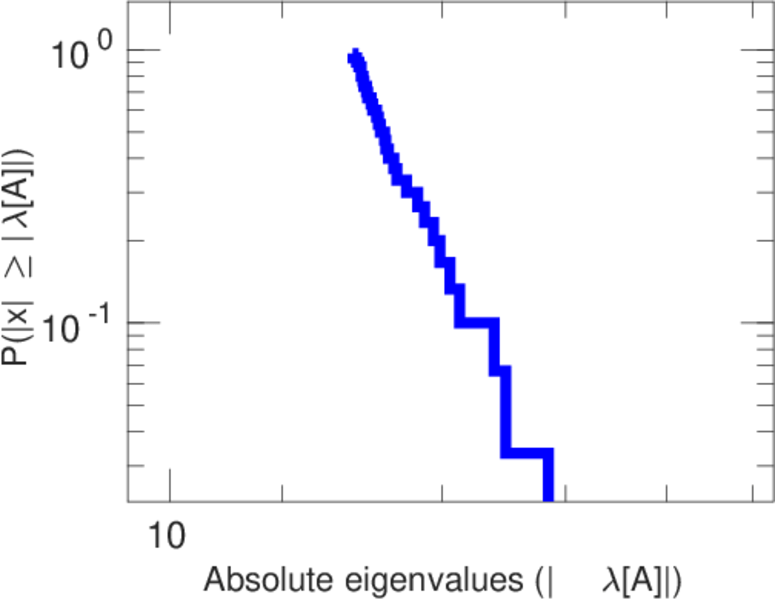
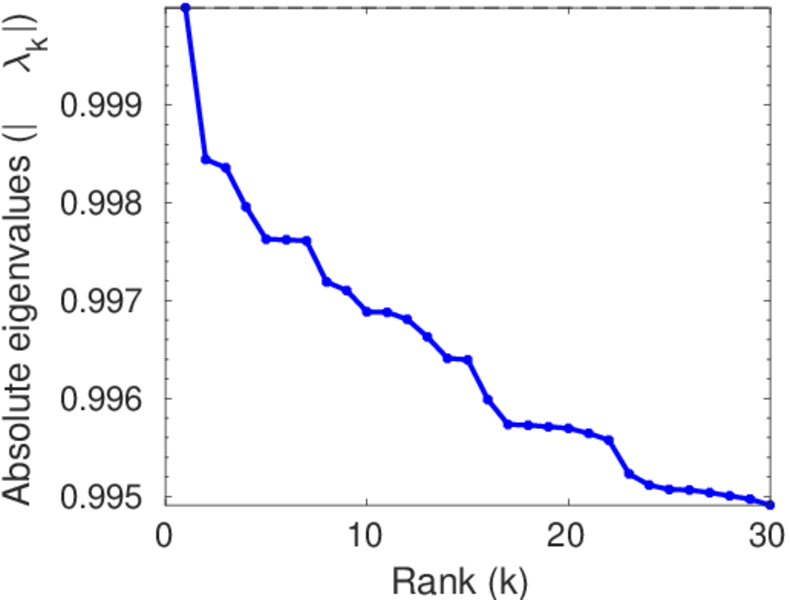
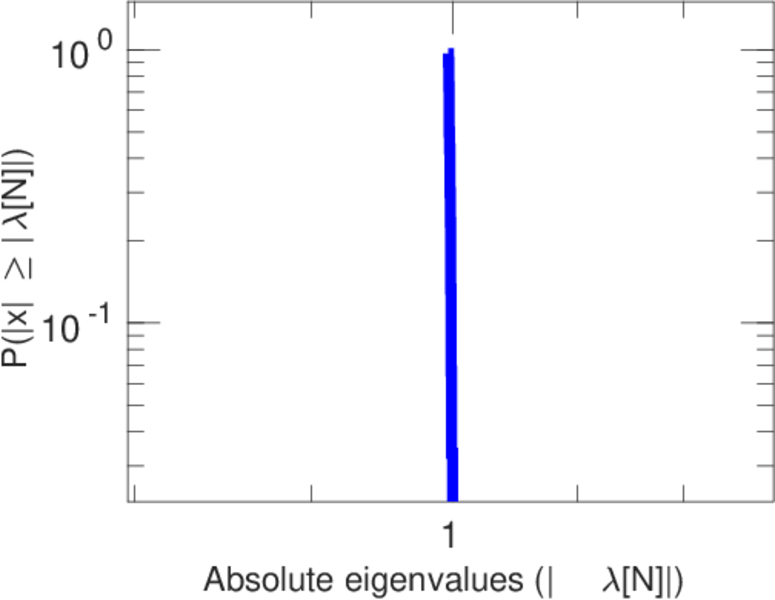
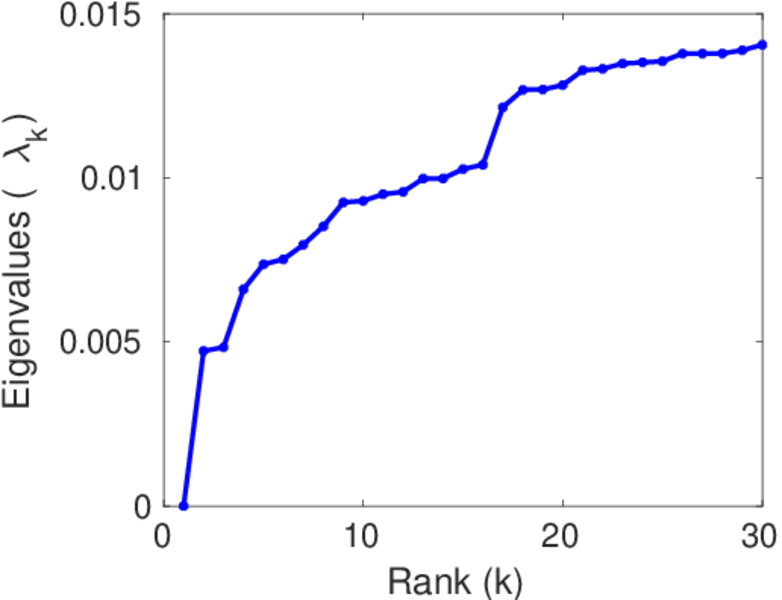
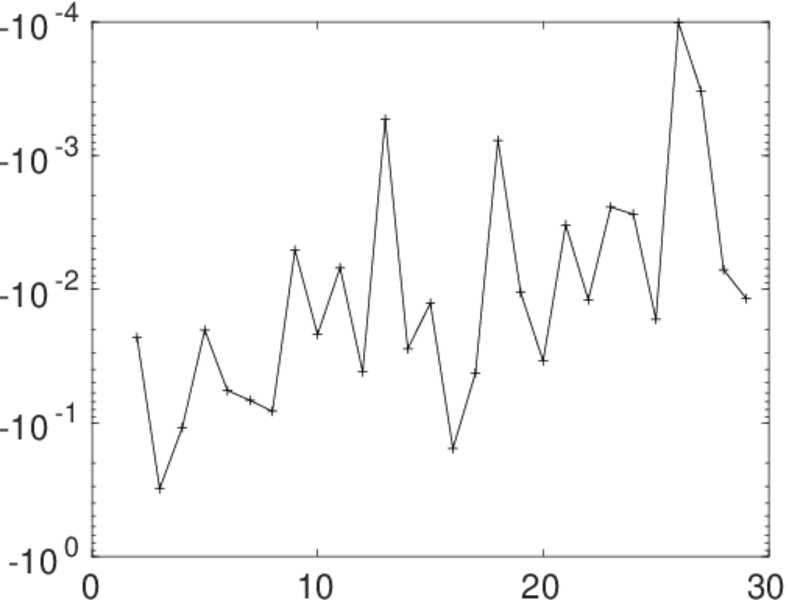
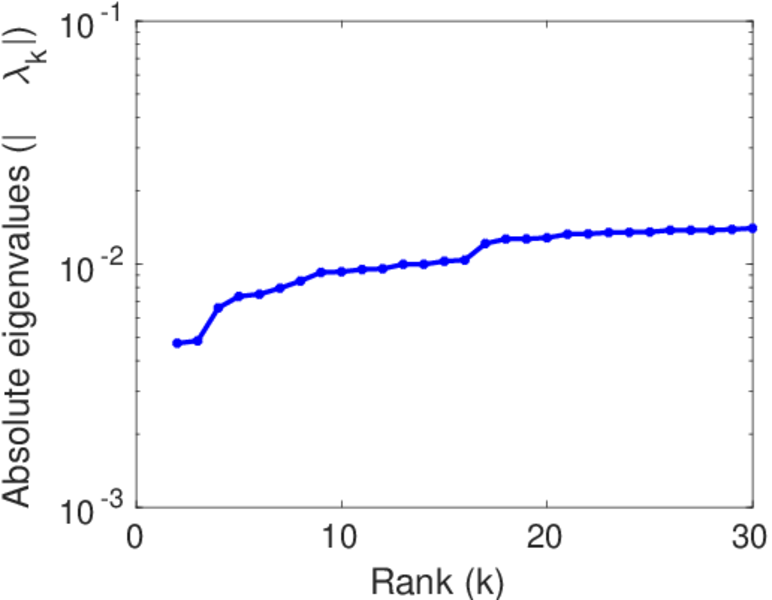
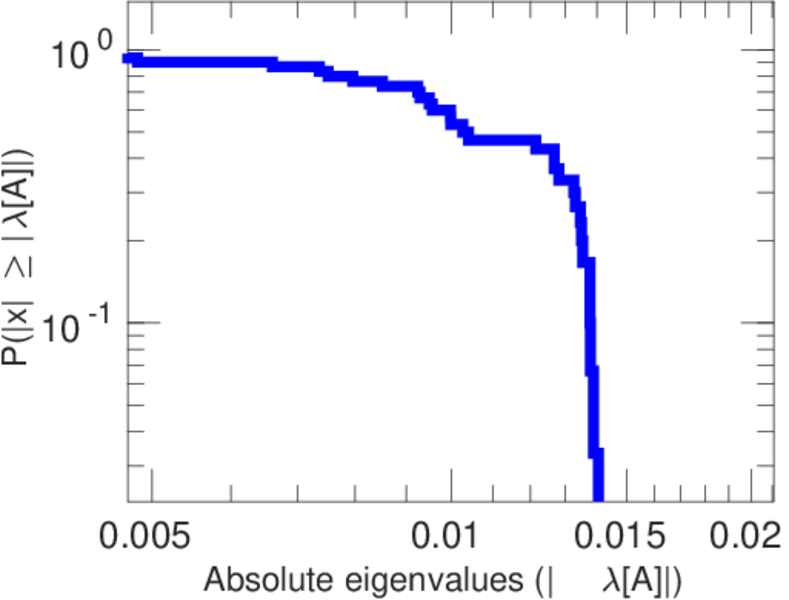
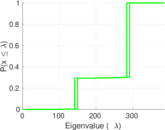
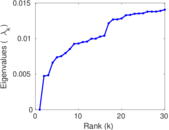
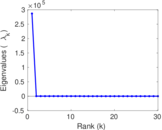
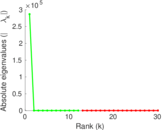
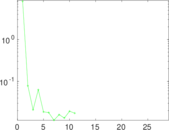
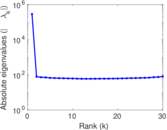
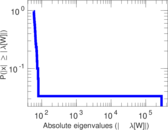
Plots


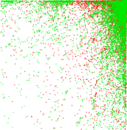
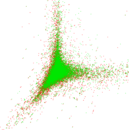


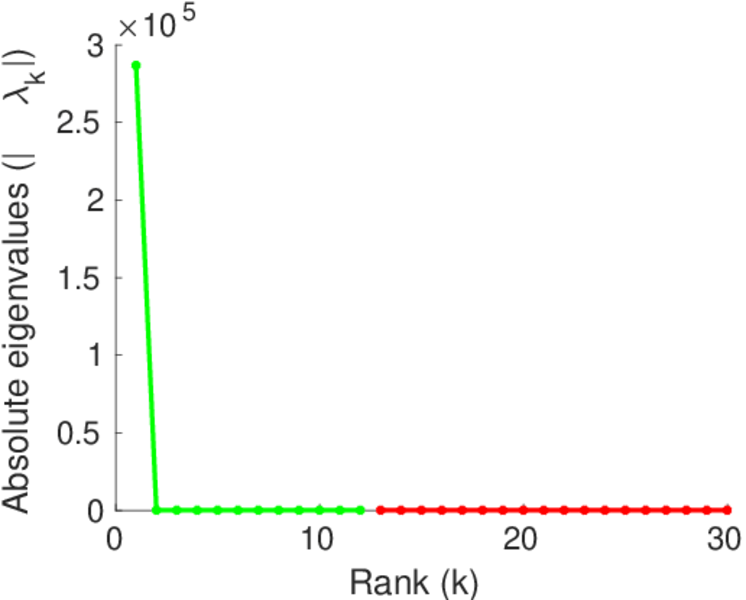
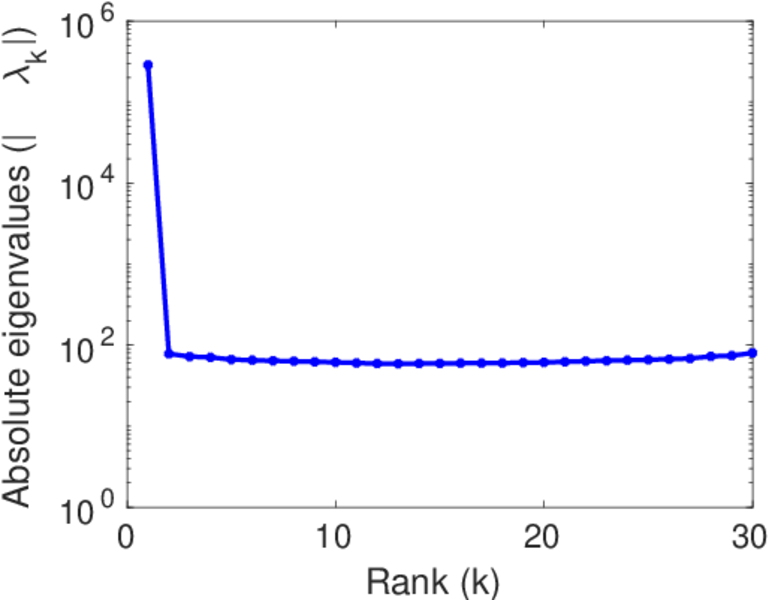
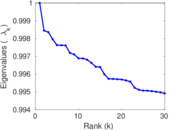
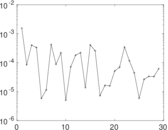
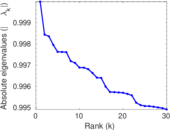
Matrix decompositions plots


Downloads
References
|
[1]
|
Jérôme Kunegis.
KONECT – The Koblenz Network Collection.
In Proc. Int. Conf. on World Wide Web Companion, pages
1343–1350, 2013.
[ http ]
|
 KONECT ‣ Networks ‣
Buy Me a Coffee
KONECT ‣ Networks ‣
Buy Me a Coffee