IMDB
These are persons associated with individual movies or television programs.
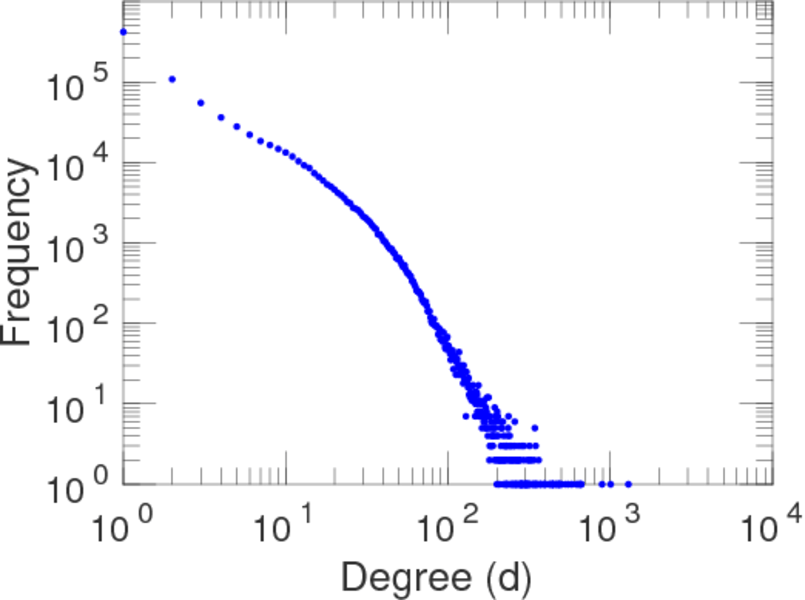
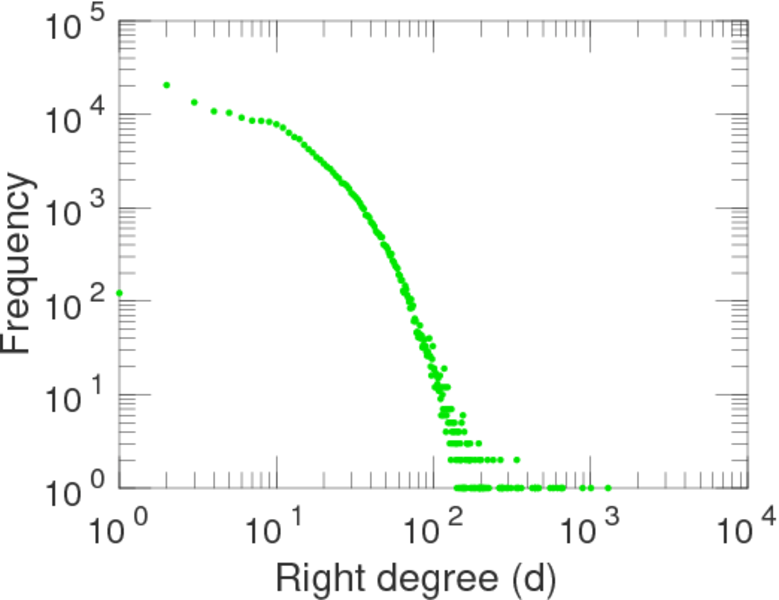
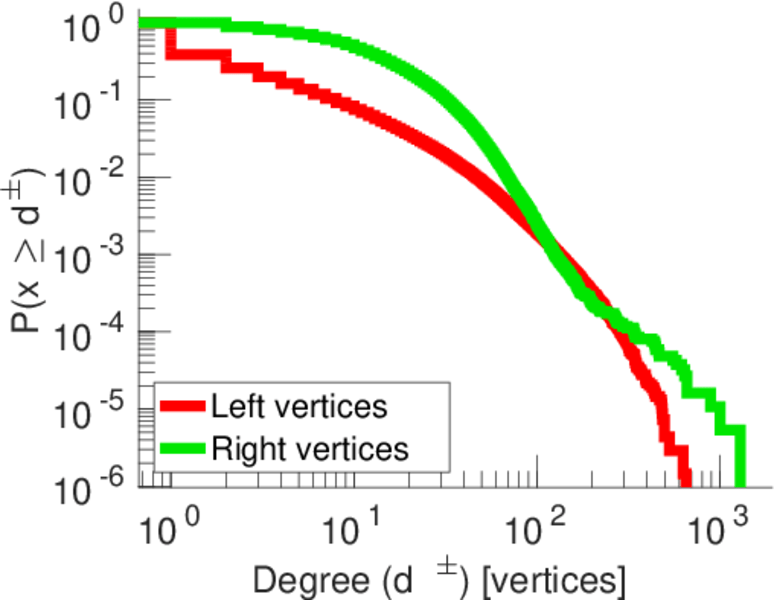
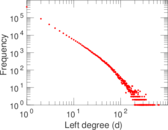
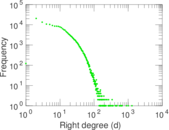
The network is bipartite. Left nodes are persons (actors, directors, etc.),
and right nodes are works (films, television programs, etc.). An edge denotes
that the person was involved in the work.
Metadata
Statistics
| Size | n = | 871,982
|
| Left size | n1 = | 685,568
|
| Right size | n2 = | 186,414
|
| Volume | m = | 2,715,604
|
| Wedge count | s = | 86,342,427
|
| Claw count | z = | 3,510,393,982
|
| Cross count | x = | 360,408,317,294
|
| Square count | q = | 11,803,894
|
| 4-Tour count | T4 = | 445,236,096
|
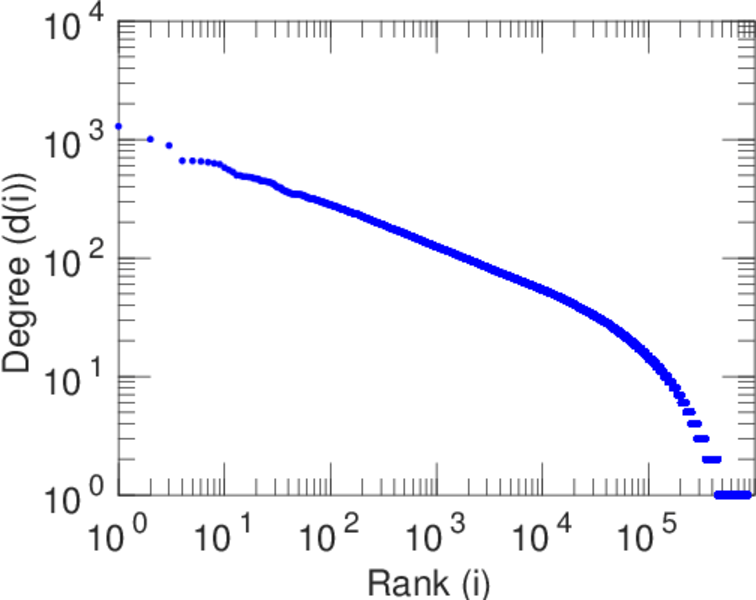
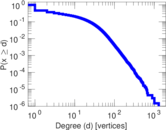
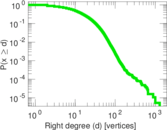
| Maximum degree | dmax = | 1,293
|
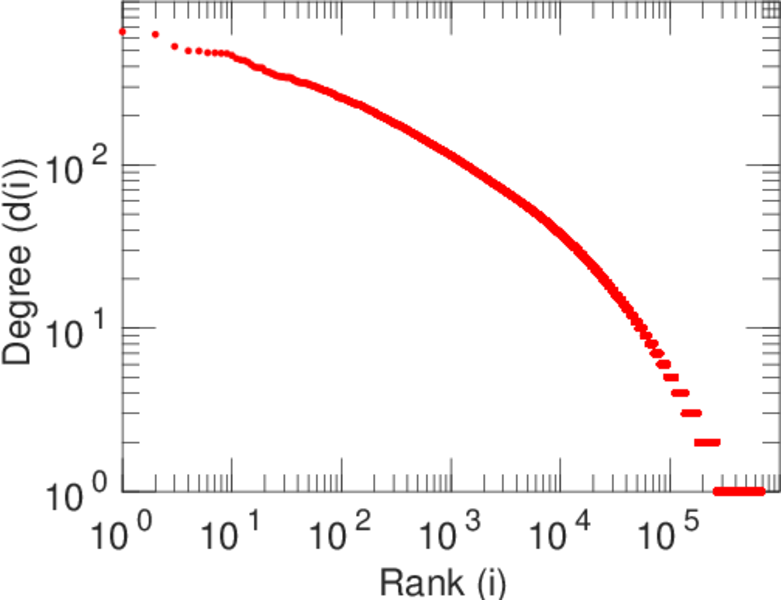
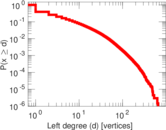
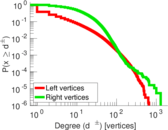
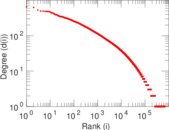
| Maximum left degree | d1max = | 654
|
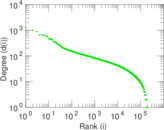
| Maximum right degree | d2max = | 1,293
|
| Average degree | d = | 6.228 58
|
| Average left degree | d1 = | 3.961 10
|
| Average right degree | d2 = | 14.567 6
|
| Size of LCC | N = | 859,975
|
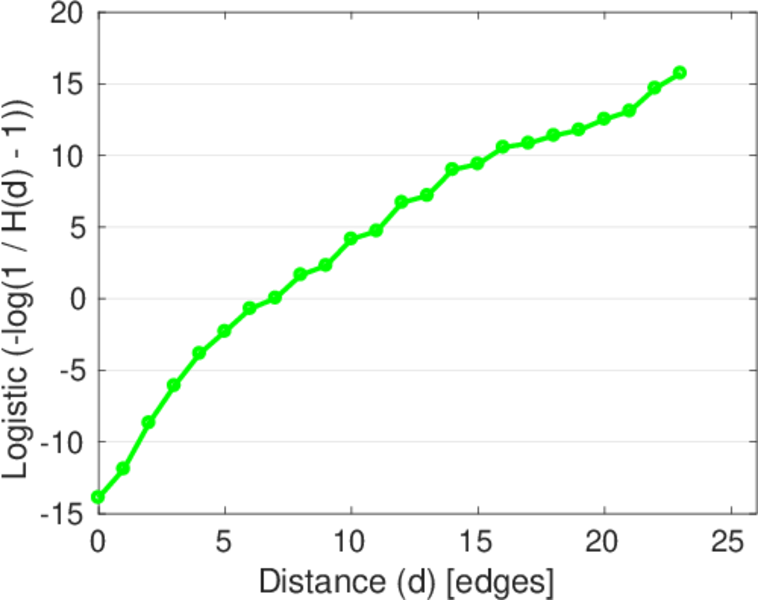
| Diameter | δ = | 34
|
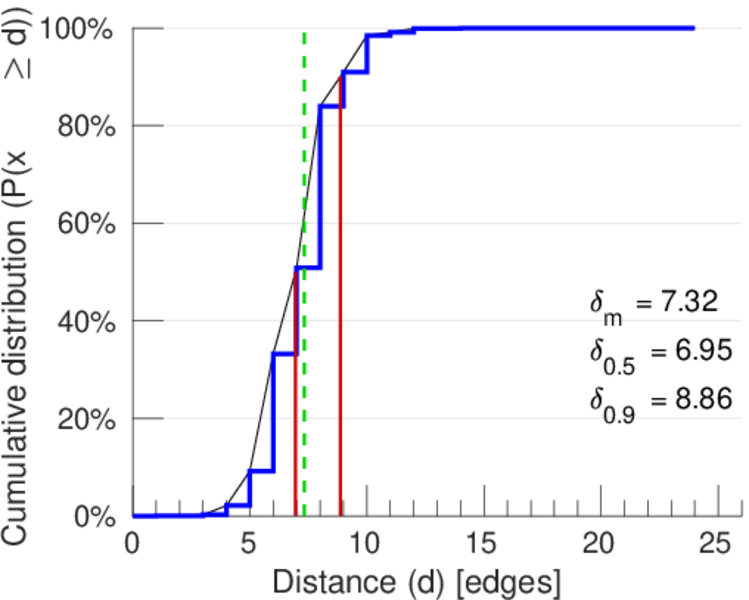
| 50-Percentile effective diameter | δ0.5 = | 6.950 99
|
| 90-Percentile effective diameter | δ0.9 = | 8.862 68
|
| Median distance | δM = | 7
|
| Mean distance | δm = | 7.321 59
|
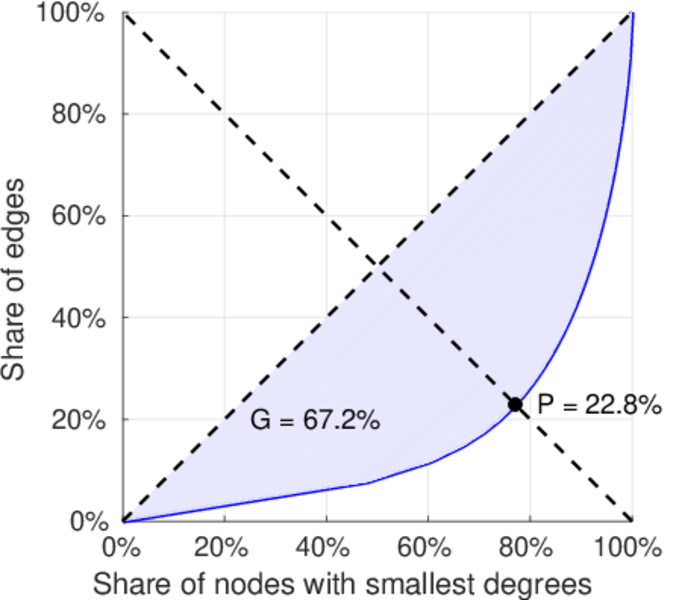
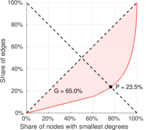
| Gini coefficient | G = | 0.715 542
|
| Balanced inequality ratio | P = | 0.204 069
|
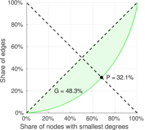
| Left balanced inequality ratio | P1 = | 0.234 662
|
| Right balanced inequality ratio | P2 = | 0.320 584
|
| Relative edge distribution entropy | Her = | 0.931 840
|
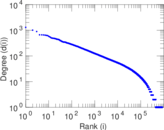
| Power law exponent | γ = | 2.043 11
|
| Tail power law exponent | γt = | 3.761 00
|
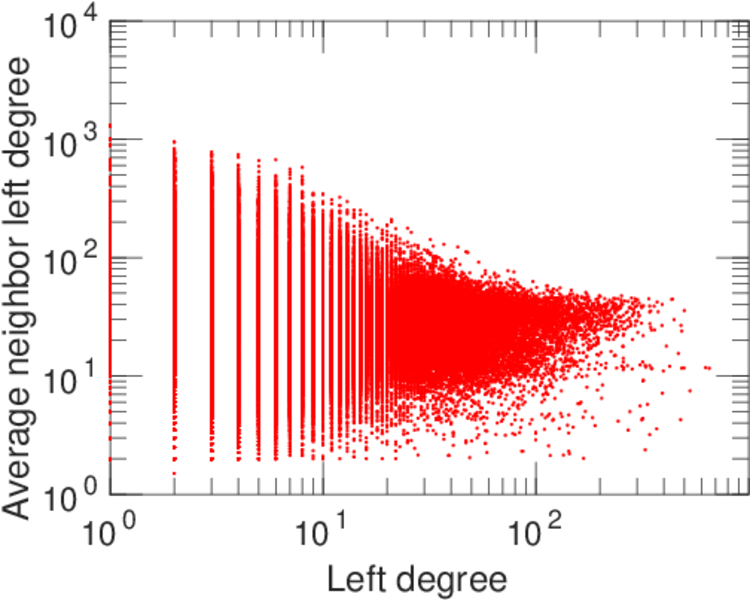
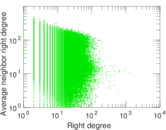
| Degree assortativity | ρ = | −0.047 564 0
|
| Degree assortativity p-value | pρ = | 0.000 00
|
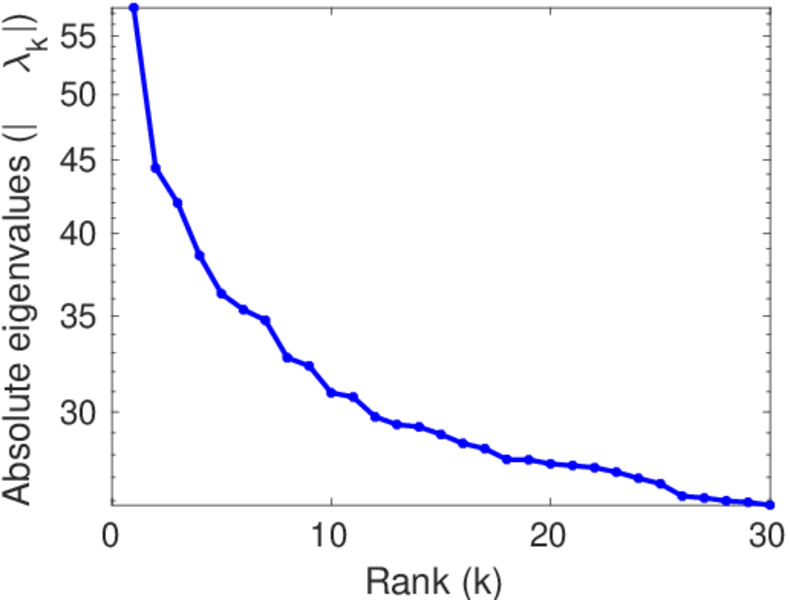
| Spectral norm | α = | 57.531 6
|
| Spectral separation | |λ1[A] / λ2[A]| = | 1.294 69
|
| Controllability | C = | 527,541
|
| Relative controllability | Cr = | 0.604 991
|
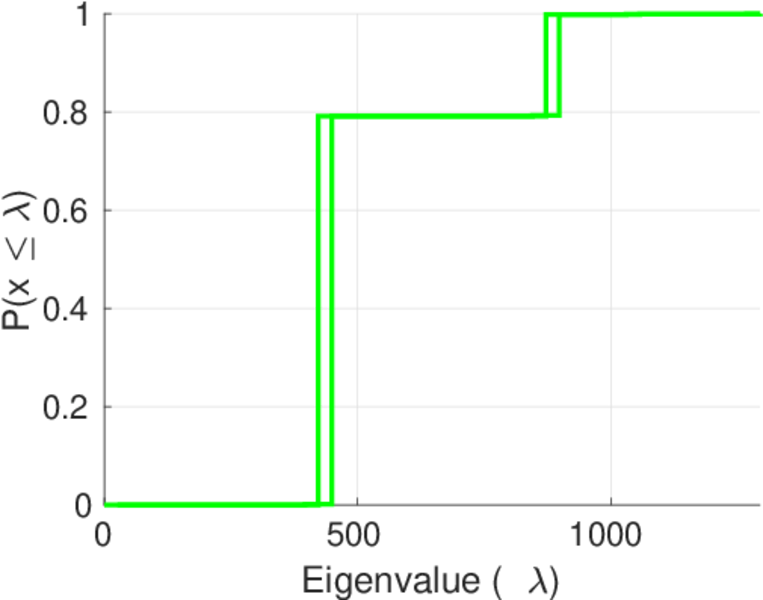
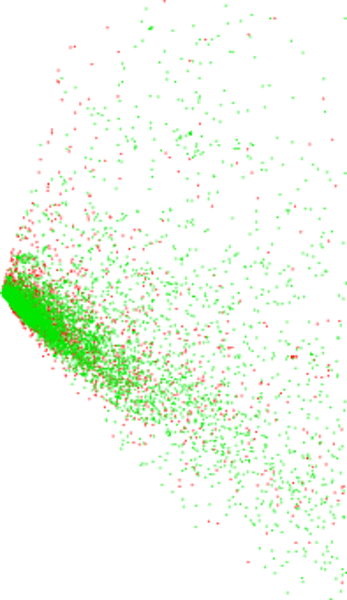
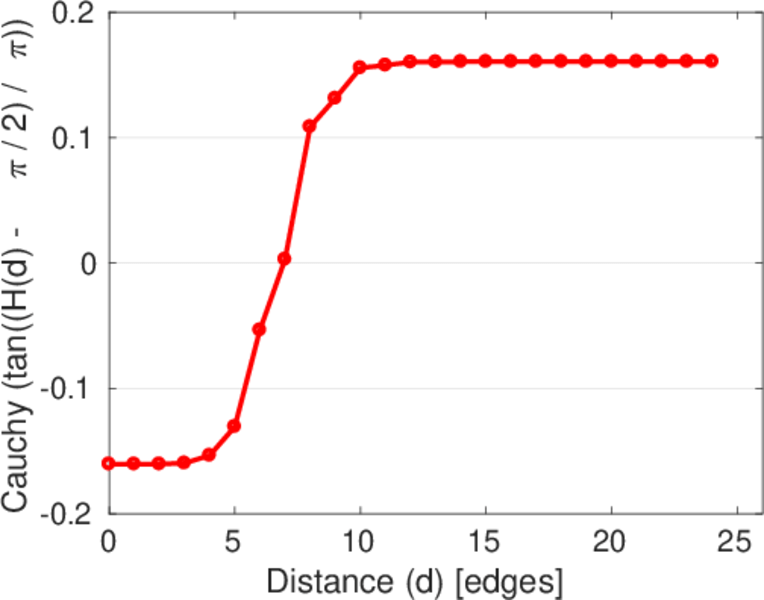
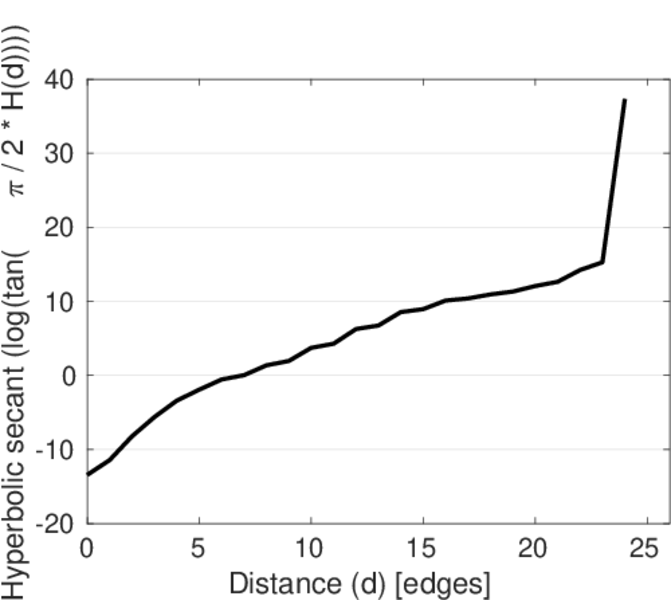
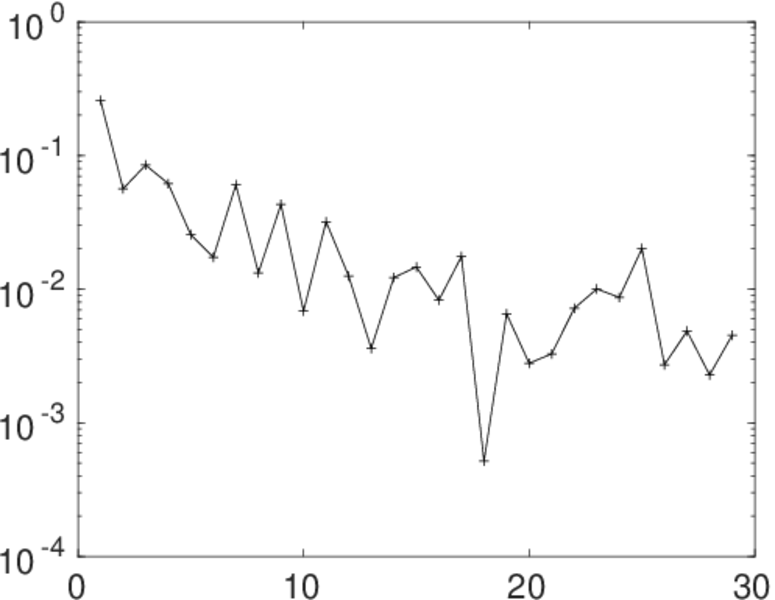
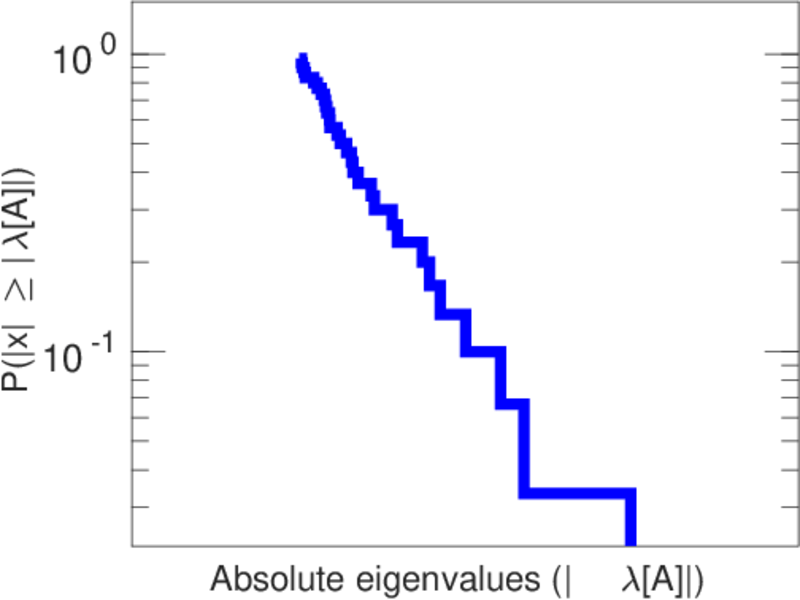
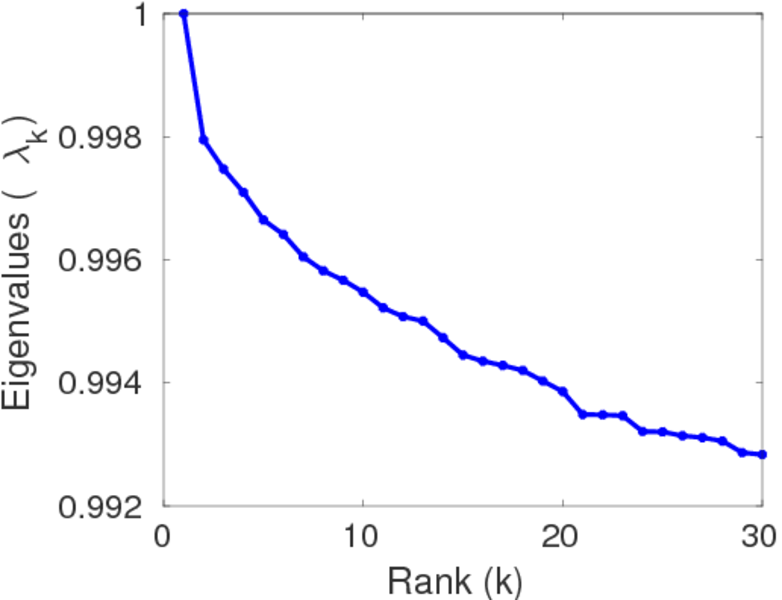
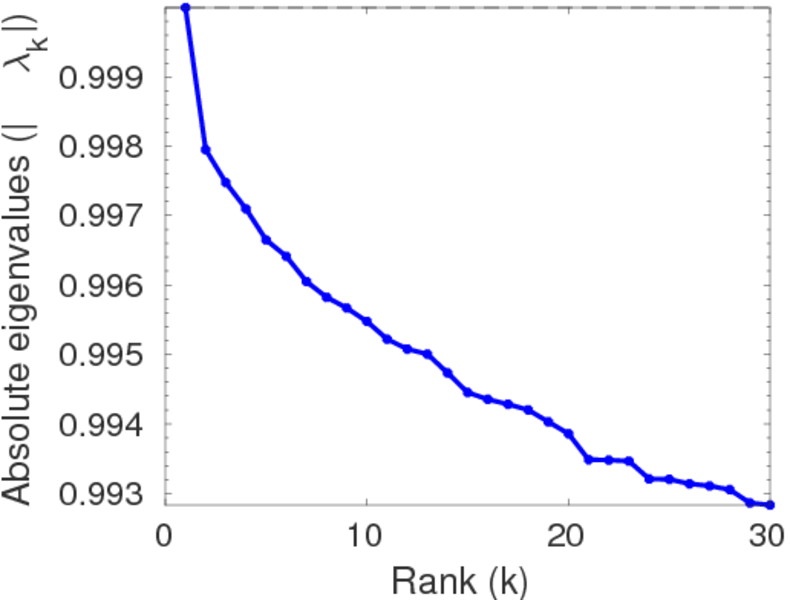
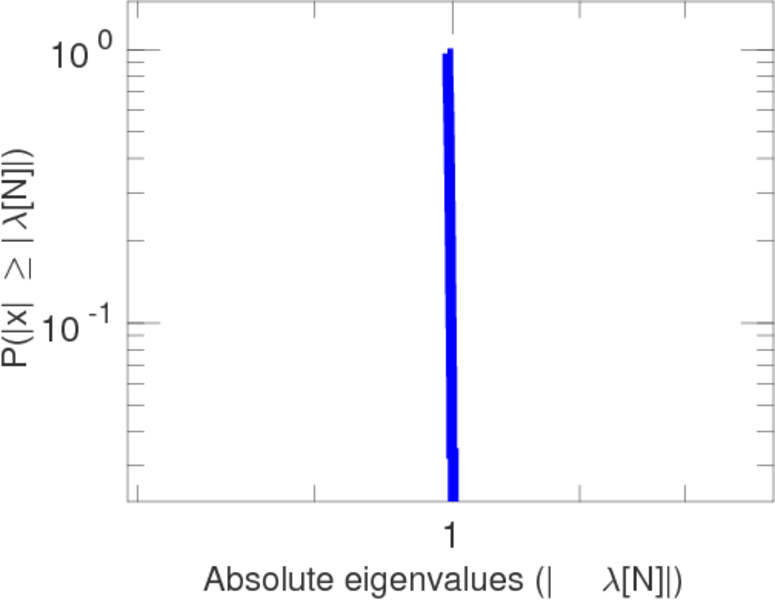
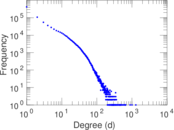
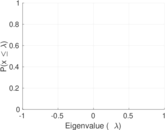
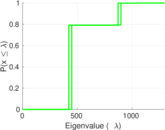
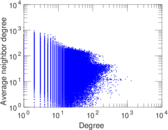
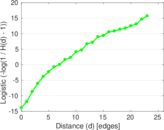
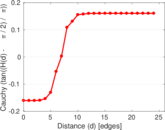
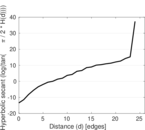
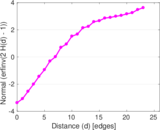
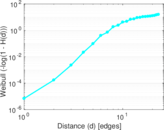
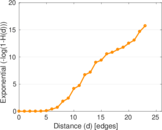
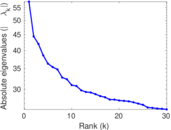
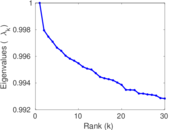
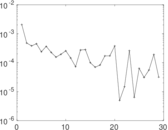
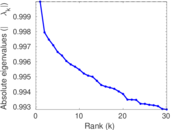
Plots


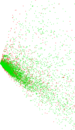


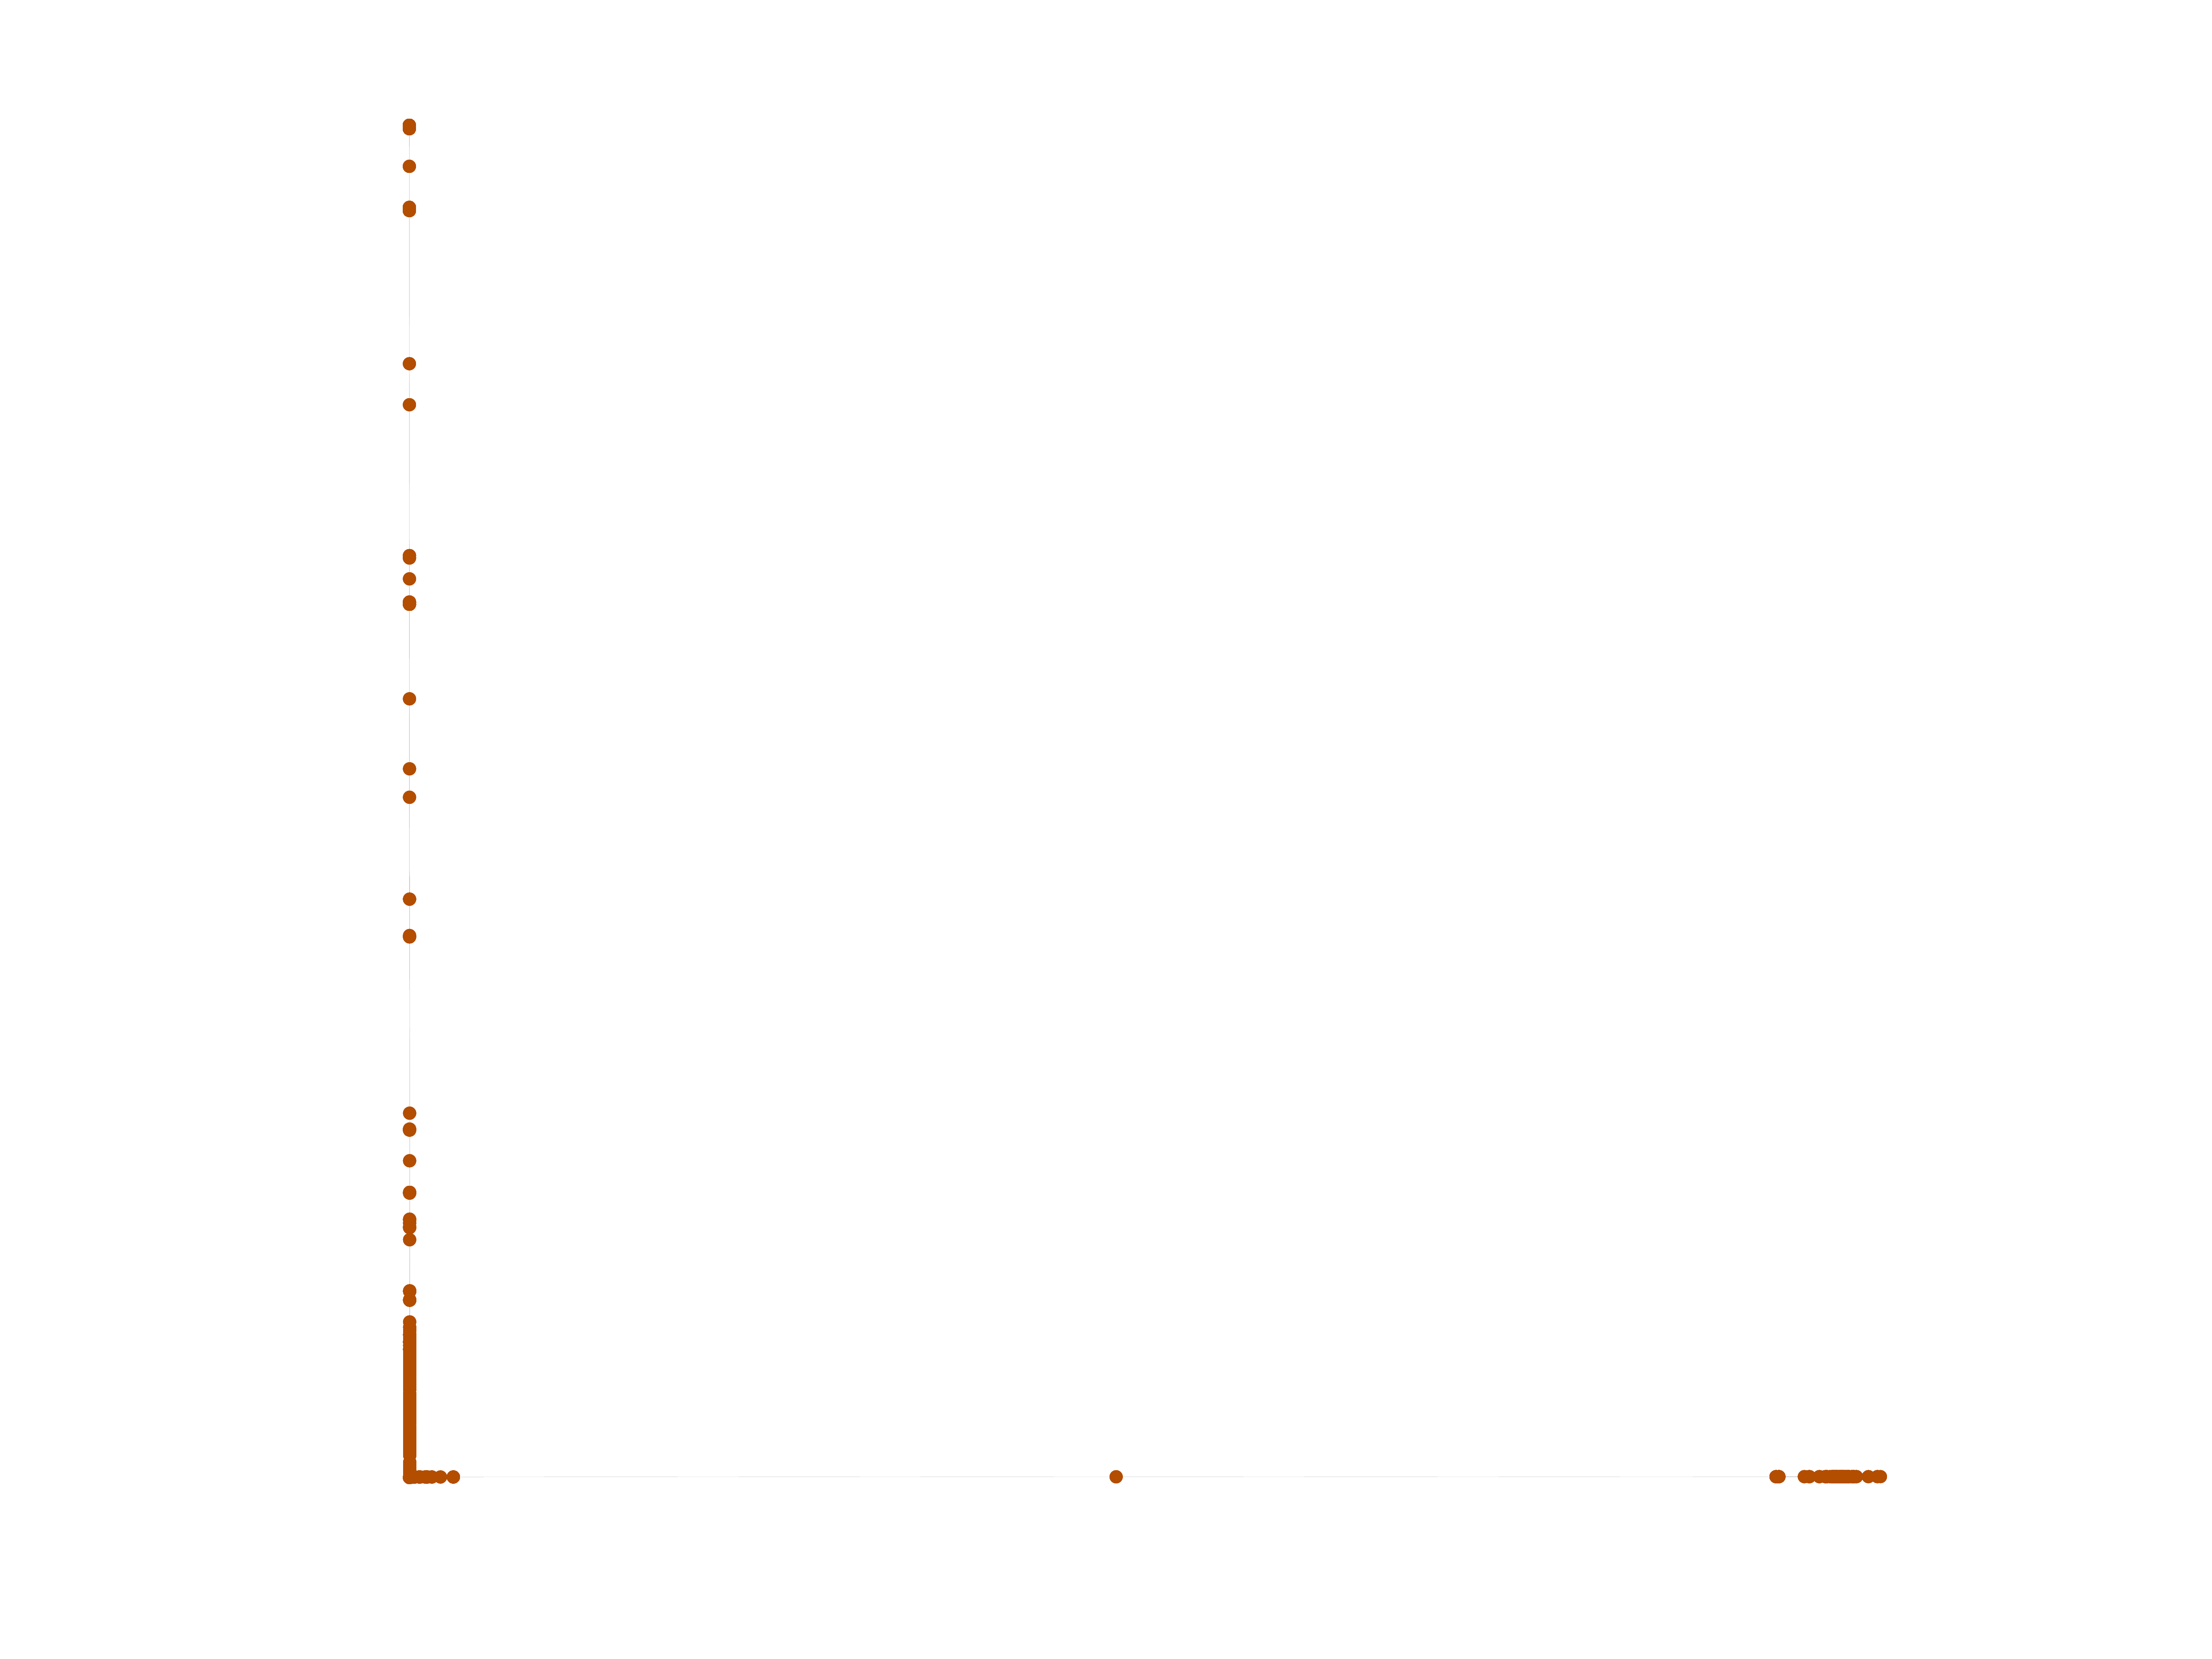
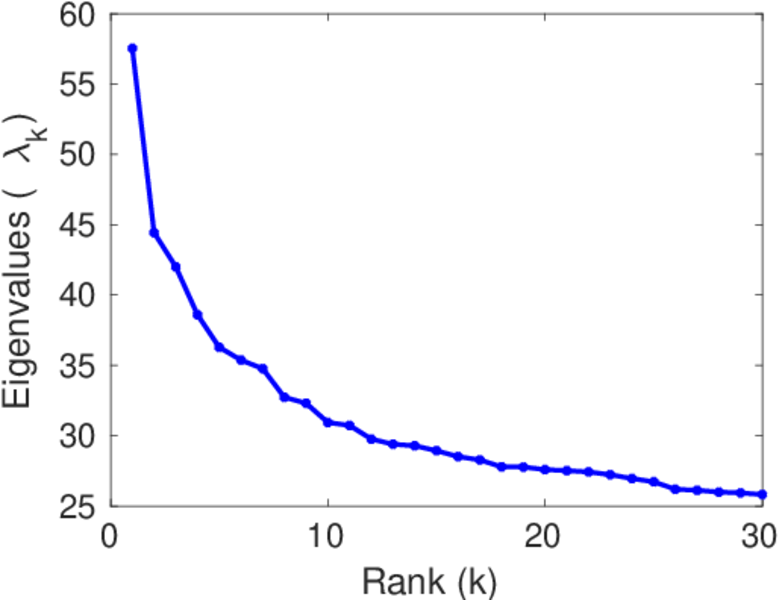
Matrix decompositions plots


Downloads
References
|
[1]
|
Jérôme Kunegis.
KONECT – The Koblenz Network Collection.
In Proc. Int. Conf. on World Wide Web Companion, pages
1343–1350, 2013.
[ http ]
|
 KONECT ‣ Networks ‣
Buy Me a Coffee
KONECT ‣ Networks ‣
Buy Me a Coffee