Wikipedia dynamic (de)
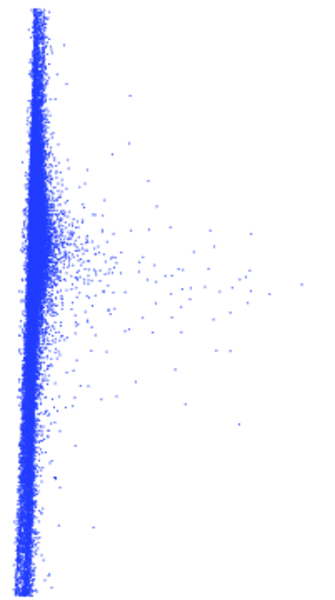
This network shows the evolution of hyperlinks between articles of the German
Wikipedia. The nodes represent articles. An edge indicates that a hyperlink was
added or removed depending on the edge weight (−1 for removal or +1 for
addition).
Metadata
Statistics
| Size | n = | 2,166,669
|
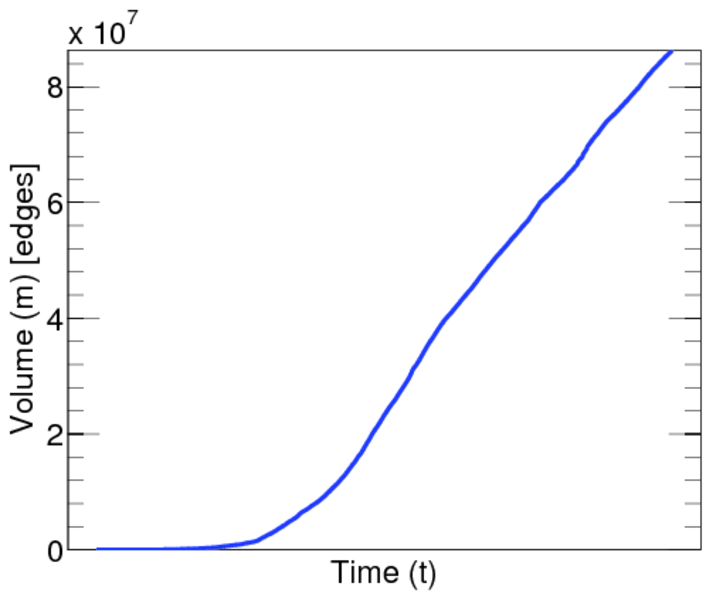
| Volume | m = | 86,337,879
|
| Unique edge count | m̿ = | 31,105,755
|
| Loop count | l = | 2,764
|
| Wedge count | s = | 69,396,476,987
|
| Claw count | z = | 293,022,808,383,642
|
| Cross count | x = | 3,823,007,956,678,213,120
|
| Triangle count | t = | 169,876,249
|
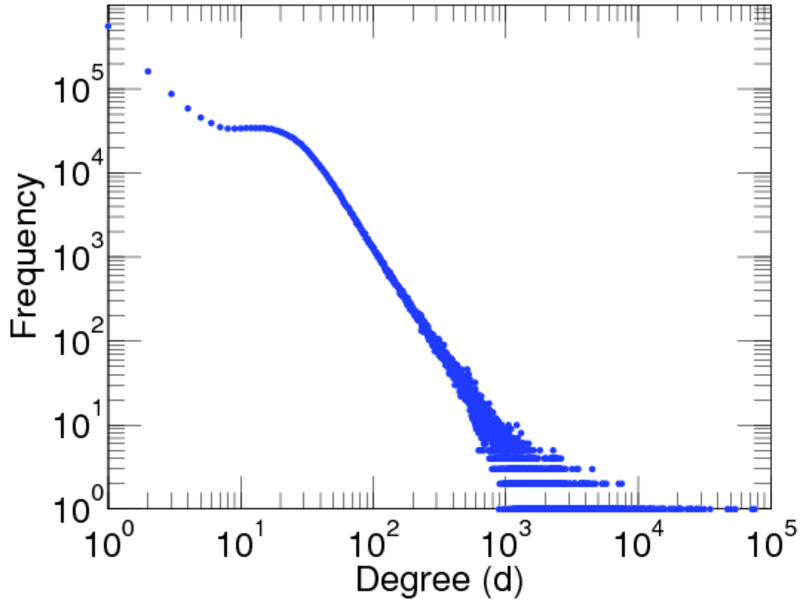
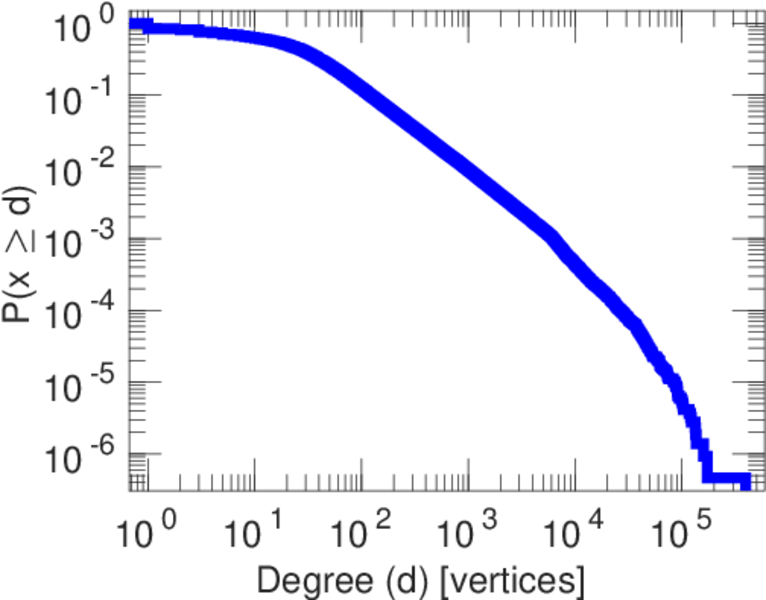
| Maximum degree | dmax = | 394,371
|
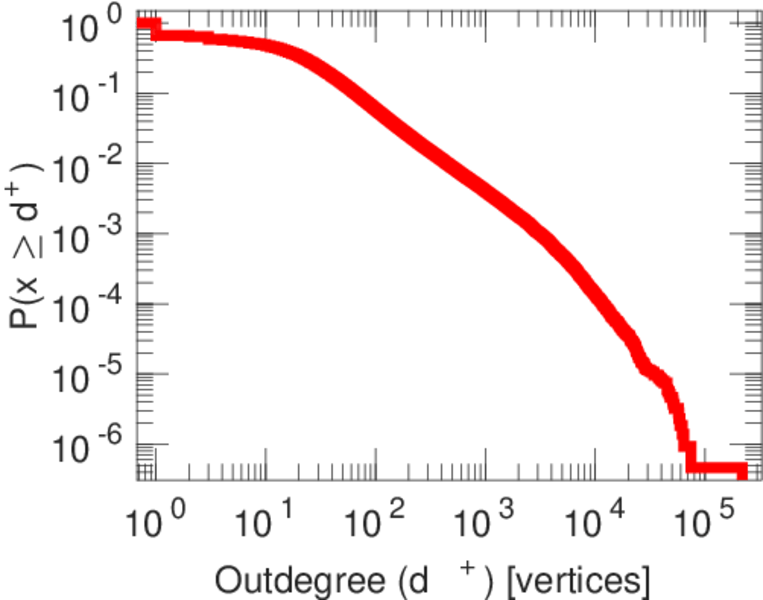
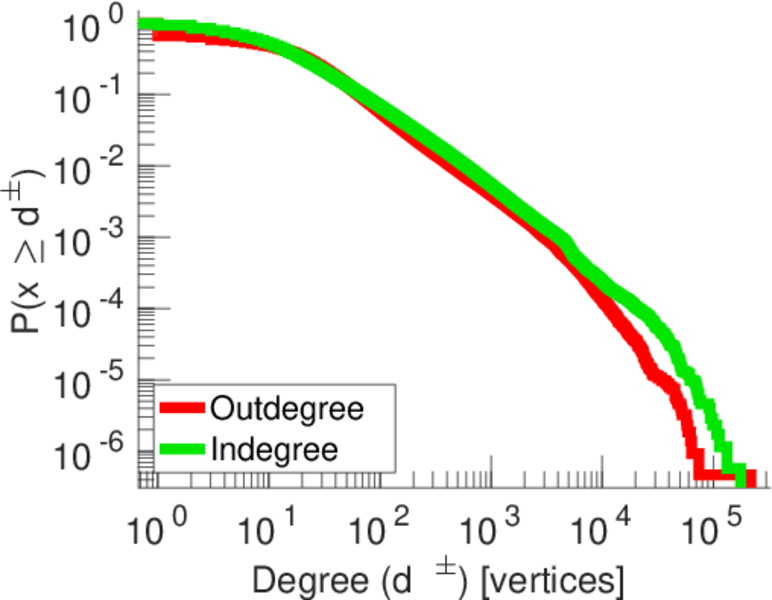
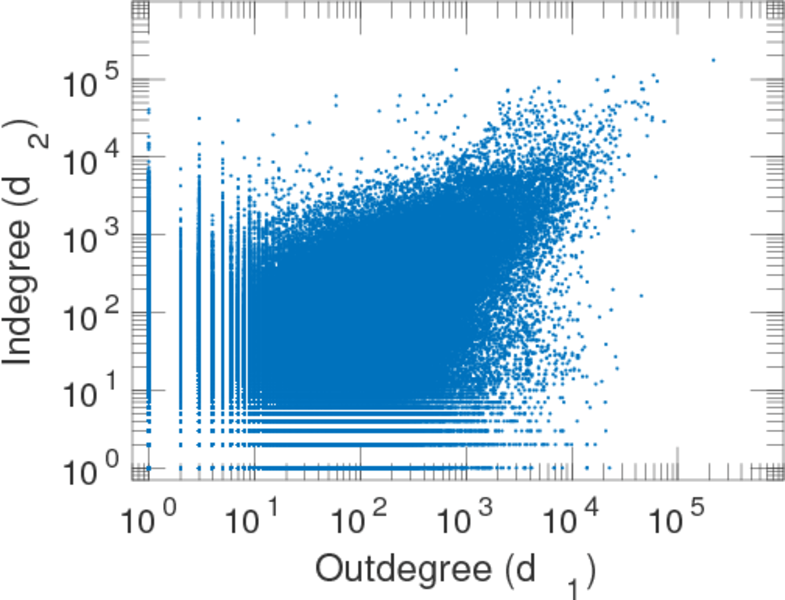
| Maximum outdegree | d+max = | 218,465
|
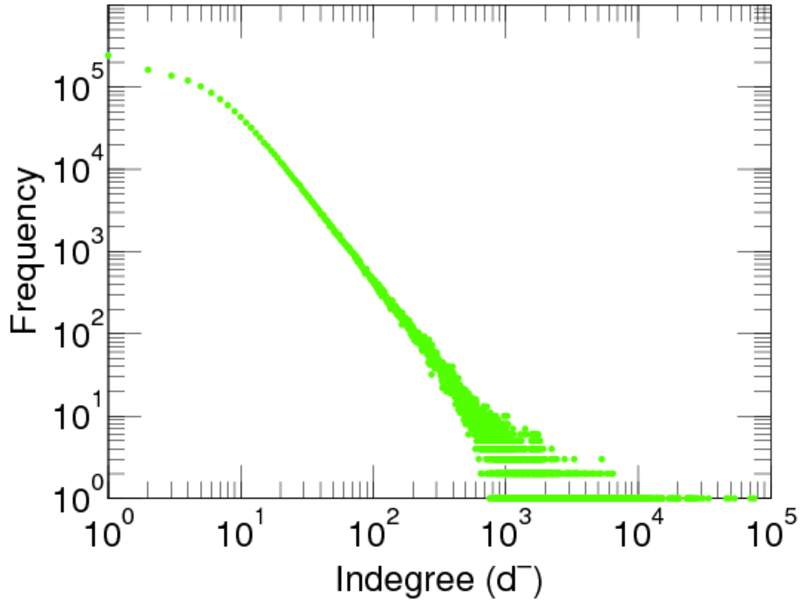
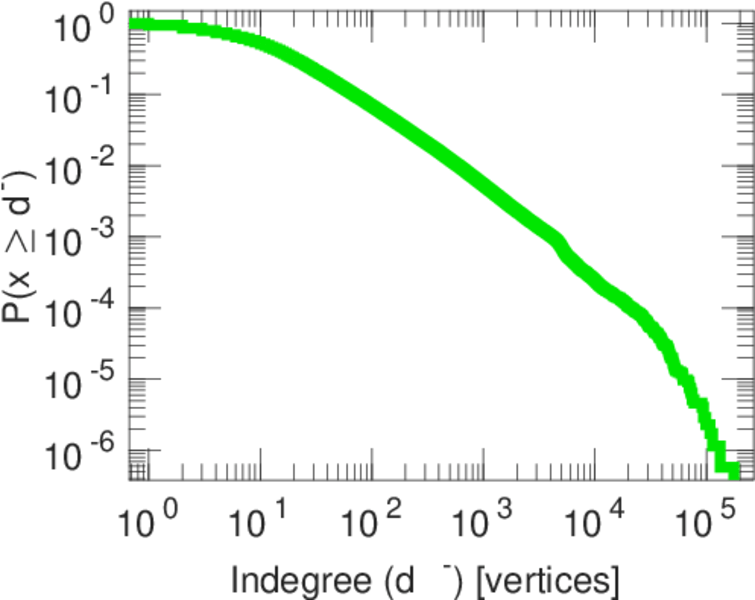
| Maximum indegree | d−max = | 175,906
|
| Average degree | d = | 79.696 4
|
| Fill | p = | 6.671 27 × 10−6
|
| Average edge multiplicity | m̃ = | 2.775 62
|
| Size of LCC | N = | 2,165,679
|
| Size of LSCC | Ns = | 1,464,096
|
| Relative size of LSCC | Nrs = | 0.675 736
|
| Diameter | δ = | 10
|
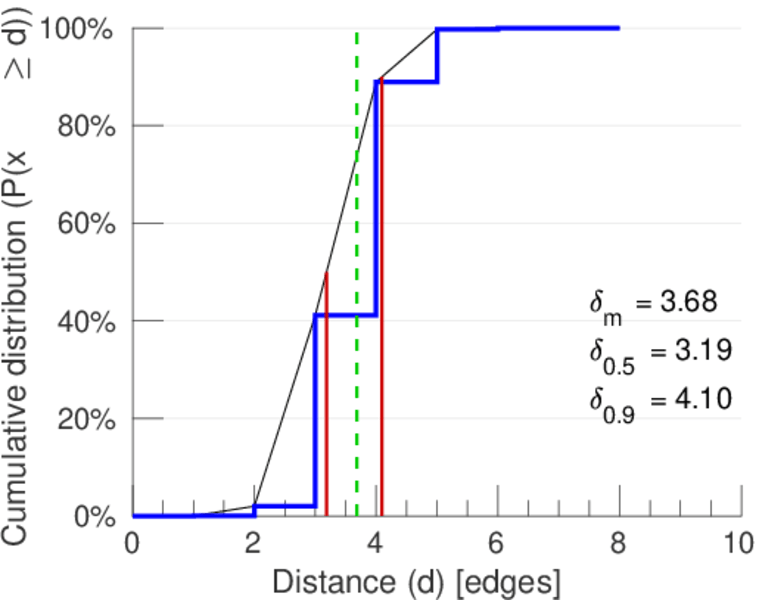
| 50-Percentile effective diameter | δ0.5 = | 3.186 15
|
| 90-Percentile effective diameter | δ0.9 = | 4.097 19
|
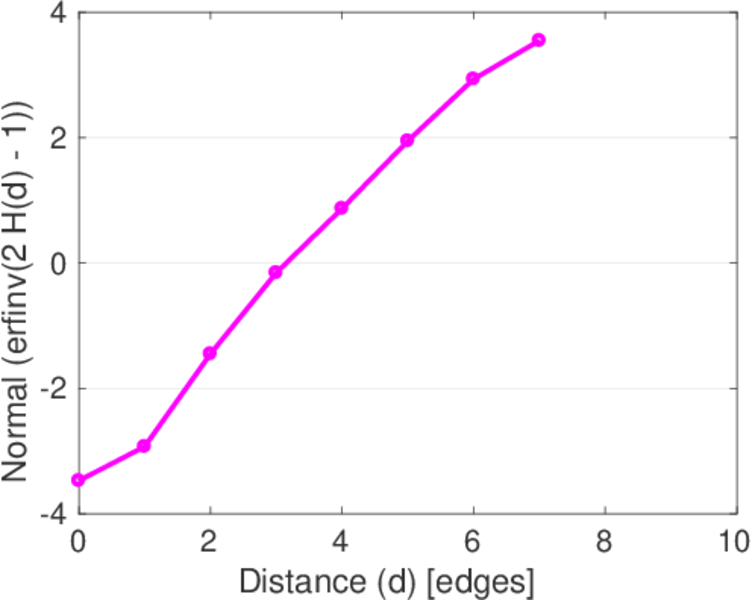
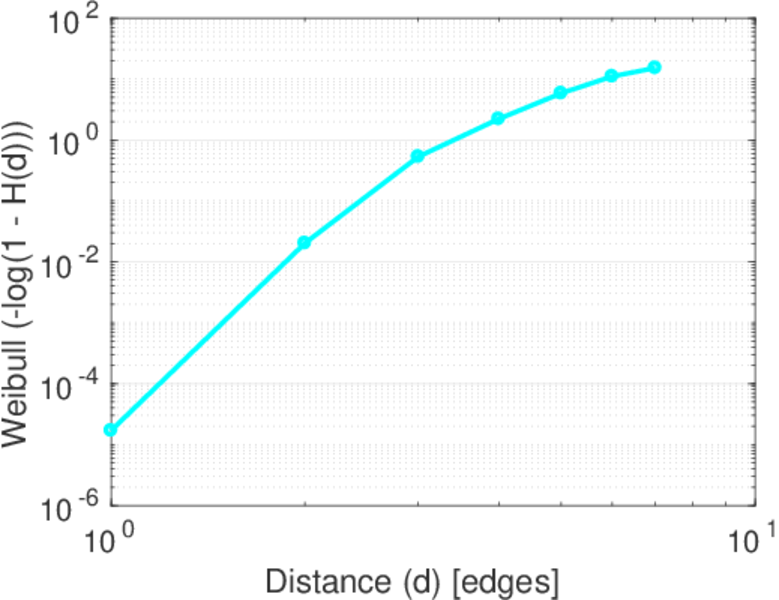
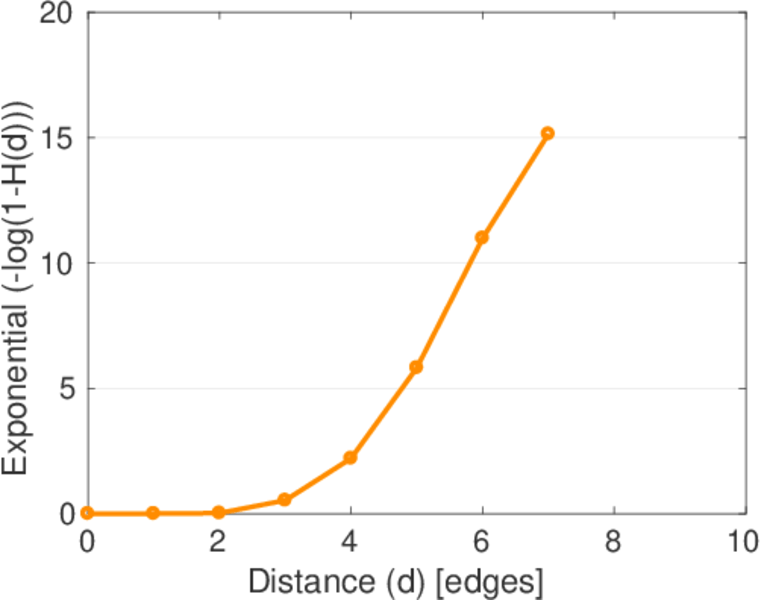
| Median distance | δM = | 4
|
| Mean distance | δm = | 3.682 59
|
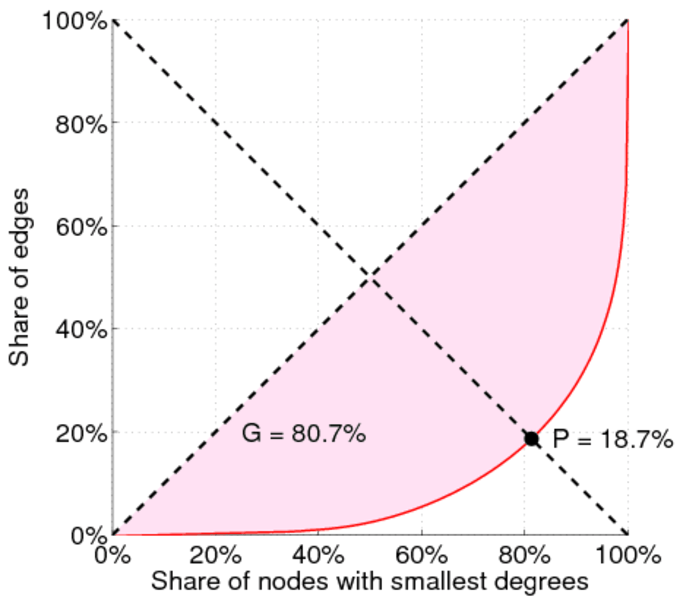
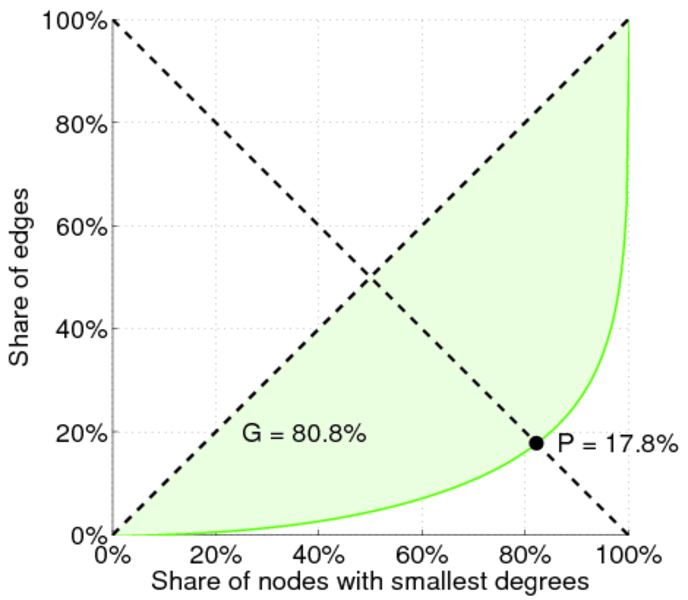
| Gini coefficient | G = | 0.730 492
|
| Balanced inequality ratio | P = | 0.227 484
|
| Outdegree balanced inequality ratio | P+ = | 0.245 332
|
| Indegree balanced inequality ratio | P− = | 0.197 906
|
| Relative edge distribution entropy | Her = | 0.903 552
|
| Power law exponent | γ = | 1.499 69
|
| Degree assortativity | ρ = | −0.036 670 9
|
| Degree assortativity p-value | pρ = | 0.000 00
|
| Clustering coefficient | c = | 0.007 343 73
|
| Directed clustering coefficient | c± = | 0.023 497 1
|
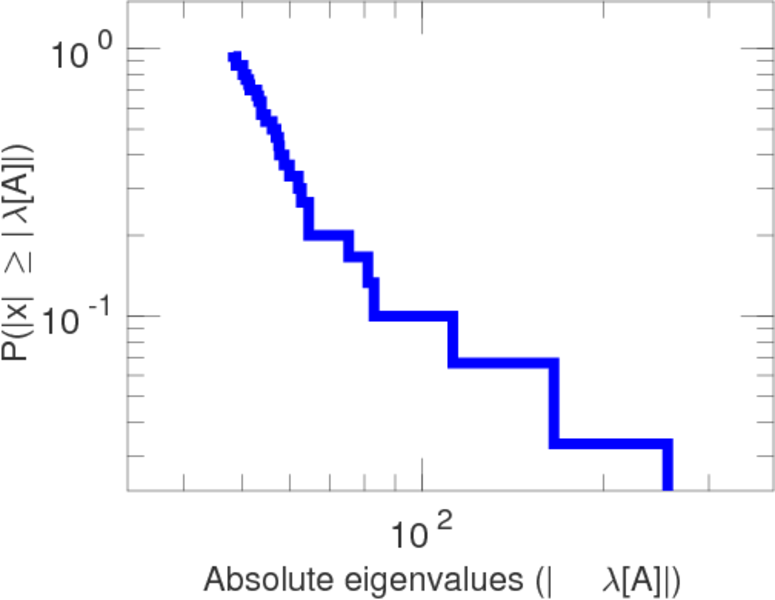
| Spectral norm | α = | 579.773
|
| Operator 2-norm | ν = | 396.931
|
| Reciprocity | y = | 0.174 983
|
| Non-bipartivity | bA = | 0.386 372
|
| Normalized non-bipartivity | bN = | 0.022 280 9
|
| Controllability | C = | 824,154
|
| Relative controllability | Cr = | 0.381 674
|
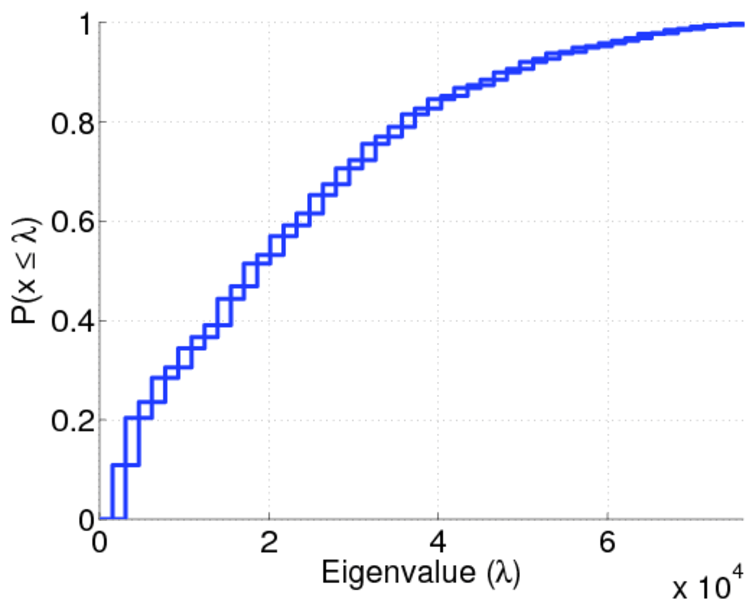
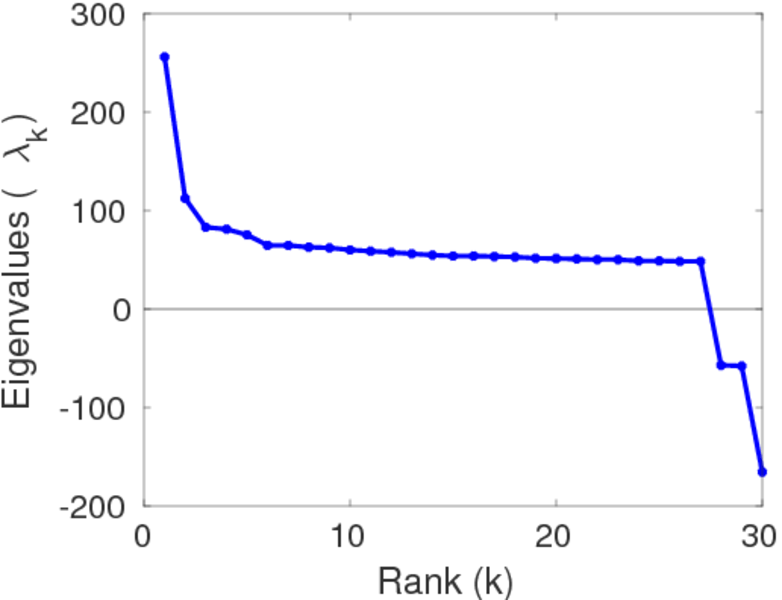
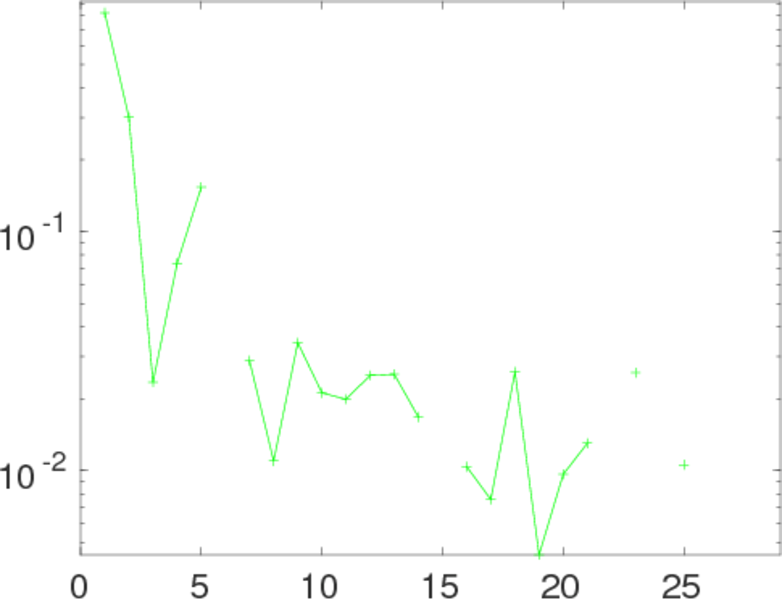
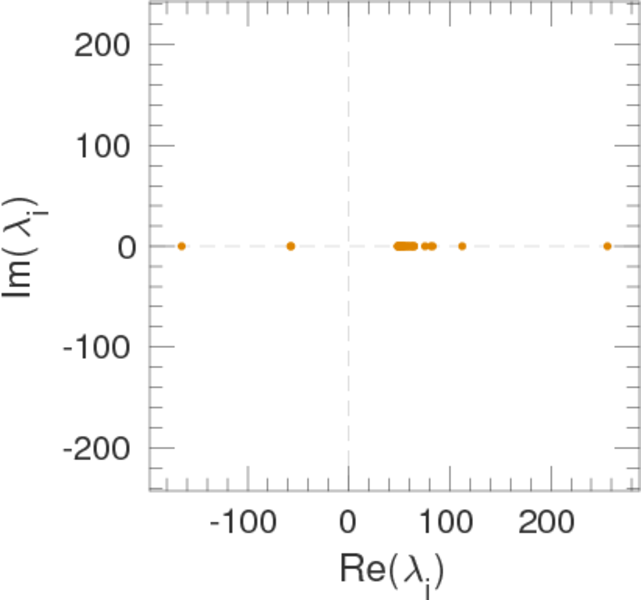
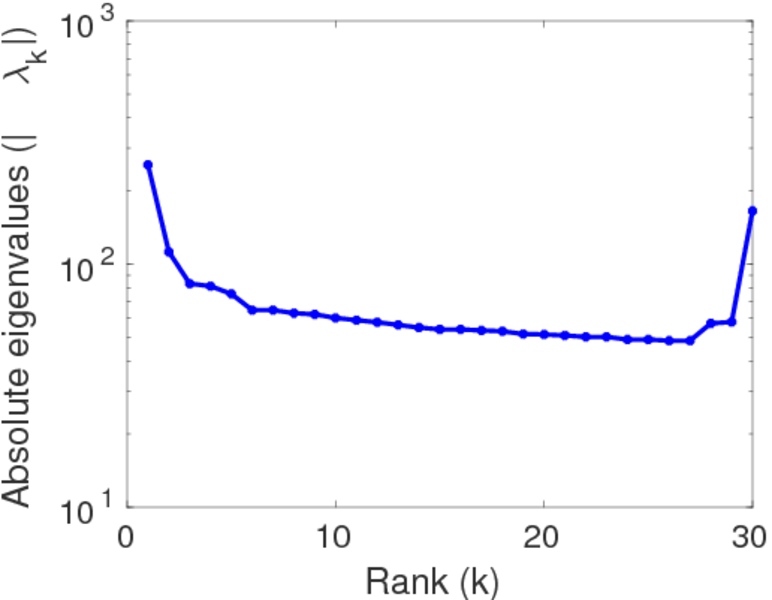
Plots


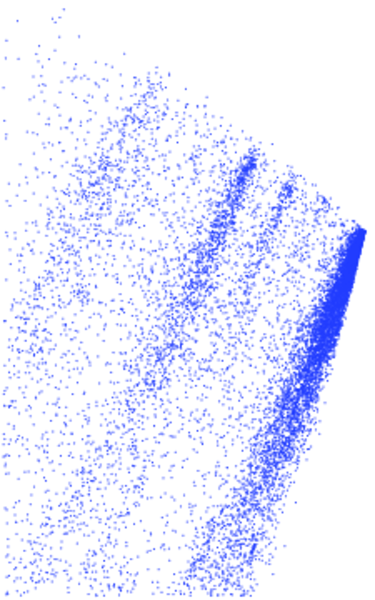
Matrix decompositions plots


Downloads
References
|
[1]
|
Jérôme Kunegis.
KONECT – The Koblenz Network Collection.
In Proc. Int. Conf. on World Wide Web Companion, pages
1343–1350, 2013.
[ http ]
|
|
[2]
|
Julia Preusse, Jérôme Kunegis, Matthias Thimm, Thomas Gottron, and Steffen
Staab.
Structural dynamics of knowledge networks.
In Proc. Int. Conf. on Weblogs and Soc. Media, 2013.
|
 KONECT ‣ Networks ‣
Buy Me a Coffee
KONECT ‣ Networks ‣
Buy Me a Coffee