Wikipedia dynamic (fr)
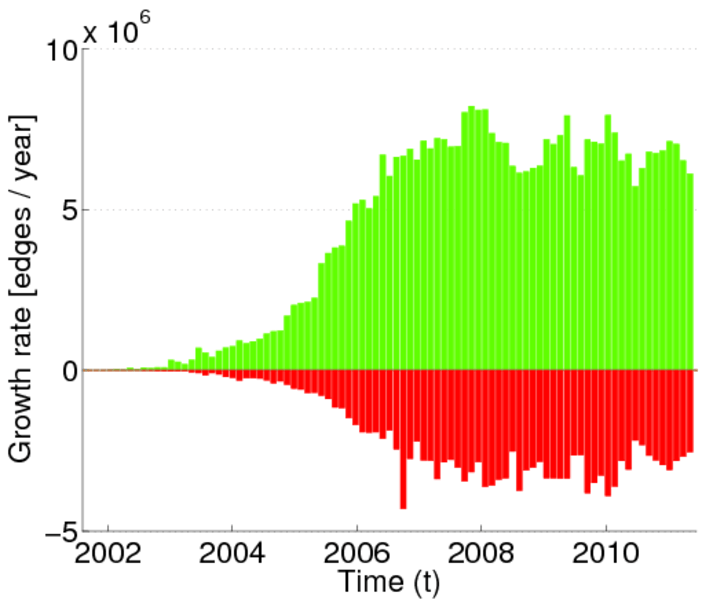
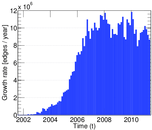
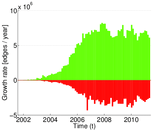
This network shows the evolution of hyperlinks between articles of the French
Wikipedia. The nodes represent articles. An edge indicates that a hyperlink was
added or removed depending on the edge weight (−1 for removal or +1 for
addition).
Metadata
Statistics
| Size | n = | 2,212,682
|
| Volume | m = | 59,008,831
|
| Unique edge count | m̿ = | 24,440,537
|
| Loop count | l = | 3,077
|
| Wedge count | s = | 84,717,021,383
|
| Claw count | z = | 673,558,281,471,946
|
| Cross count | x = | 1.276 03 × 1019
|
| Triangle count | t = | 139,637,311
|
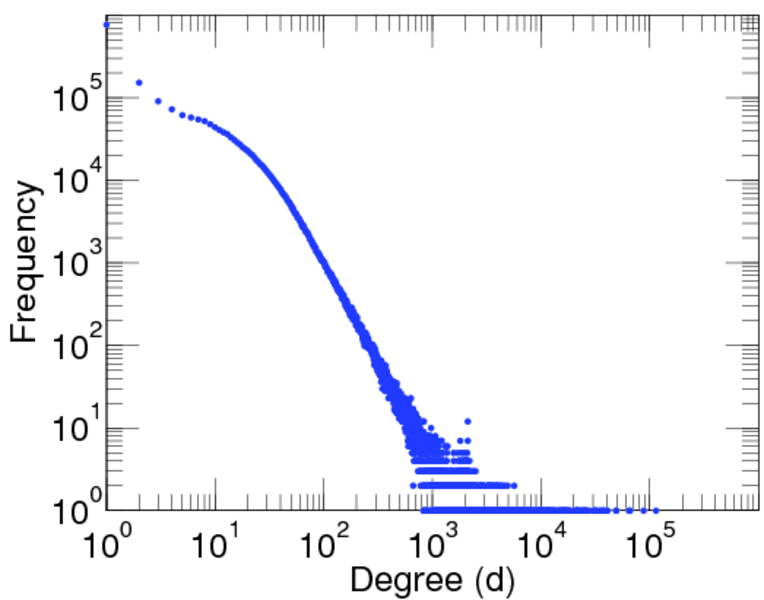
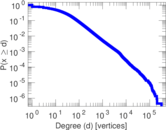
| Maximum degree | dmax = | 321,458
|
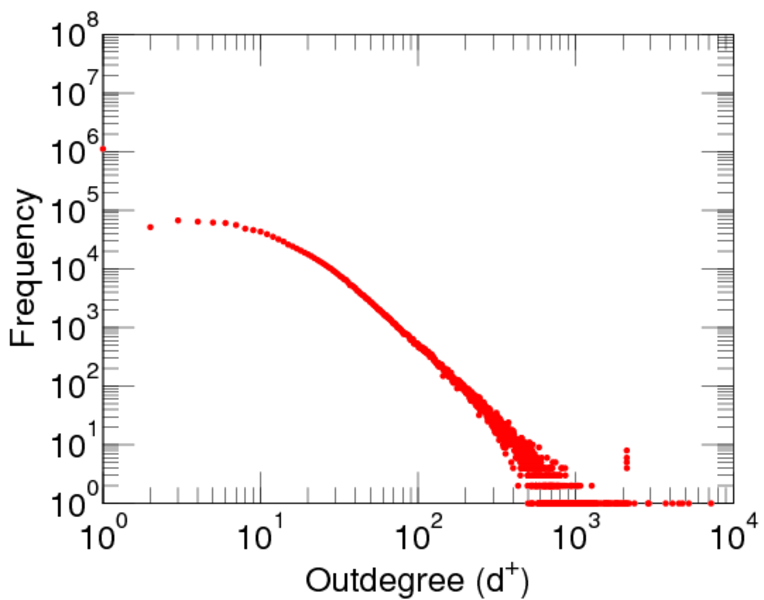
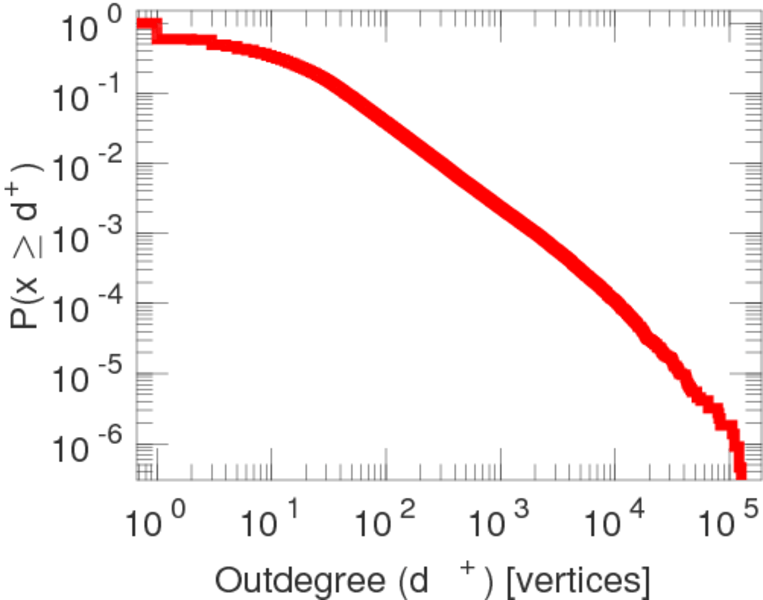
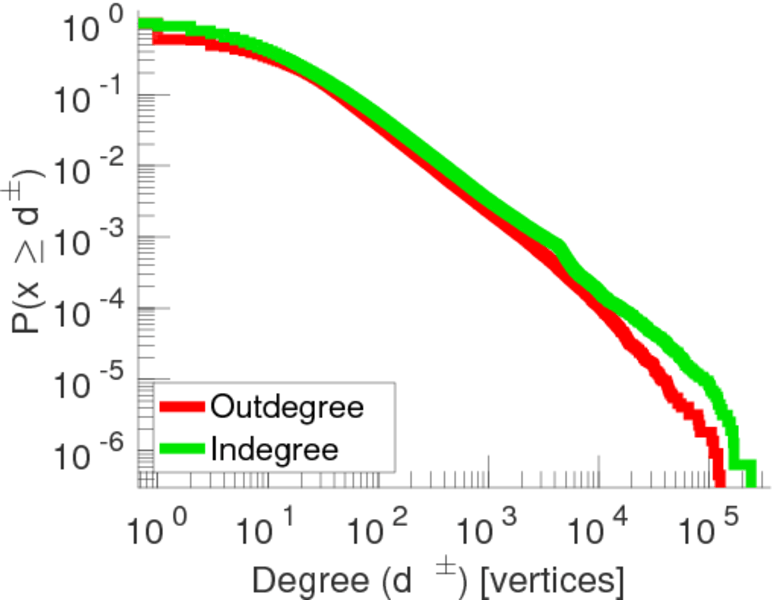
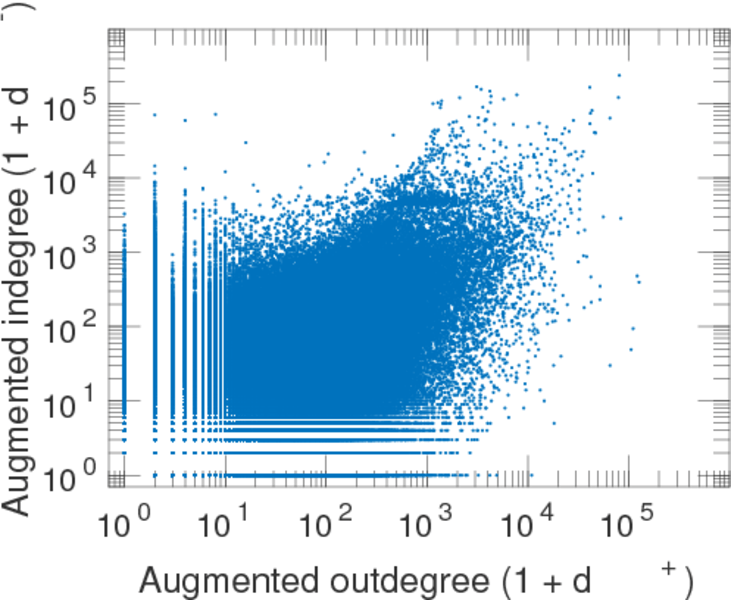
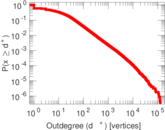
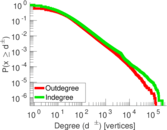
| Maximum outdegree | d+max = | 126,733
|
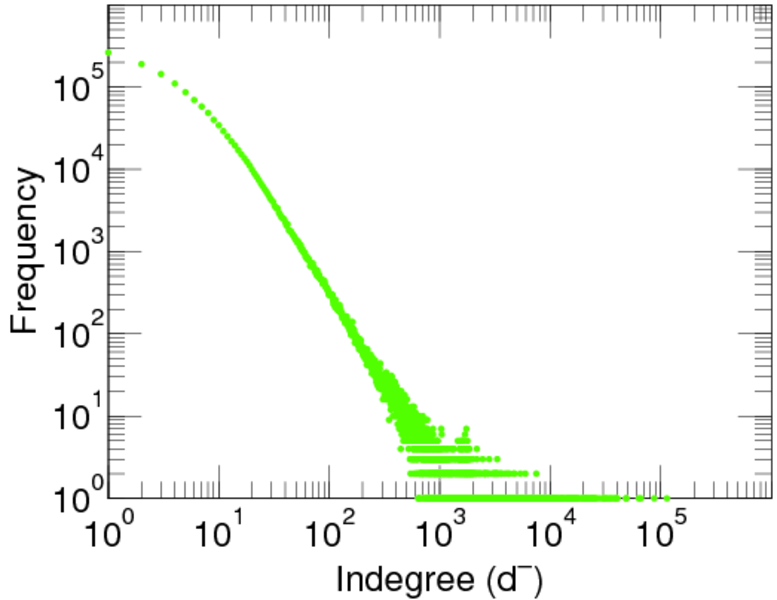
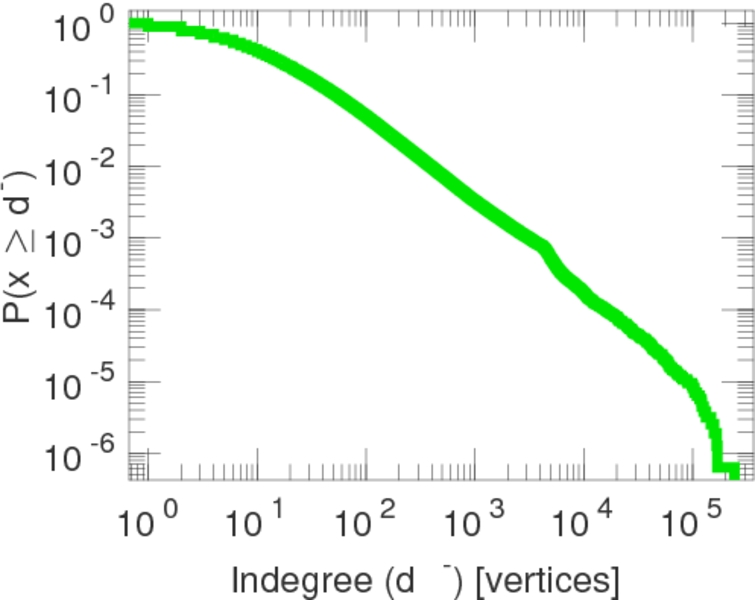
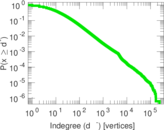
| Maximum indegree | d−max = | 240,733
|
| Average degree | d = | 53.336 9
|
| Fill | p = | 5.025 16 × 10−6
|
| Average edge multiplicity | m̃ = | 2.414 38
|
| Size of LCC | N = | 2,208,840
|
| Size of LSCC | Ns = | 1,323,072
|
| Relative size of LSCC | Nrs = | 0.597 949
|
| Diameter | δ = | 12
|
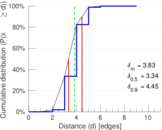
| 50-Percentile effective diameter | δ0.5 = | 3.335 31
|
| 90-Percentile effective diameter | δ0.9 = | 4.454 42
|
| Median distance | δM = | 4
|
| Mean distance | δm = | 3.830 41
|
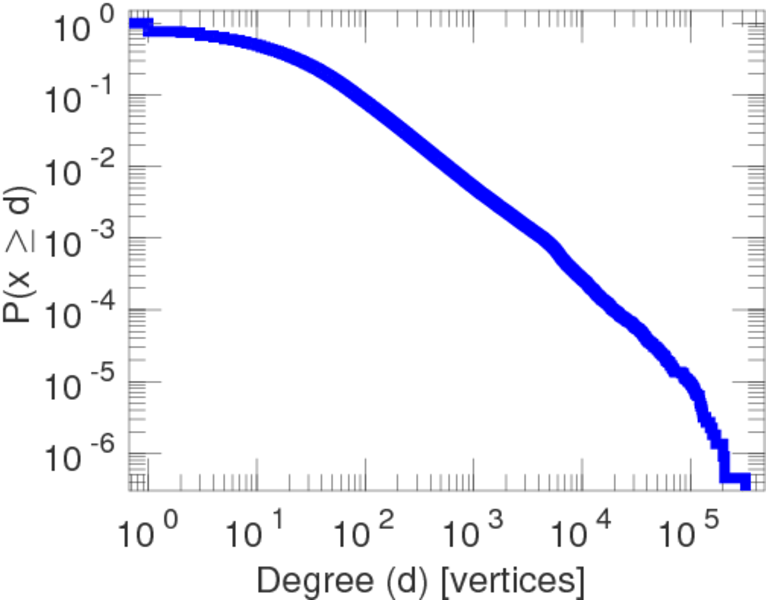
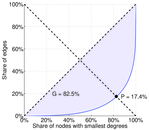
| Gini coefficient | G = | 0.774 229
|
| Balanced inequality ratio | P = | 0.197 331
|
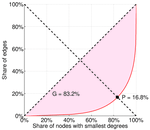
| Outdegree balanced inequality ratio | P+ = | 0.211 843
|
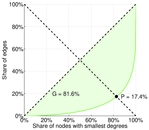
| Indegree balanced inequality ratio | P− = | 0.194 163
|
| Relative edge distribution entropy | Her = | 0.883 483
|
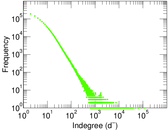
| Power law exponent | γ = | 1.614 91
|
| Tail power law exponent | γt = | 2.391 00
|
| Degree assortativity | ρ = | −0.045 824 8
|
| Degree assortativity p-value | pρ = | 0.000 00
|
| Clustering coefficient | c = | 0.004 944 84
|
| Directed clustering coefficient | c± = | 0.029 457 0
|
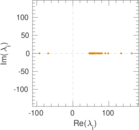
| Spectral norm | α = | 677.907
|
| Operator 2-norm | ν = | 566.281
|
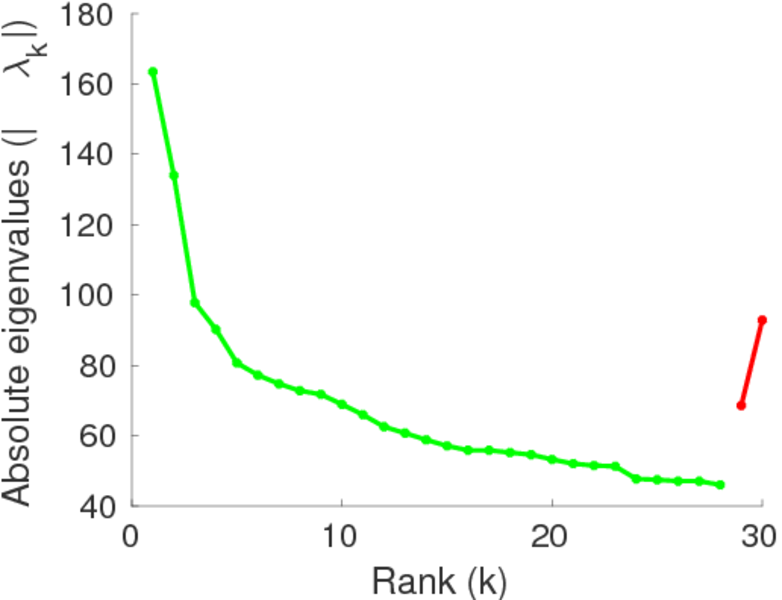
| Cyclic eigenvalue | π = | 163.465
|
| Reciprocity | y = | 0.155 224
|
| Non-bipartivity | bA = | 0.219 874
|
| Normalized non-bipartivity | bN = | 0.019 718 6
|
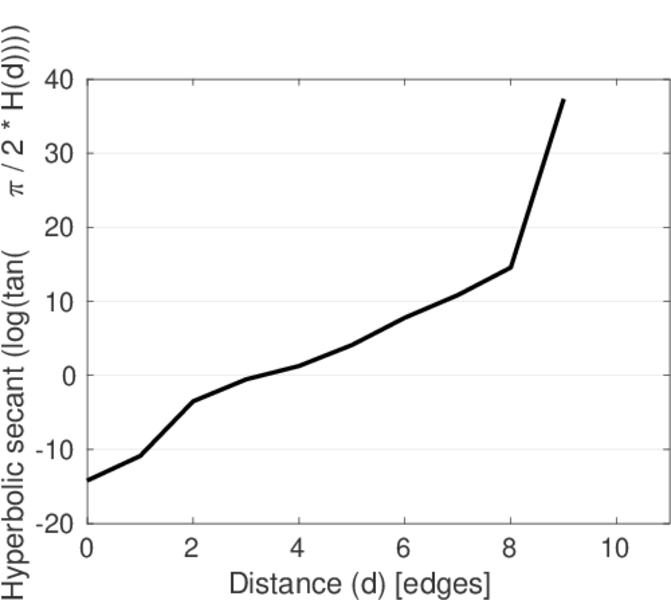
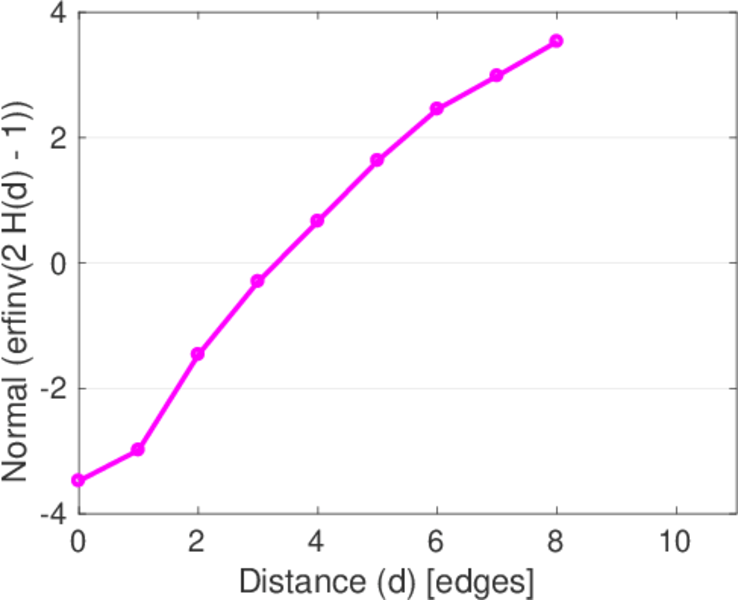
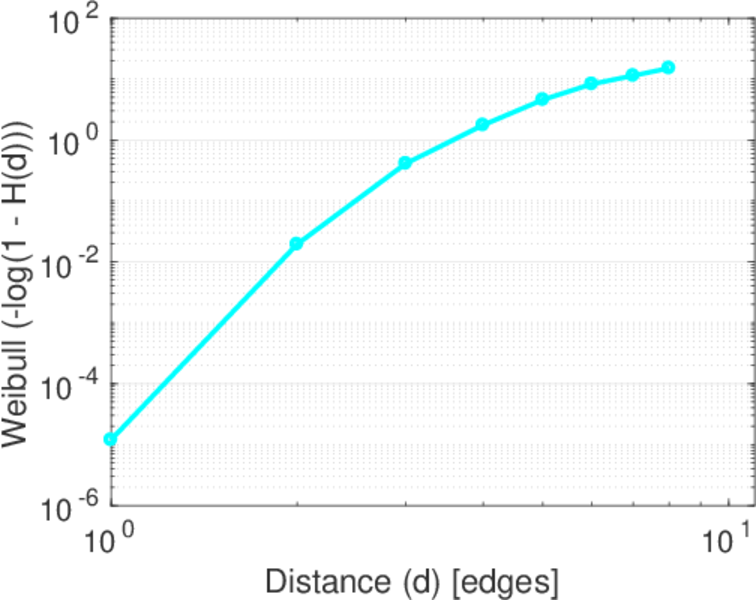
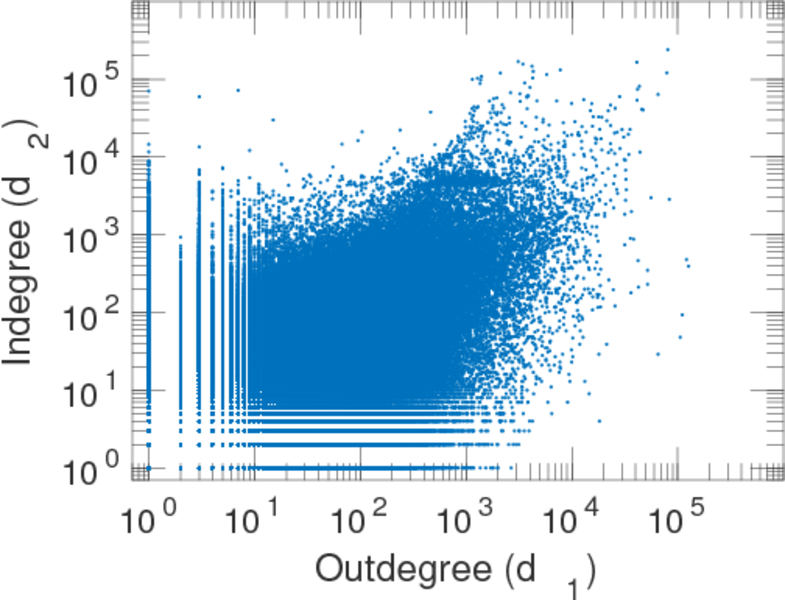
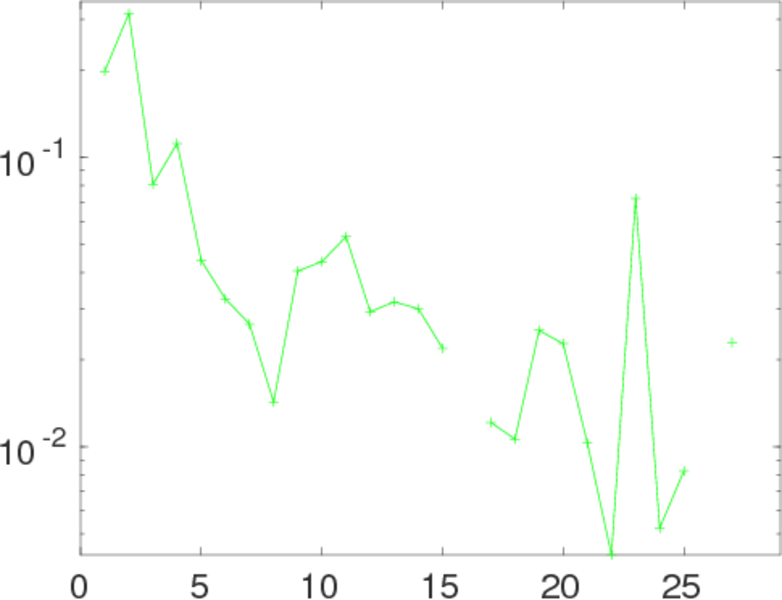
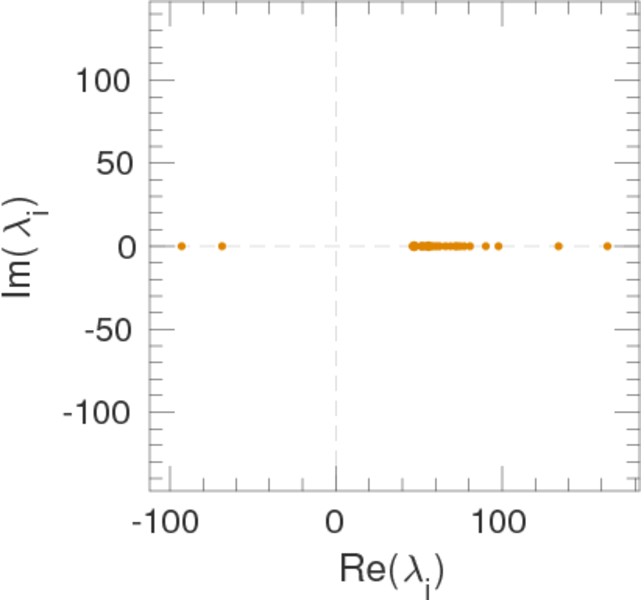
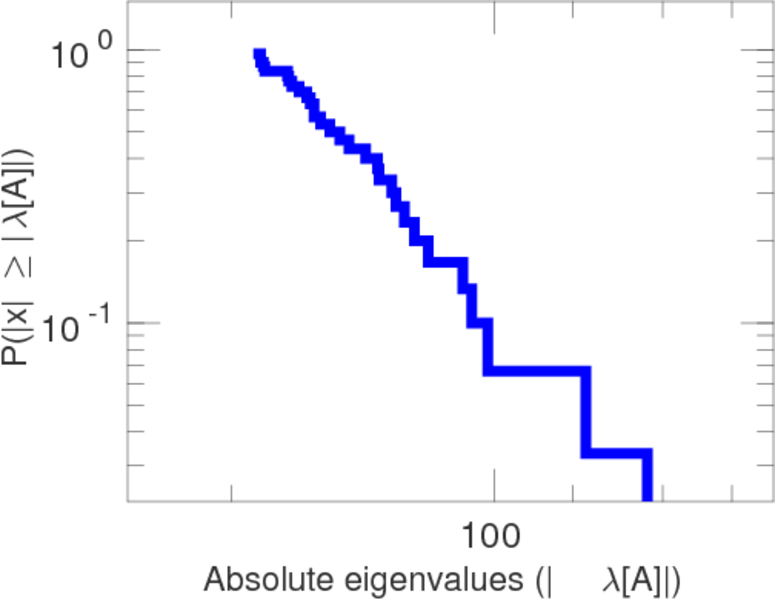
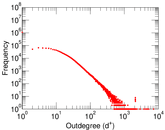
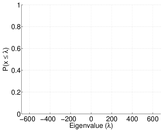
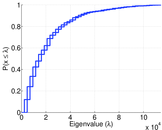
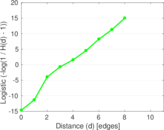
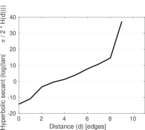
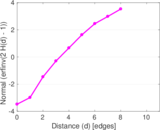
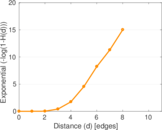
Plots


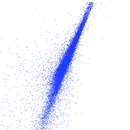


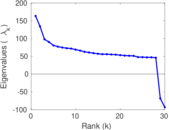
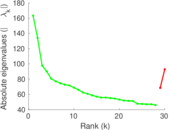
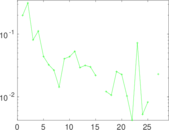
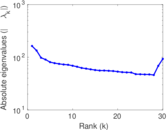
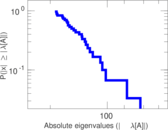
Matrix decompositions plots
Downloads
References
|
[1]
|
Jérôme Kunegis.
KONECT – The Koblenz Network Collection.
In Proc. Int. Conf. on World Wide Web Companion, pages
1343–1350, 2013.
[ http ]
|
|
[2]
|
Julia Preusse, Jérôme Kunegis, Matthias Thimm, Thomas Gottron, and Steffen
Staab.
Structural dynamics of knowledge networks.
In Proc. Int. Conf. on Weblogs and Soc. Media, 2013.
|
 KONECT ‣ Networks ‣
Buy Me a Coffee
KONECT ‣ Networks ‣
Buy Me a Coffee