Wikipedia dynamic (it)
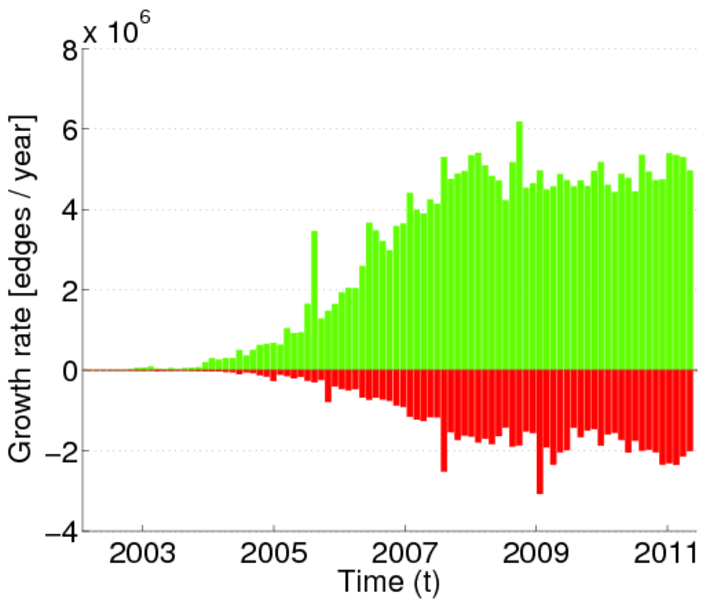
This network shows the evolution of hyperlinks between articles of the Italian
Wikipedia. The nodes represent articles. An edge indicates that a hyperlink was
added or removed depending on the edge weight (−1 for removal or +1 for
addition).
Metadata
Statistics
| Size | n = | 1,204,009
|
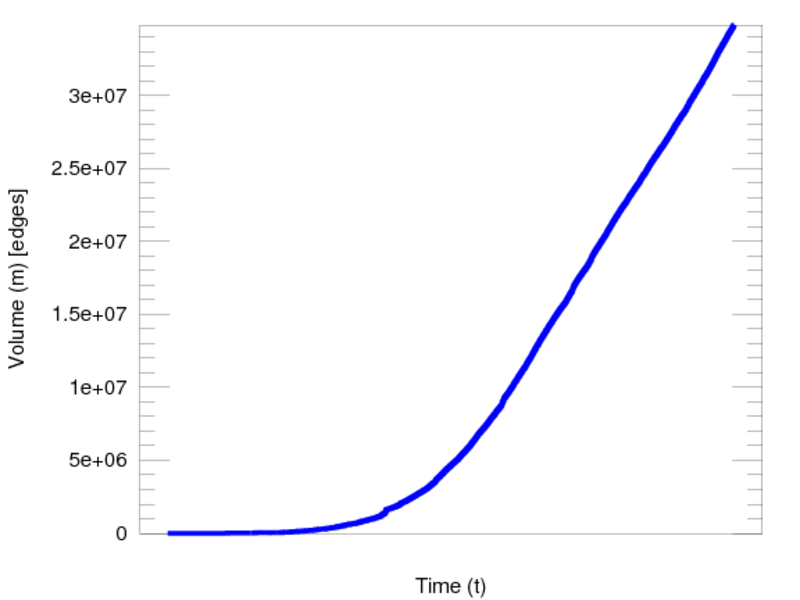
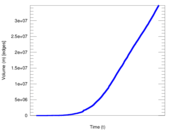
| Volume | m = | 34,826,283
|
| Unique edge count | m̿ = | 17,086,845
|
| Loop count | l = | 1,270
|
| Wedge count | s = | 58,316,691,930
|
| Claw count | z = | 376,622,699,709,806
|
| Cross count | x = | 4,154,912,852,663,083,008
|
| Triangle count | t = | 98,571,145
|
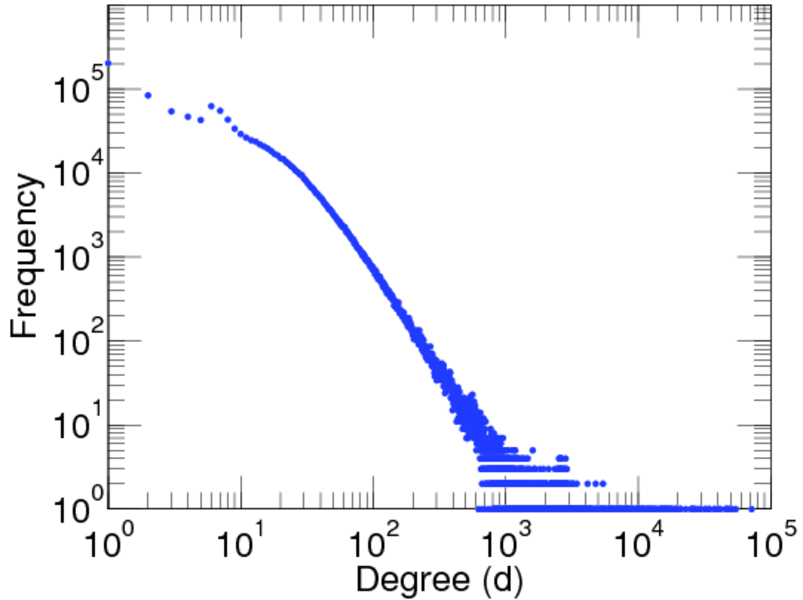
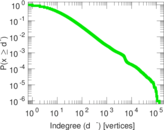
| Maximum degree | dmax = | 140,949
|
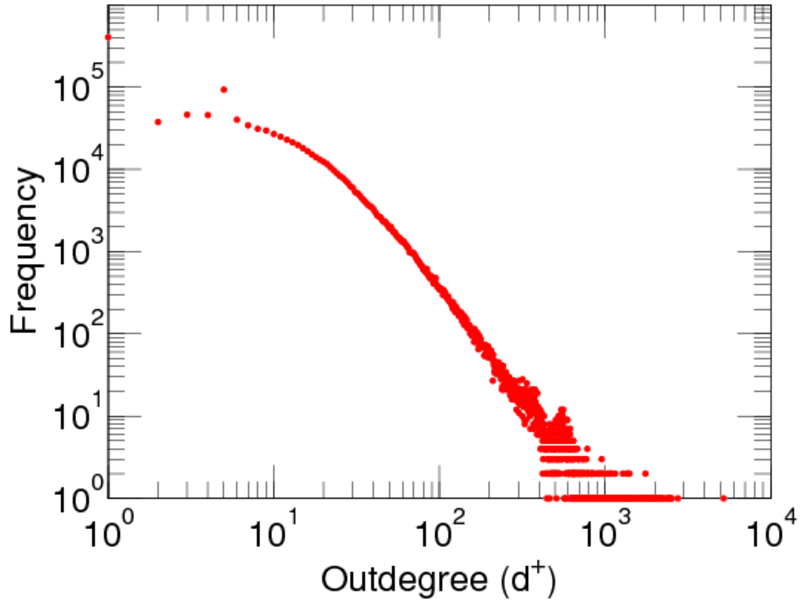
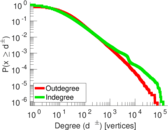
| Maximum outdegree | d+max = | 76,631
|
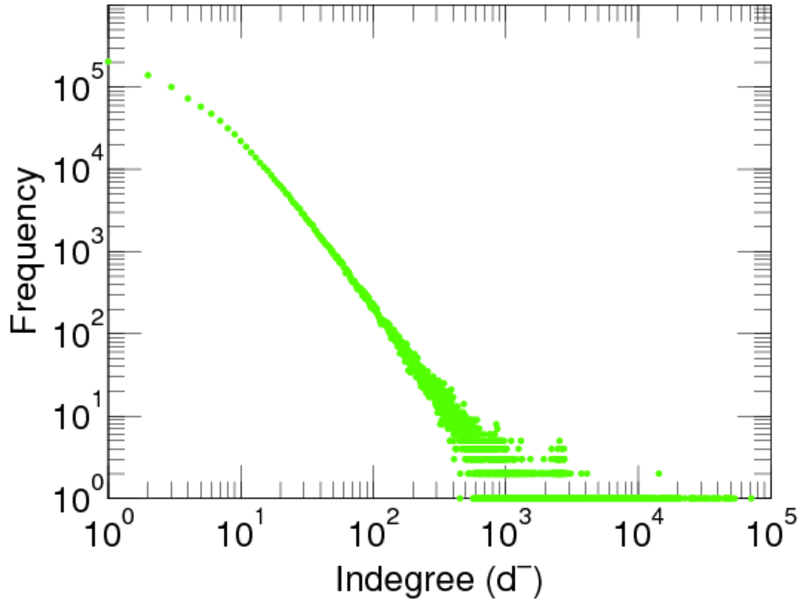
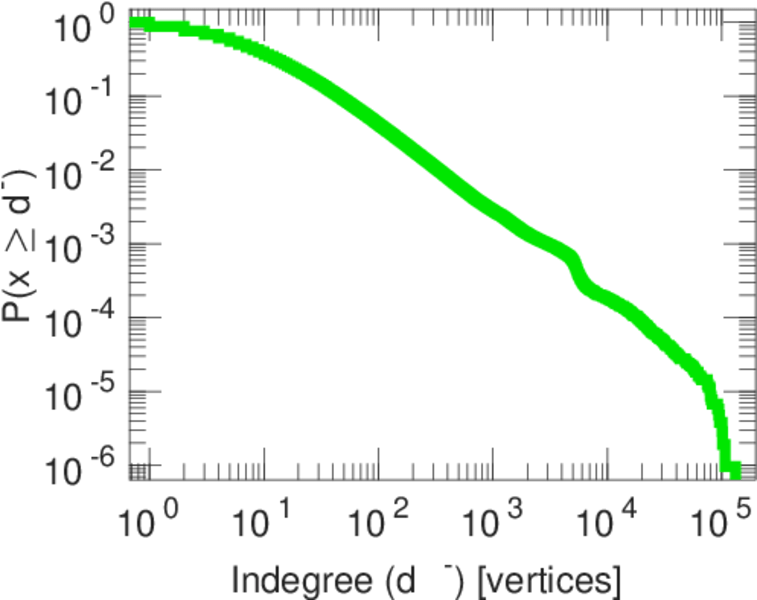
| Maximum indegree | d−max = | 131,066
|
| Average degree | d = | 57.850 5
|
| Fill | p = | 1.184 83 × 10−5
|
| Average edge multiplicity | m̃ = | 2.038 19
|
| Size of LCC | N = | 1,202,469
|
| Size of LSCC | Ns = | 920,293
|
| Relative size of LSCC | Nrs = | 0.764 357
|
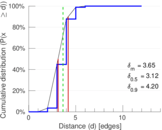
| Diameter | δ = | 16
|
| 50-Percentile effective diameter | δ0.5 = | 3.121 06
|
| 90-Percentile effective diameter | δ0.9 = | 4.200 78
|
| Median distance | δM = | 4
|
| Mean distance | δm = | 3.650 98
|
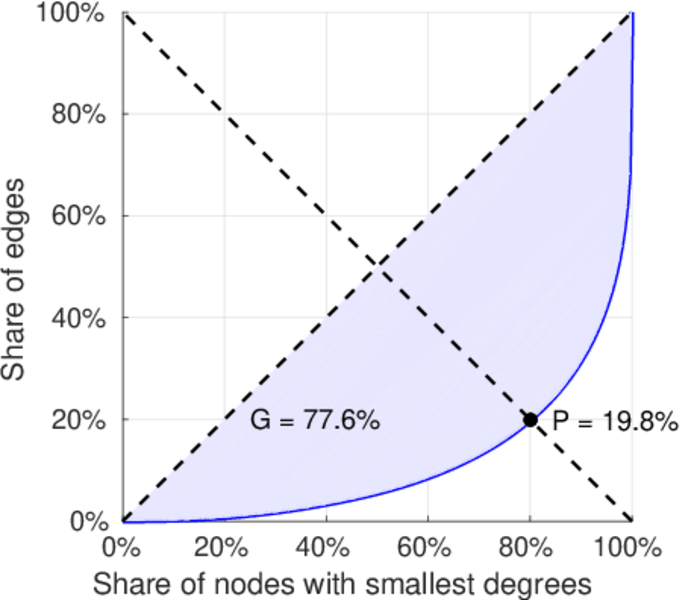
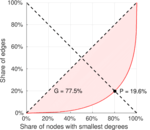
| Gini coefficient | G = | 0.735 612
|
| Balanced inequality ratio | P = | 0.216 412
|
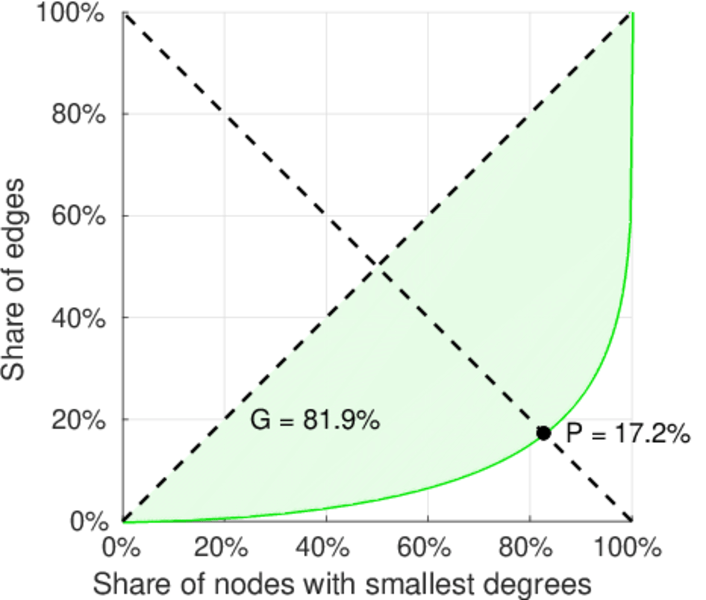
| Outdegree balanced inequality ratio | P+ = | 0.230 946
|
| Indegree balanced inequality ratio | P− = | 0.184 752
|
| Relative edge distribution entropy | Her = | 0.887 405
|
| Power law exponent | γ = | 1.481 98
|
| Tail power law exponent | γt = | 2.411 00
|
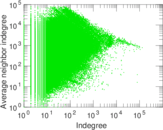
| Degree assortativity | ρ = | −0.074 786 8
|
| Degree assortativity p-value | pρ = | 0.000 00
|
| Clustering coefficient | c = | 0.005 070 82
|
| Directed clustering coefficient | c± = | 0.034 316 4
|
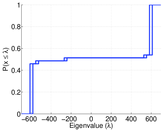
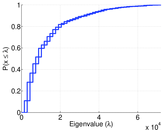
| Spectral norm | α = | 696.272
|
| Operator 2-norm | ν = | 621.980
|
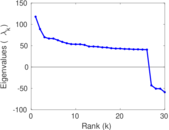
| Cyclic eigenvalue | π = | 117.805
|
| Reciprocity | y = | 0.150 004
|
| Non-bipartivity | bA = | 0.171 205
|
| Normalized non-bipartivity | bN = | 0.019 282 9
|
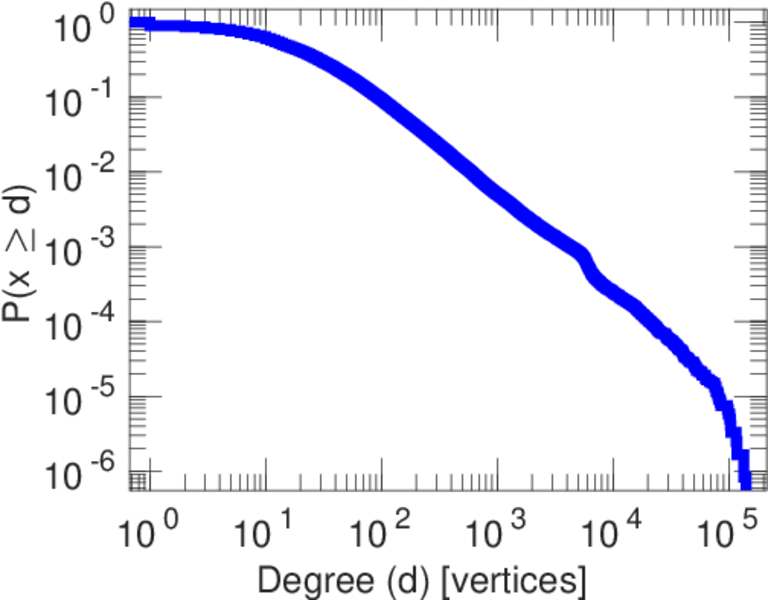
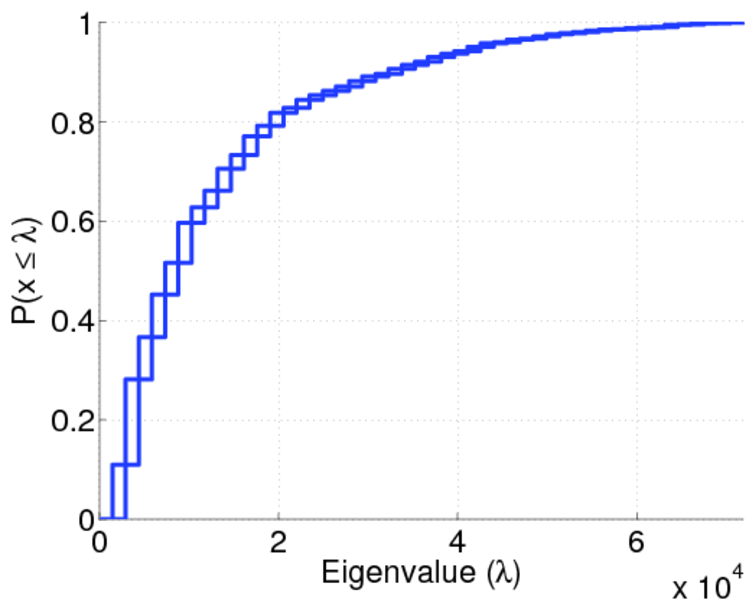
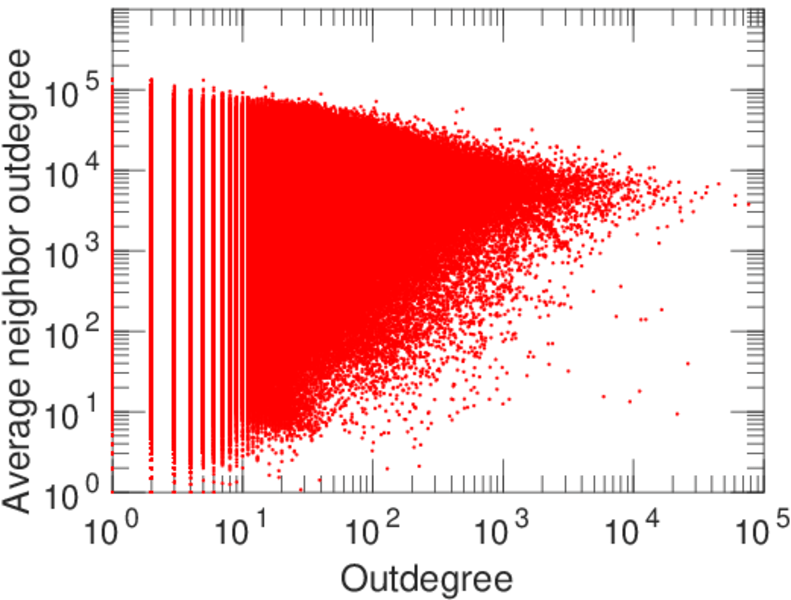
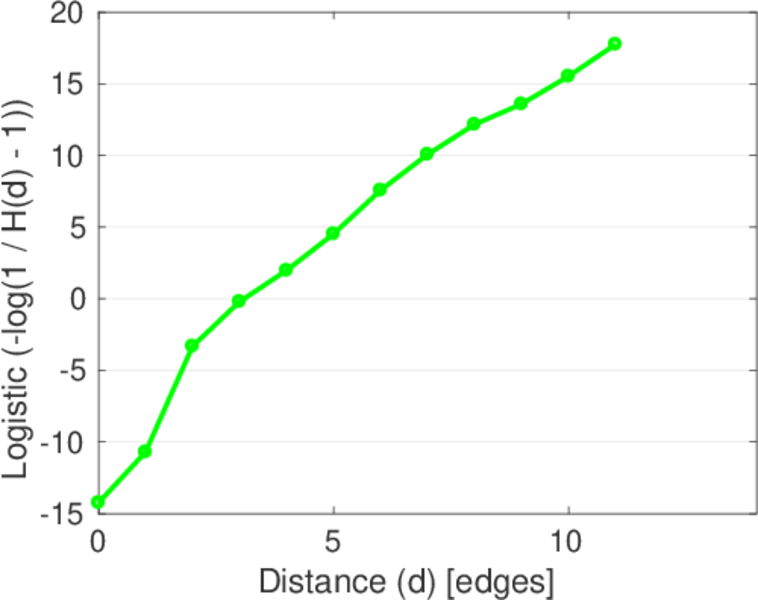
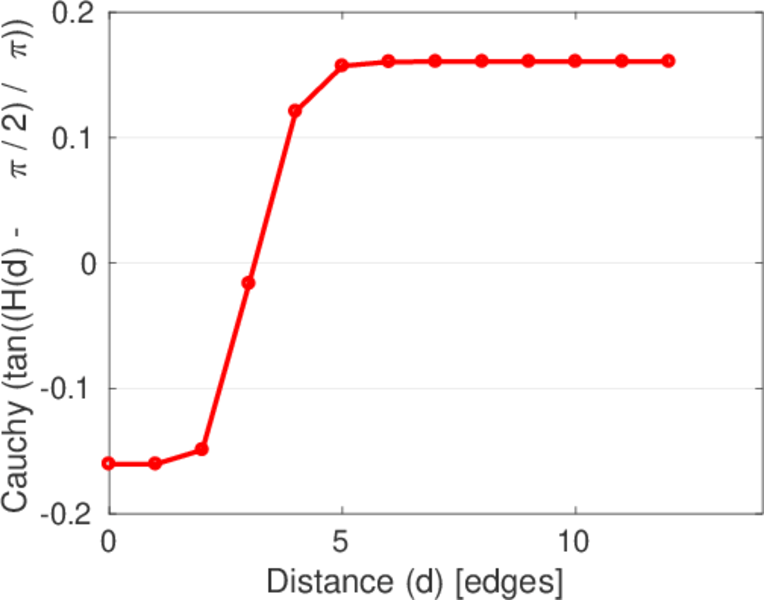
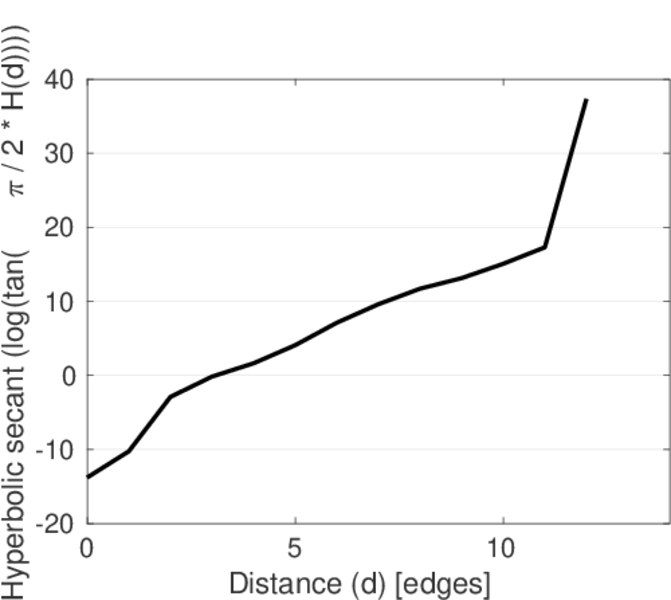
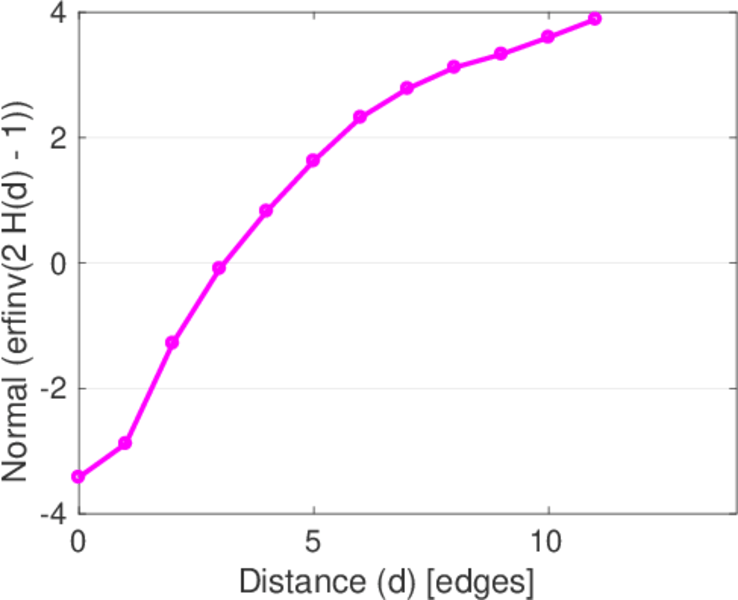
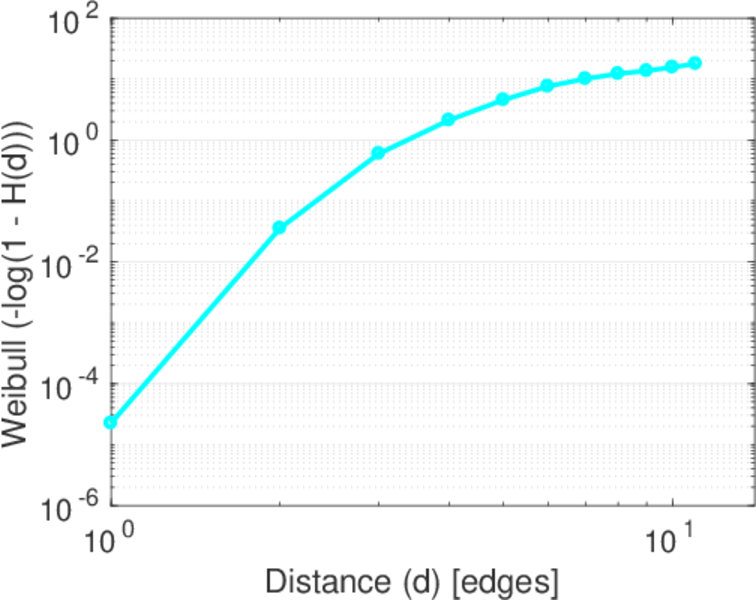
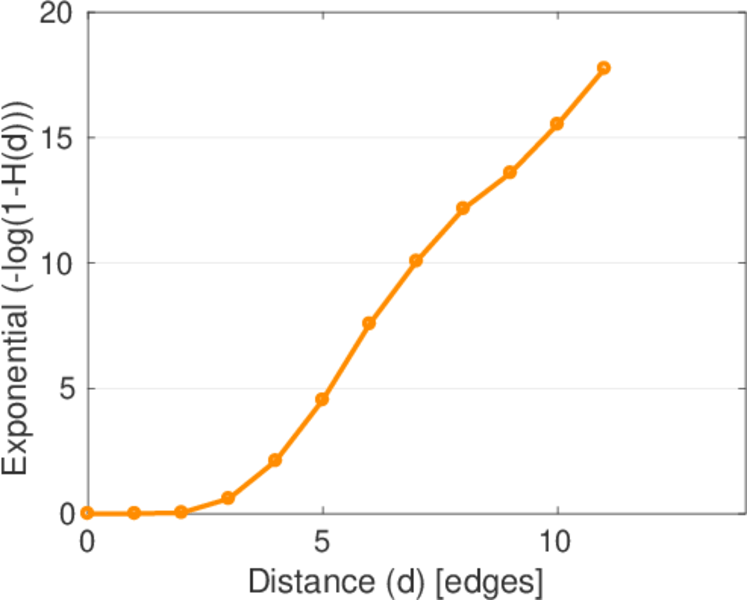
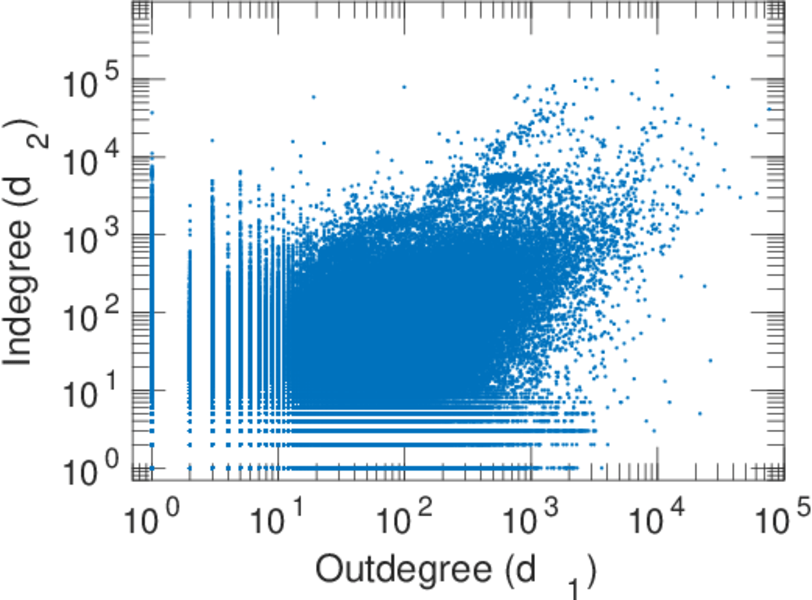
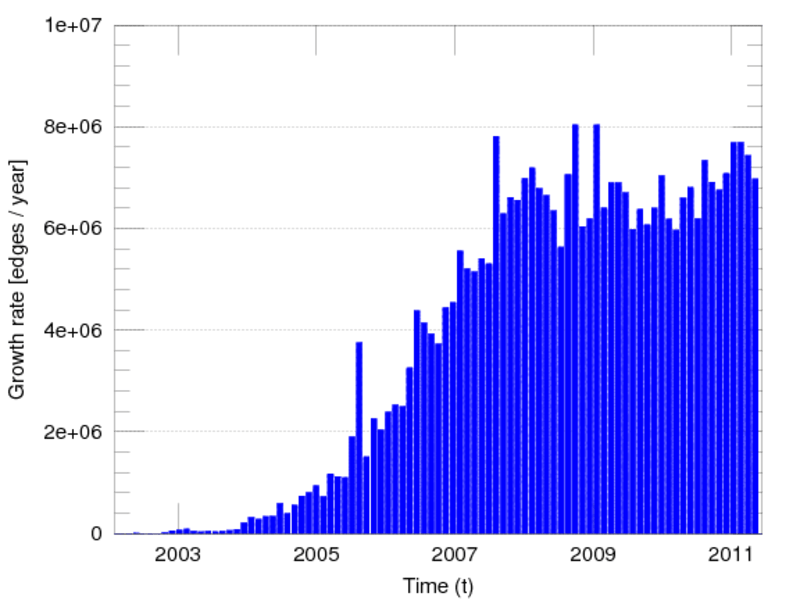
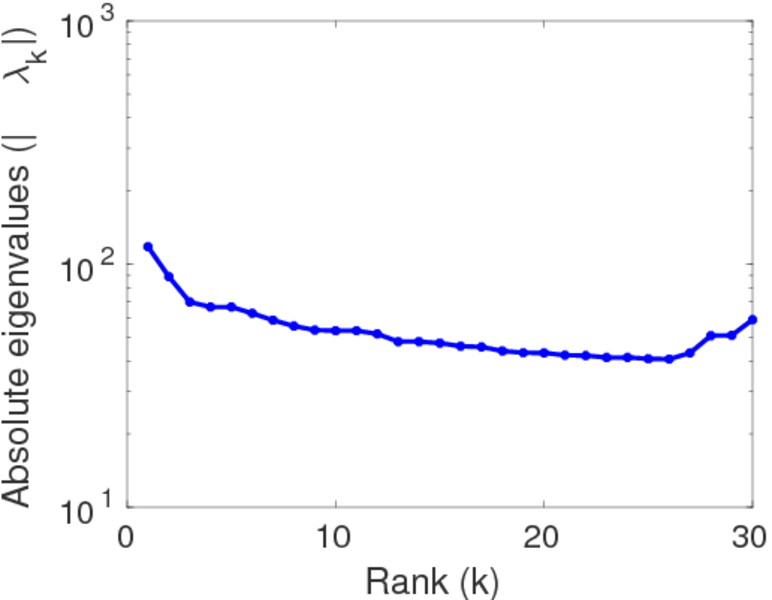
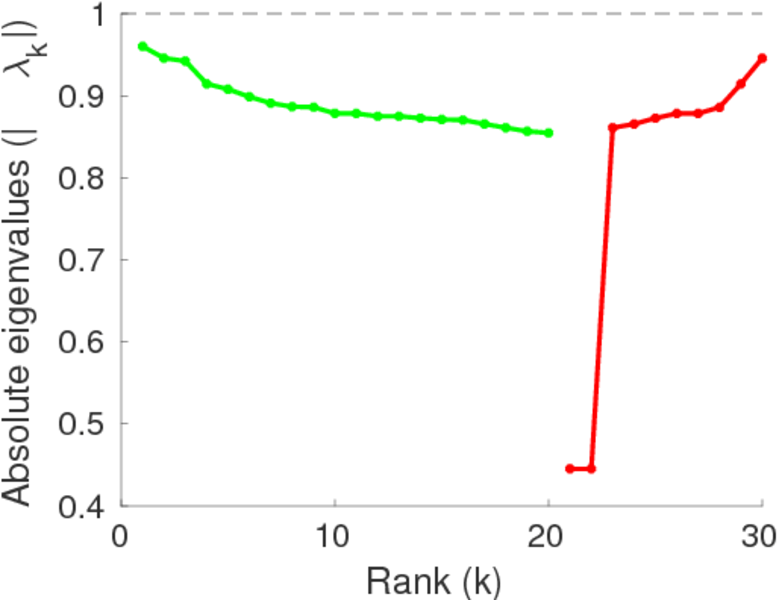
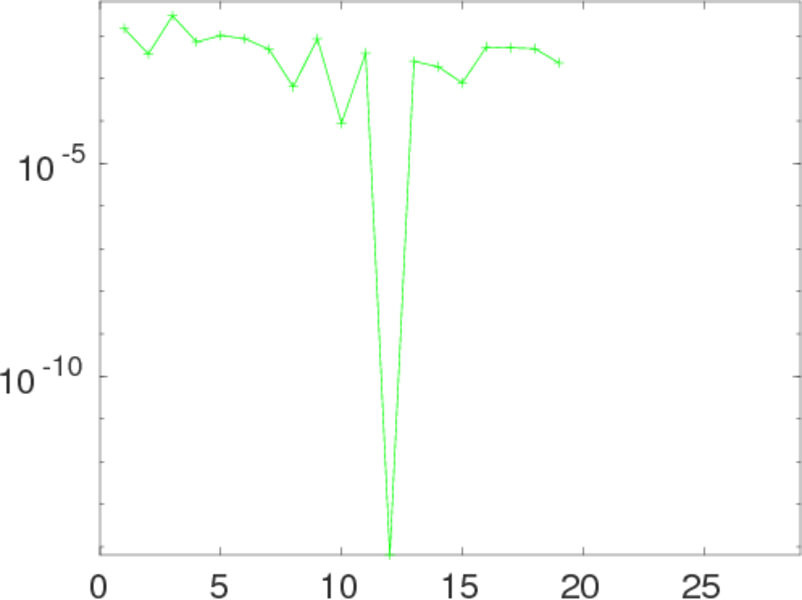
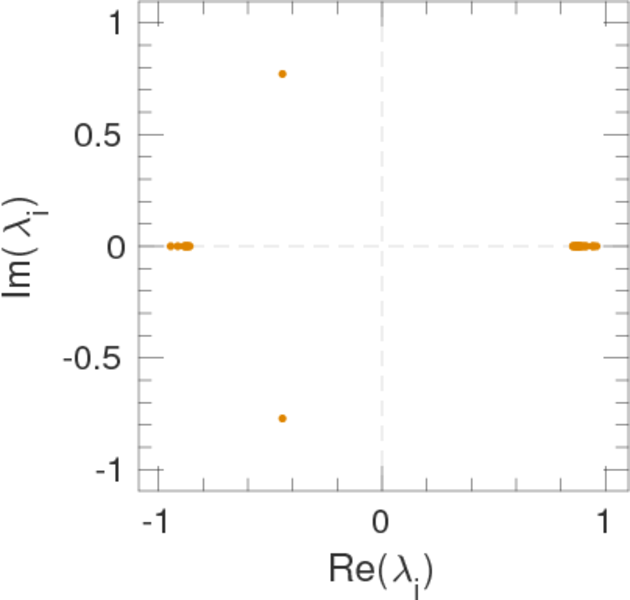
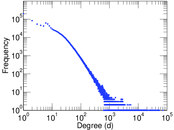
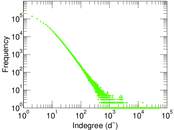
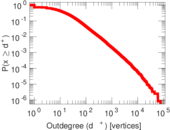
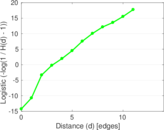
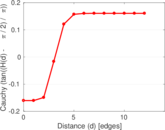
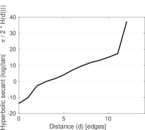
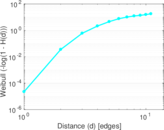
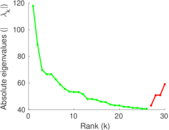
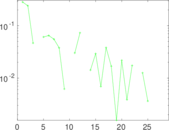
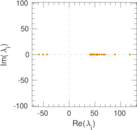
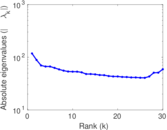
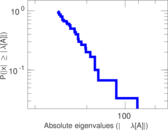
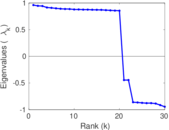
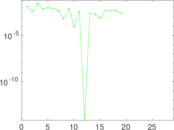
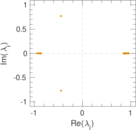
Plots


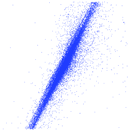


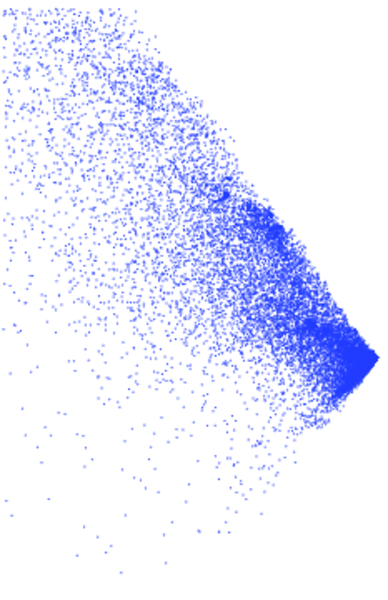
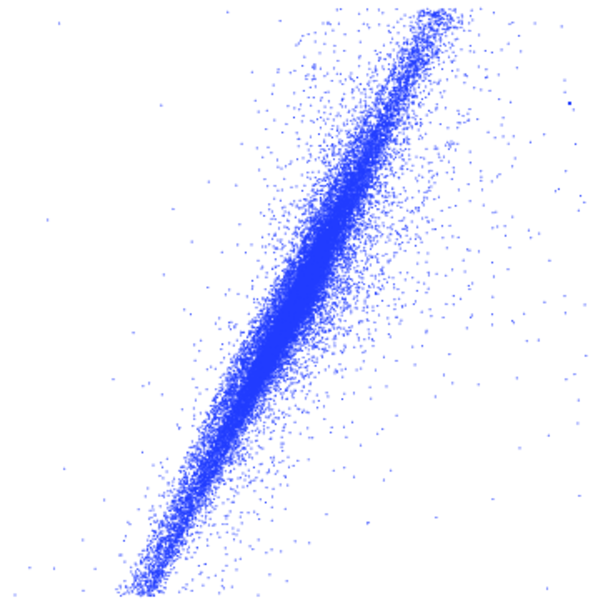
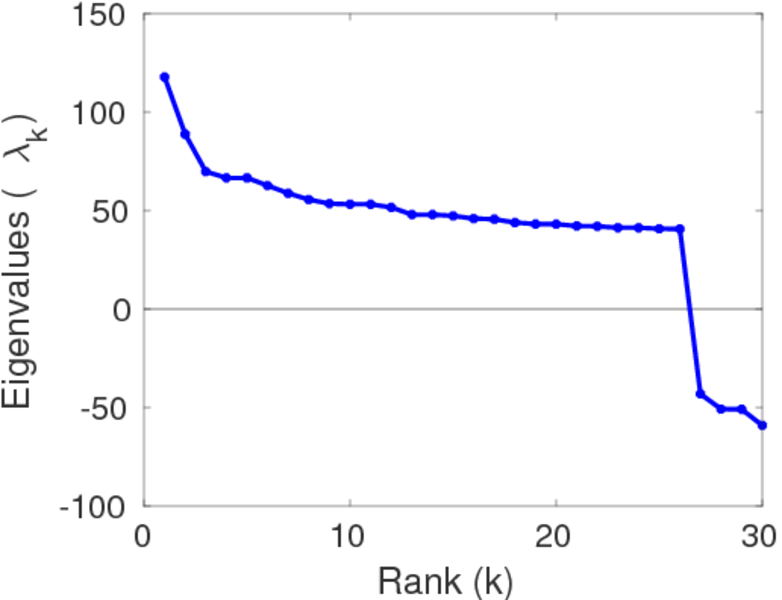
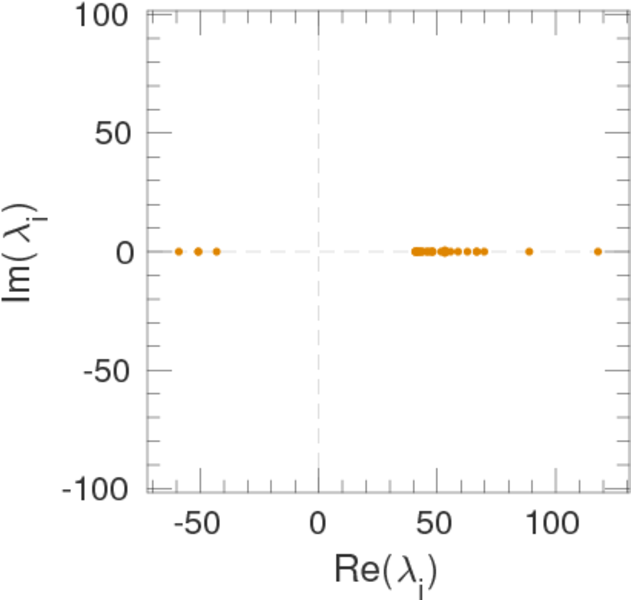
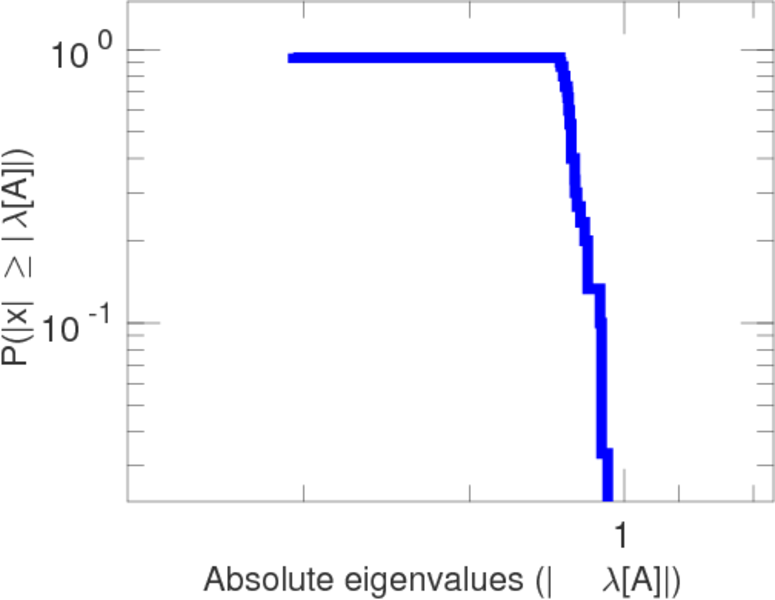
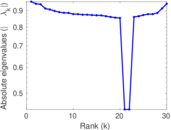
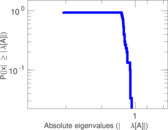
Matrix decompositions plots

Downloads
References
|
[1]
|
Jérôme Kunegis.
KONECT – The Koblenz Network Collection.
In Proc. Int. Conf. on World Wide Web Companion, pages
1343–1350, 2013.
[ http ]
|
|
[2]
|
Julia Preusse, Jérôme Kunegis, Matthias Thimm, Thomas Gottron, and Steffen
Staab.
Structural dynamics of knowledge networks.
In Proc. Int. Conf. on Weblogs and Soc. Media, 2013.
|
 KONECT ‣ Networks ‣
Buy Me a Coffee
KONECT ‣ Networks ‣
Buy Me a Coffee