Livemocha
This is the social network of Livemocha, an online language learning community.
The network is undirected and unweighted.
Metadata
Statistics
| Size | n = | 104,103
|
| Volume | m = | 2,193,083
|
| Loop count | l = | 0
|
| Wedge count | s = | 716,316,150
|
| Claw count | z = | 221,251,722,199
|
| Cross count | x = | 77,695,008,140,876
|
| Triangle count | t = | 3,361,651
|
| Square count | q = | 1,282,771,394
|
| 4-Tour count | T4 = | 13,131,821,918
|
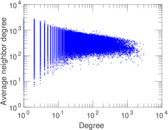
| Maximum degree | dmax = | 2,980
|
| Average degree | d = | 42.132 9
|
| Fill | p = | 0.000 404 728
|
| Size of LCC | N = | 104,103
|
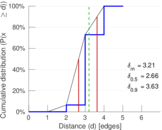
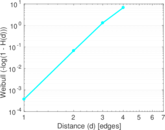
| Diameter | δ = | 6
|
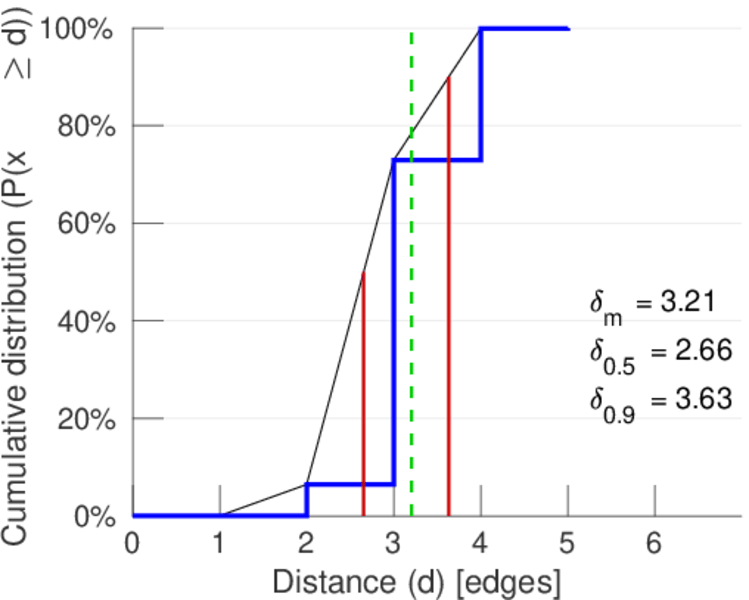
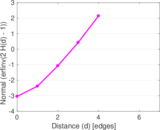
| 50-Percentile effective diameter | δ0.5 = | 2.655 28
|
| 90-Percentile effective diameter | δ0.9 = | 3.633 65
|
| Median distance | δM = | 3
|
| Mean distance | δm = | 3.207 24
|
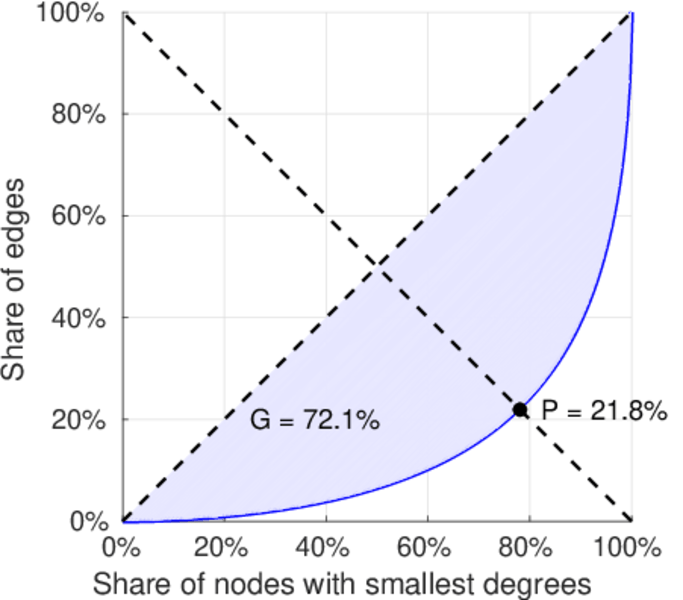
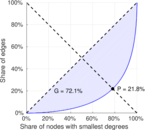
| Gini coefficient | G = | 0.720 790
|
| Balanced inequality ratio | P = | 0.217 667
|
| Relative edge distribution entropy | Her = | 0.900 277
|
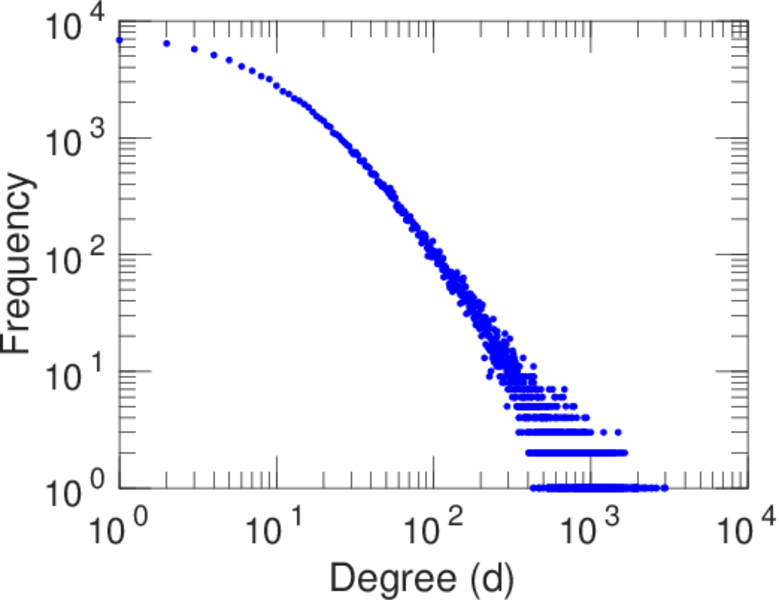
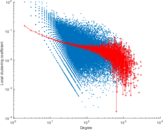
| Power law exponent | γ = | 1.382 85
|
| Tail power law exponent | γt = | 2.131 00
|
| Degree assortativity | ρ = | −0.146 773
|
| Degree assortativity p-value | pρ = | 0.000 00
|
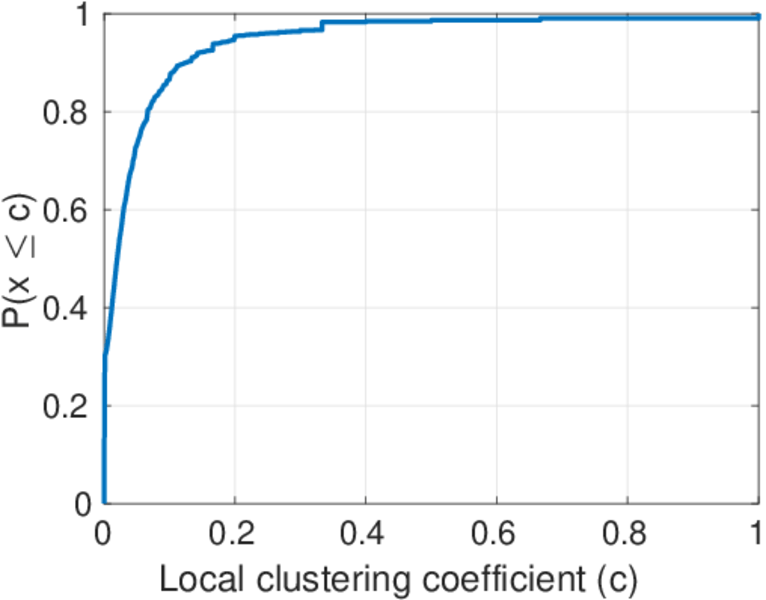
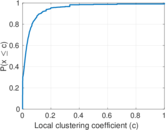
| Clustering coefficient | c = | 0.014 078 9
|
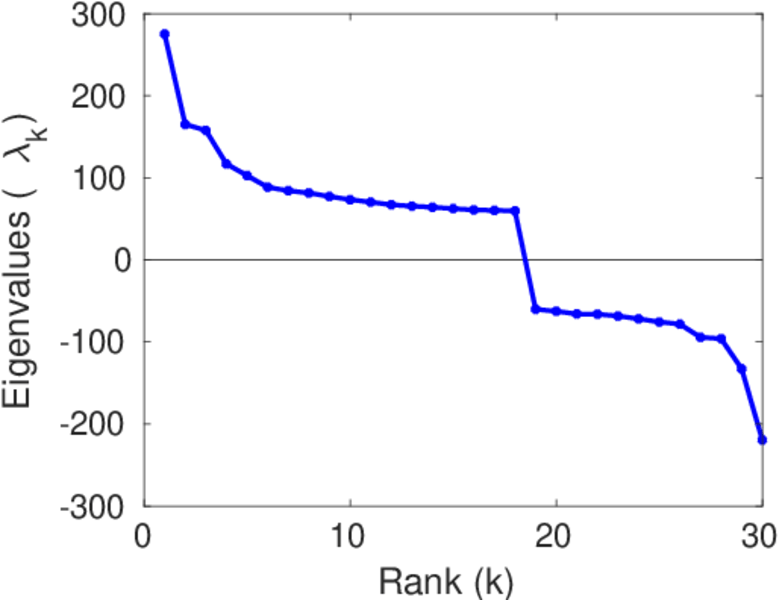
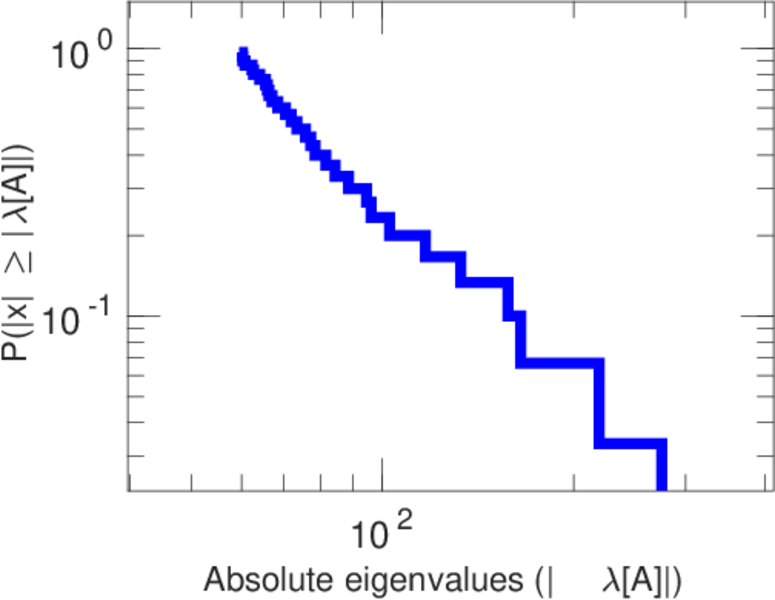
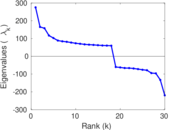
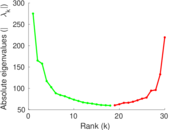
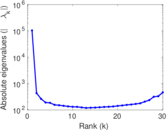
| Spectral norm | α = | 275.173
|
| Algebraic connectivity | a = | 0.169 934
|
| Spectral separation | |λ1[A] / λ2[A]| = | 1.254 40
|
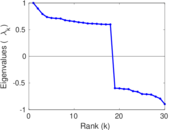
| Non-bipartivity | bA = | 0.202 804
|
| Normalized non-bipartivity | bN = | 0.104 296
|
| Algebraic non-bipartivity | χ = | 0.169 925
|
| Spectral bipartite frustration | bK = | 0.001 008 27
|
| Controllability | C = | 21,504
|
| Relative controllability | Cr = | 0.206 565
|
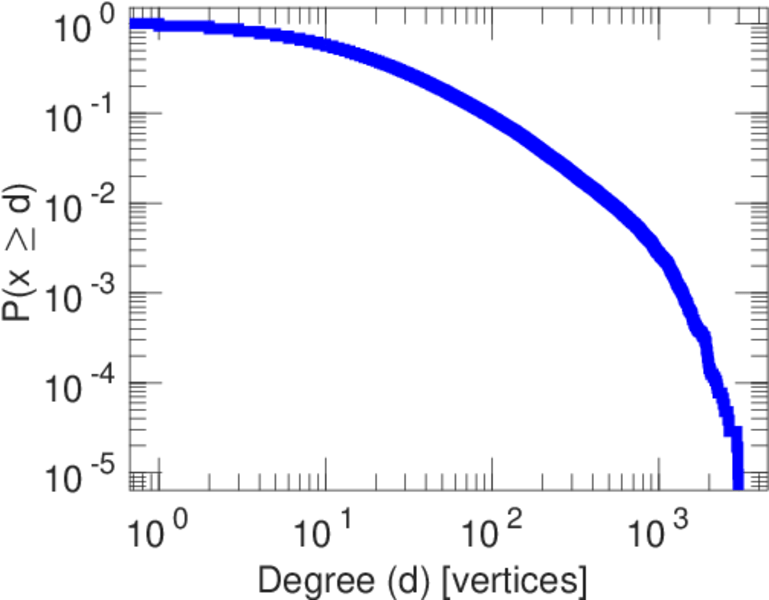
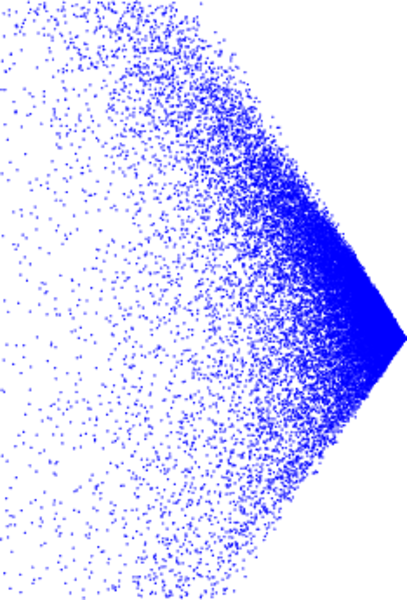
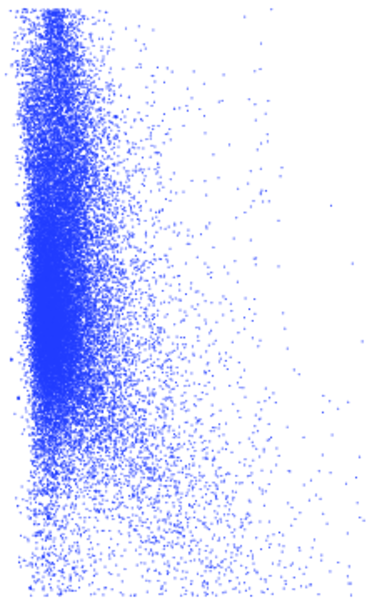
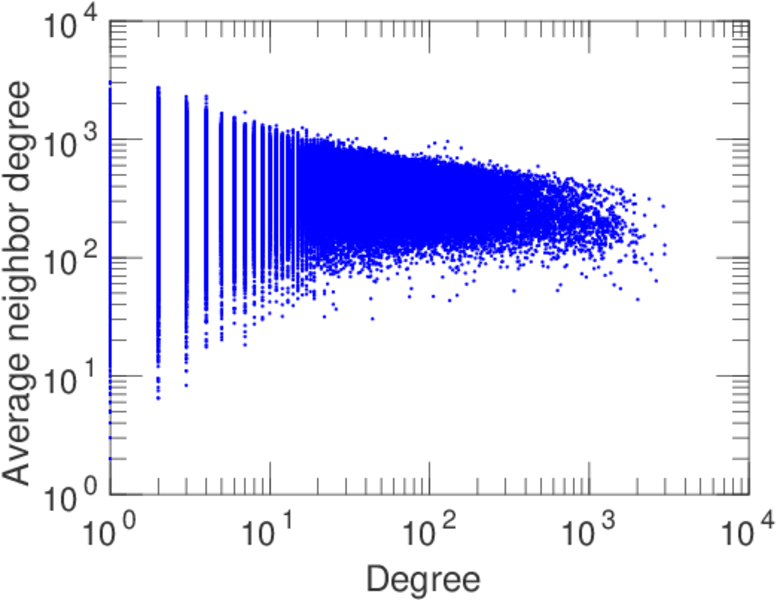
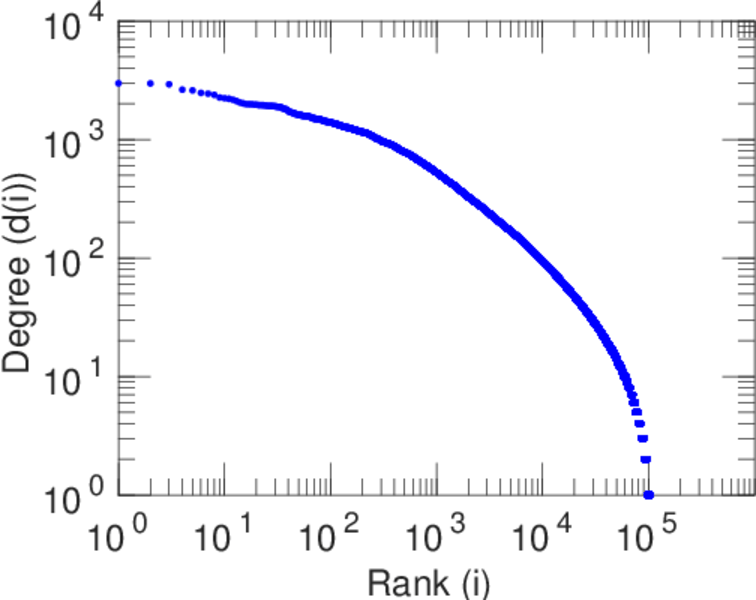
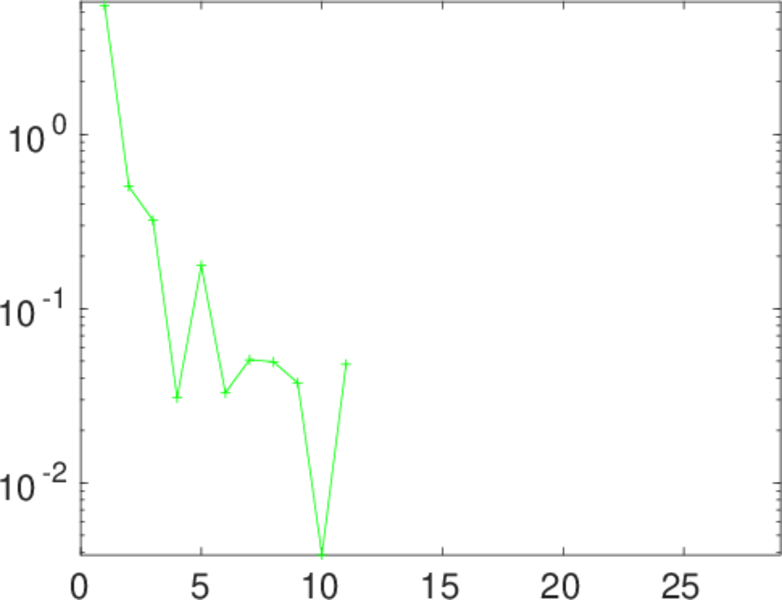
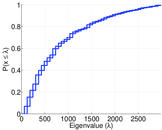
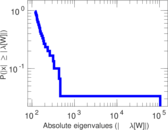
Plots


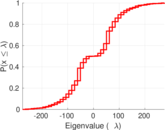
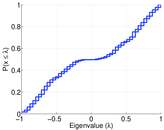
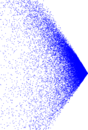
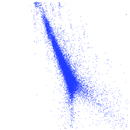
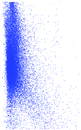


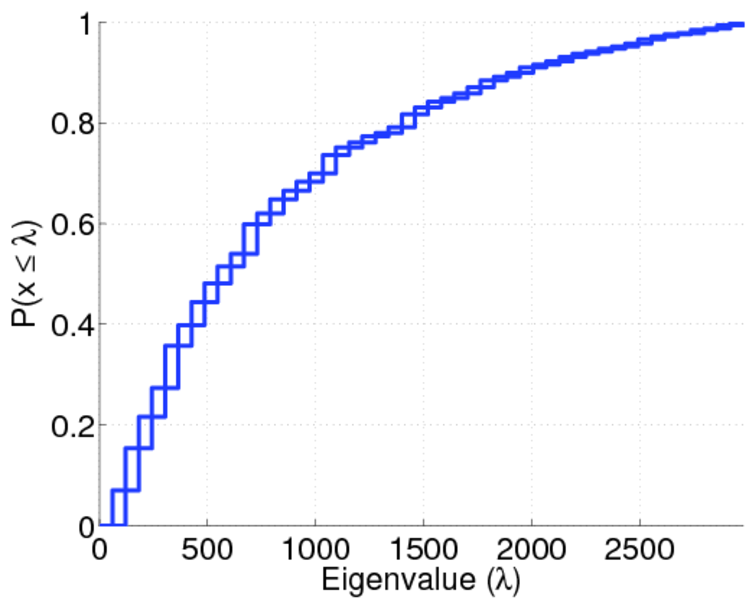
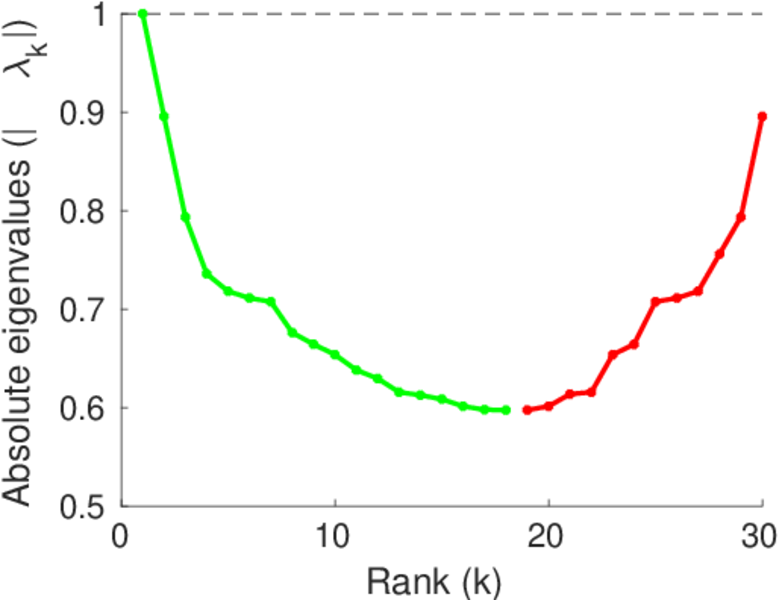
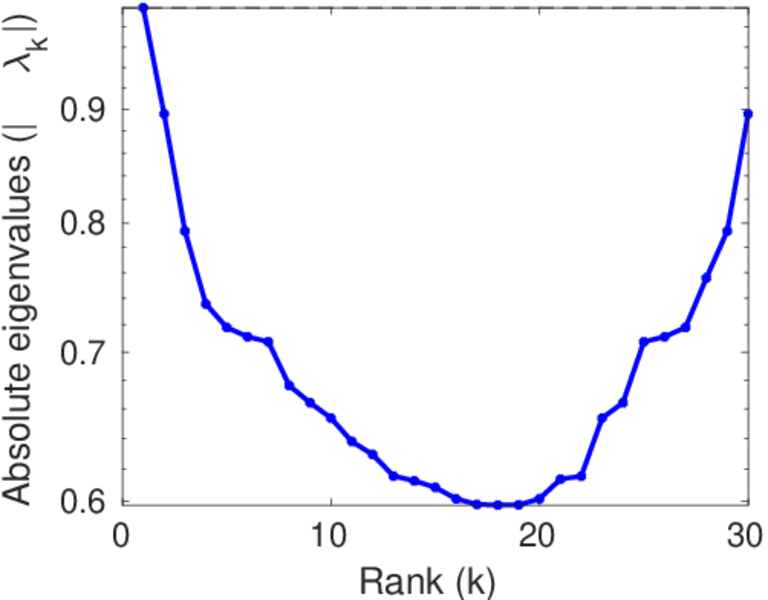
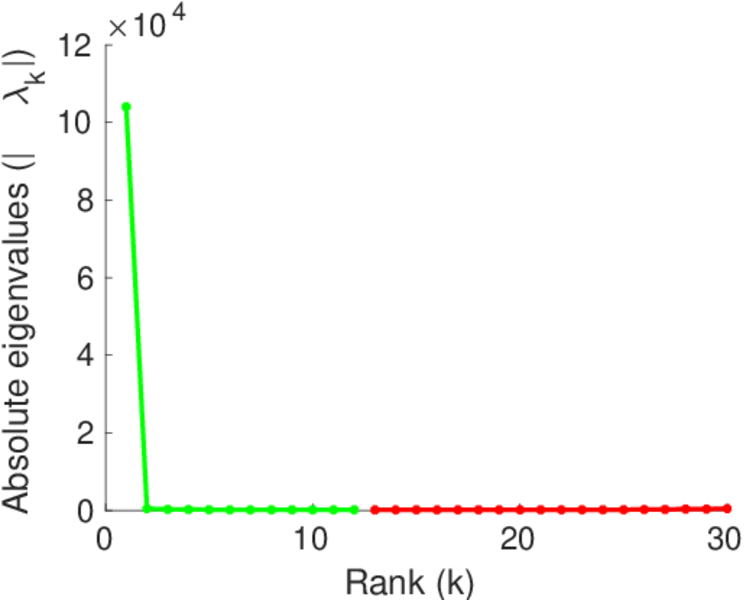
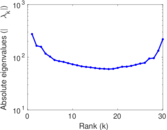
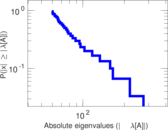
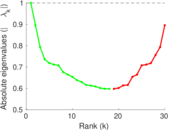
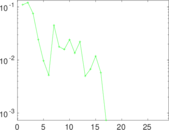
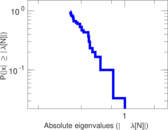
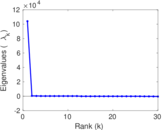
Matrix decompositions plots


Downloads
References
|
[1]
|
Jérôme Kunegis.
KONECT – The Koblenz Network Collection.
In Proc. Int. Conf. on World Wide Web Companion, pages
1343–1350, 2013.
[ http ]
|
|
[2]
|
R. Zafarani and H. Liu.
Social computing data repository at ASU, 2009.
[ http ]
|
 KONECT ‣ Networks ‣
Buy Me a Coffee
KONECT ‣ Networks ‣
Buy Me a Coffee