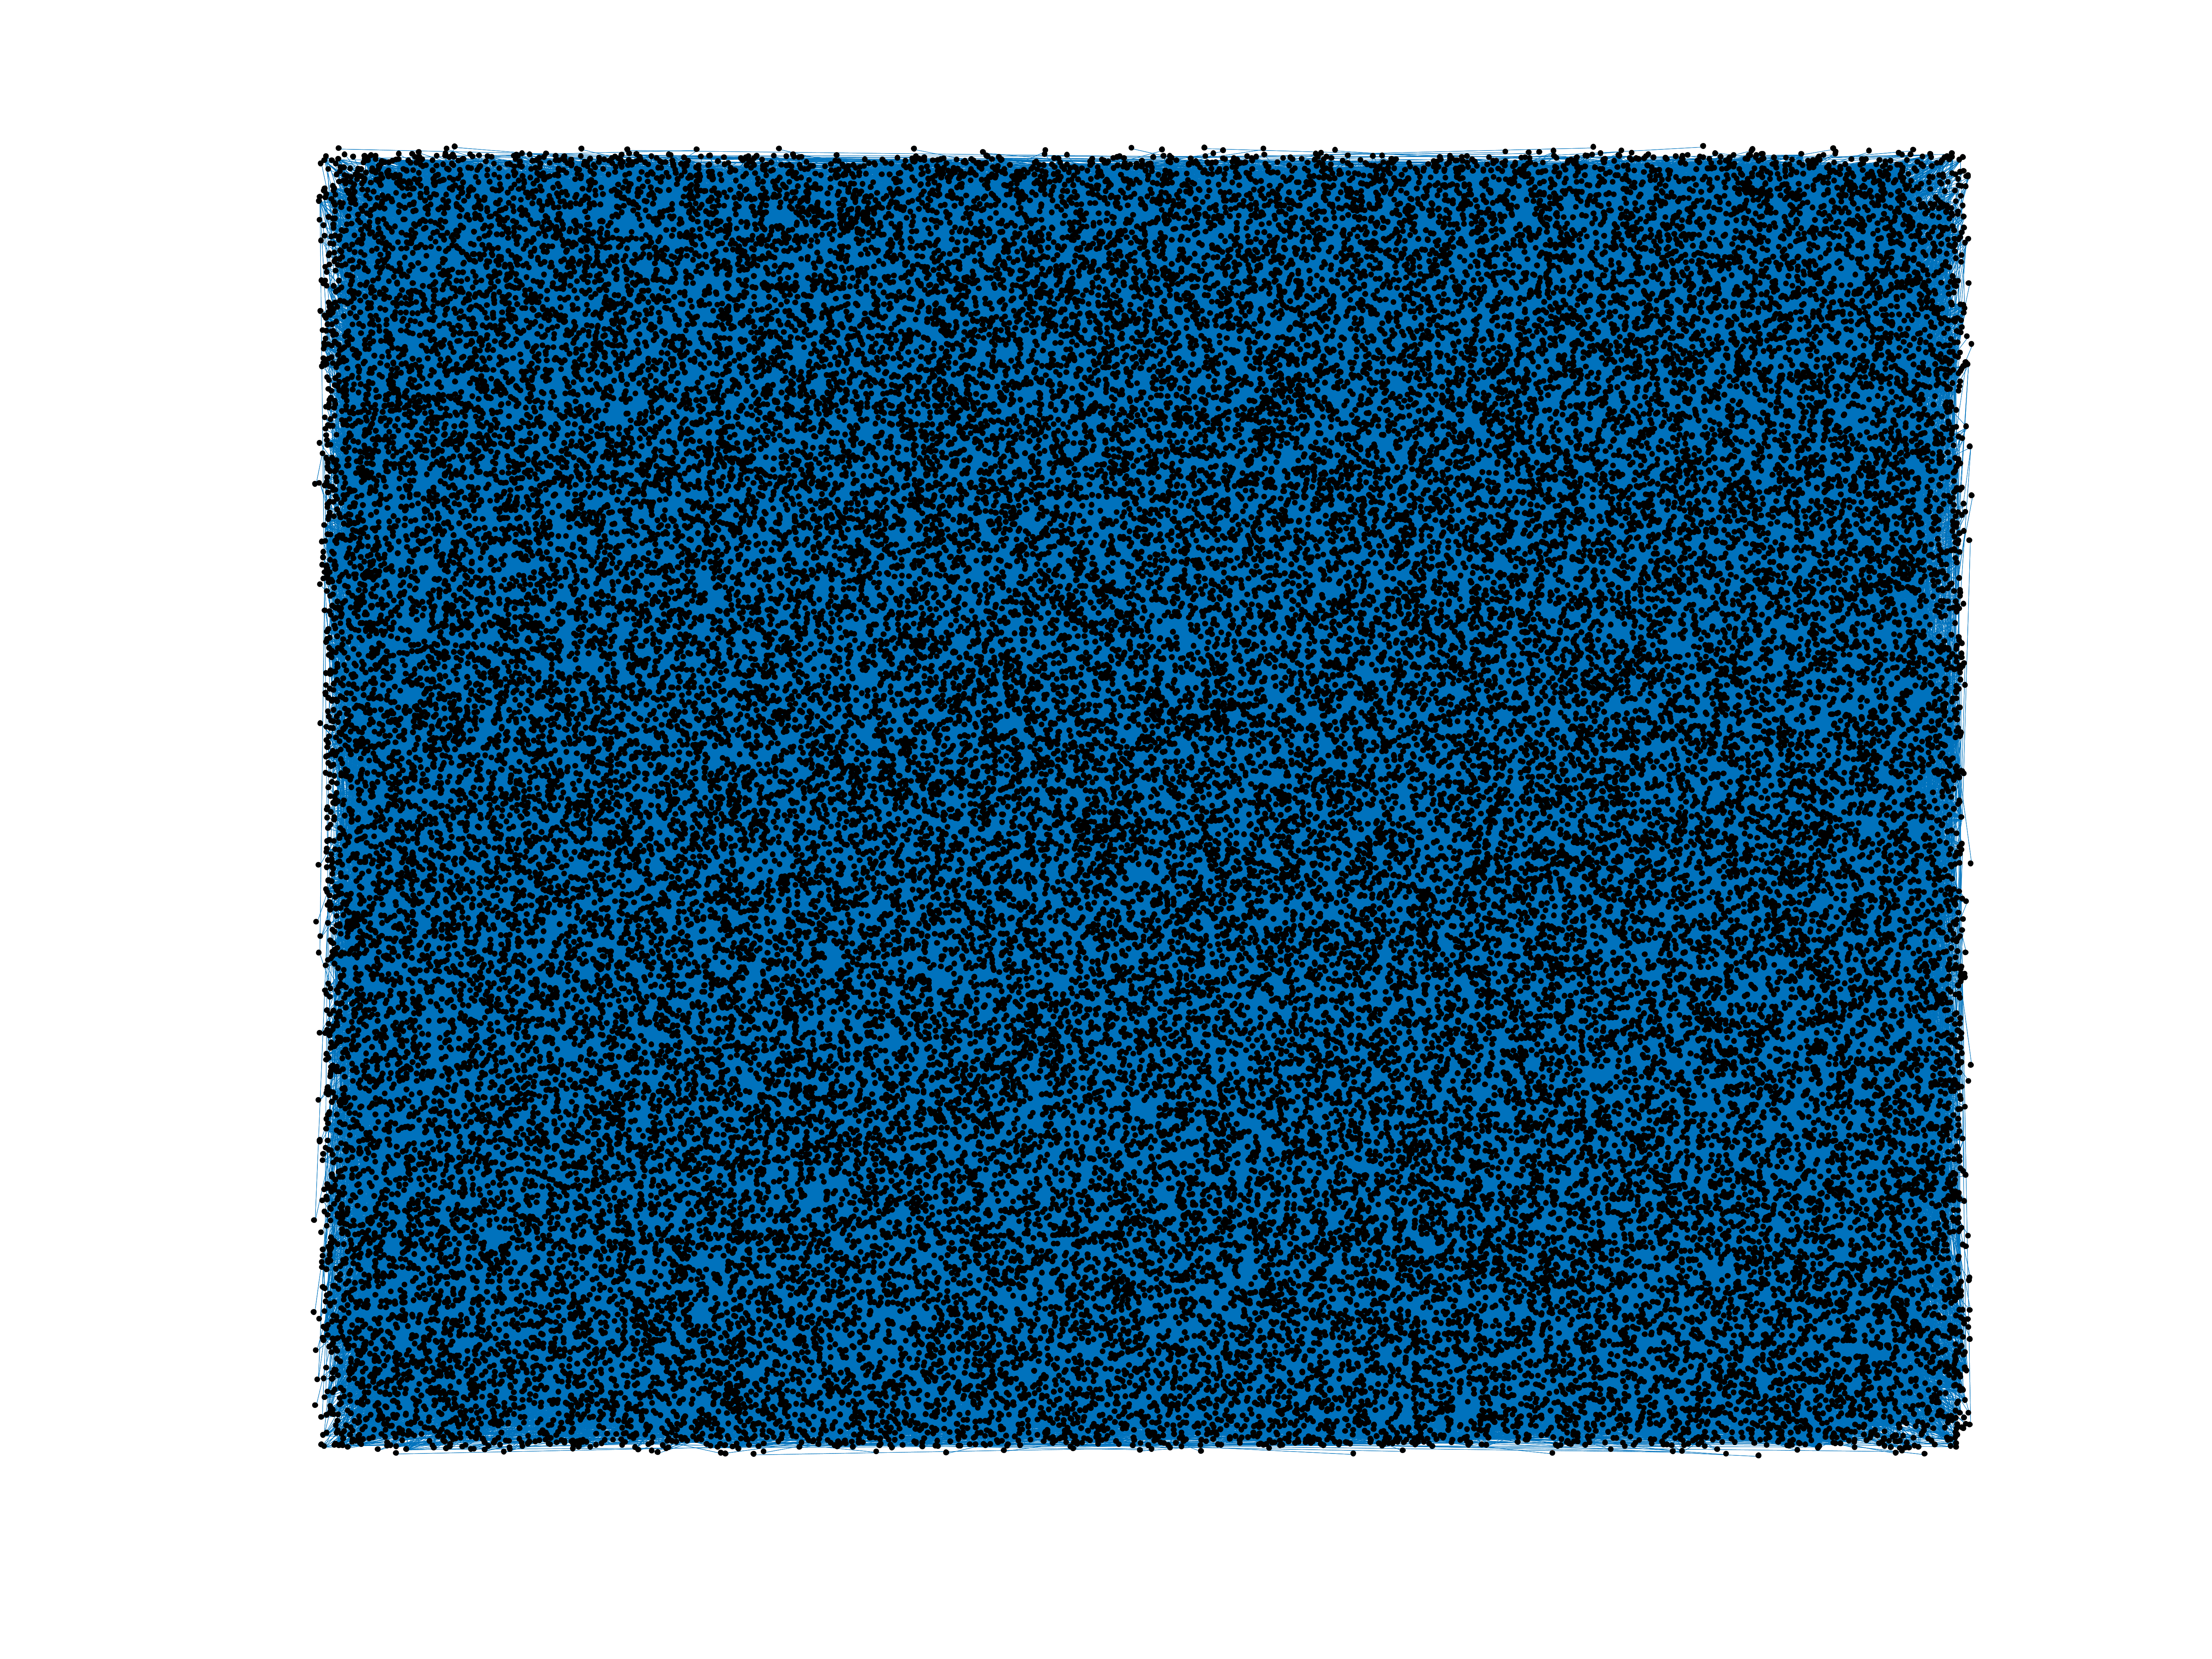
Brightkite
This undirected network contains user–user friendship relations from
Brightkite, a former location-based social network were user shared their
locations. A node represents a user and an edge indicates that a friendship
exists between the user represented by the left node and the user represented
by the right node.
Metadata
Statistics
| Size | n = | 58,228
|
| Volume | m = | 214,078
|
| Loop count | l = | 0
|
| Wedge count | s = | 13,423,403
|
| Claw count | z = | 1,455,808,231
|
| Cross count | x = | 248,701,890,895
|
| Triangle count | t = | 494,728
|
| Square count | q = | 23,380,701
|
| 4-Tour count | T4 = | 241,167,376
|
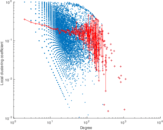
| Maximum degree | dmax = | 1,134
|
| Average degree | d = | 7.353 09
|
| Fill | p = | 0.000 126 283
|
| Size of LCC | N = | 56,739
|
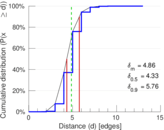
| Diameter | δ = | 18
|
| 50-Percentile effective diameter | δ0.5 = | 4.331 65
|
| 90-Percentile effective diameter | δ0.9 = | 5.764 94
|
| Median distance | δM = | 5
|
| Mean distance | δm = | 4.859 34
|
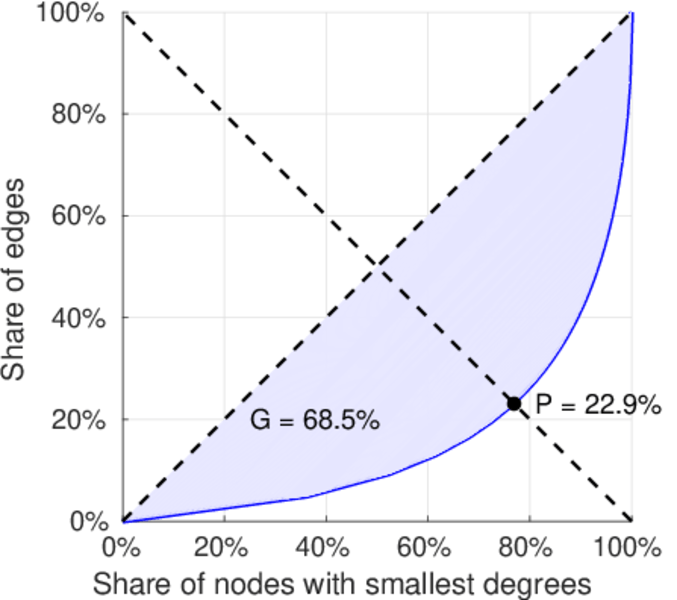
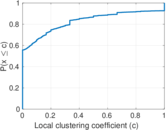
| Gini coefficient | G = | 0.684 989
|
| Balanced inequality ratio | P = | 0.229 288
|
| Relative edge distribution entropy | Her = | 0.902 235
|
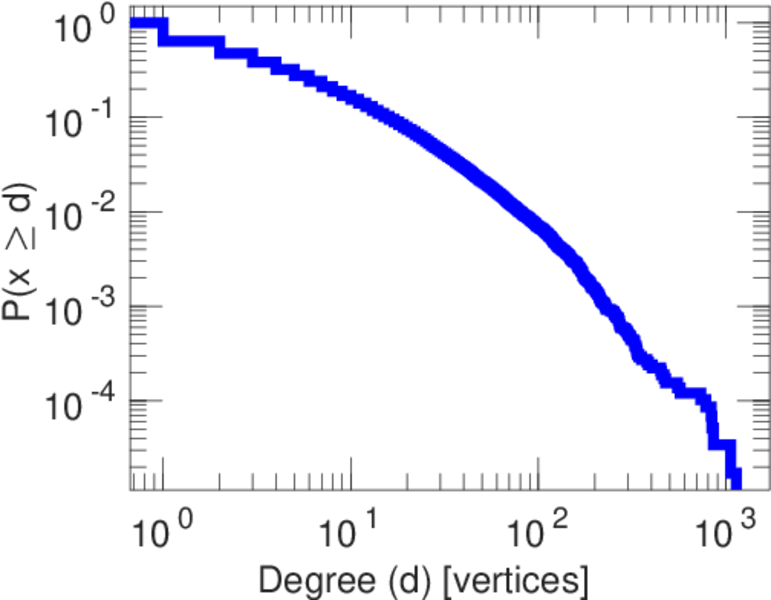
| Power law exponent | γ = | 1.905 79
|
| Tail power law exponent | γt = | 2.481 00
|
| Tail power law exponent with p | γ3 = | 2.481 00
|
| p-value | p = | 0.000 00
|
| Degree assortativity | ρ = | +0.010 815 8
|
| Degree assortativity p-value | pρ = | 1.469 32 × 10−12
|
| Clustering coefficient | c = | 0.110 567
|
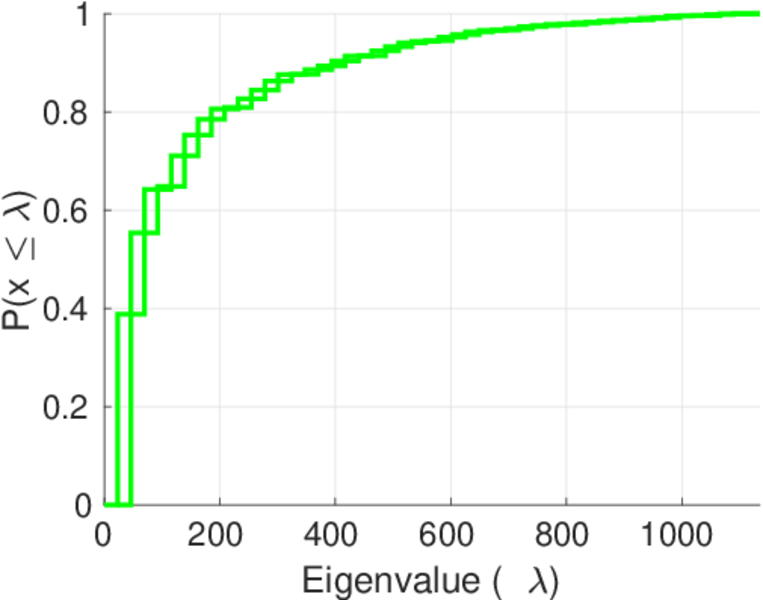
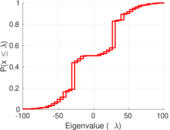
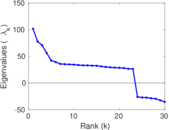
| Spectral norm | α = | 101.491
|
| Algebraic connectivity | a = | 0.028 857 7
|
| Spectral separation | |λ1[A] / λ2[A]| = | 1.305 74
|
| Non-bipartivity | bA = | 0.650 823
|
| Normalized non-bipartivity | bN = | 0.015 484 9
|
| Algebraic non-bipartivity | χ = | 0.028 871 0
|
| Spectral bipartite frustration | bK = | 0.000 961 582
|
| Controllability | C = | 15,728
|
| Relative controllability | Cr = | 0.270 111
|
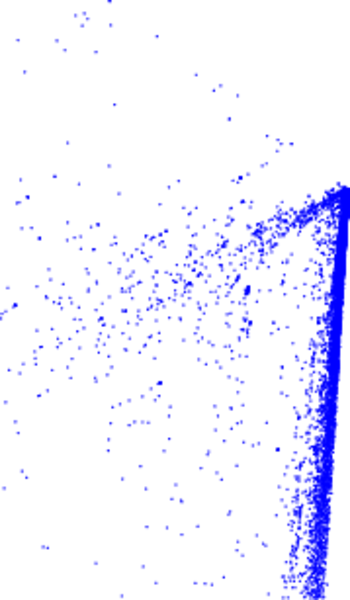
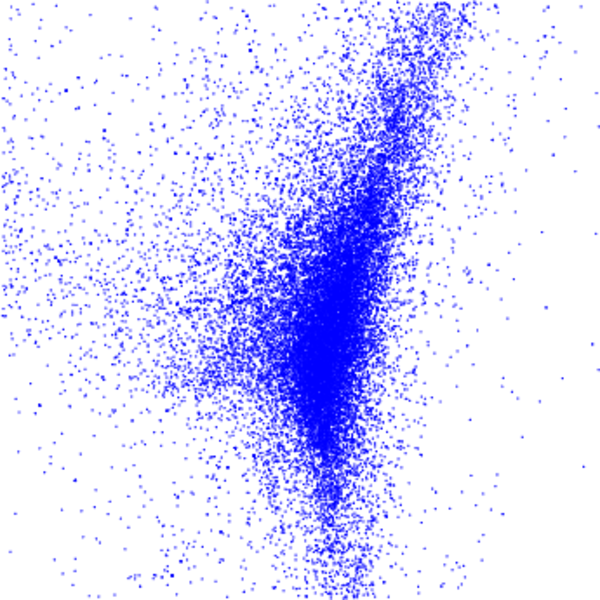
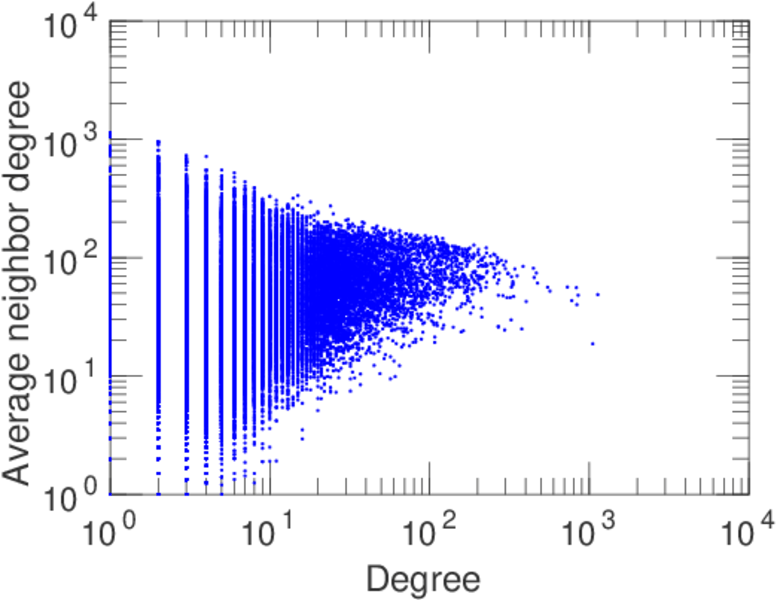
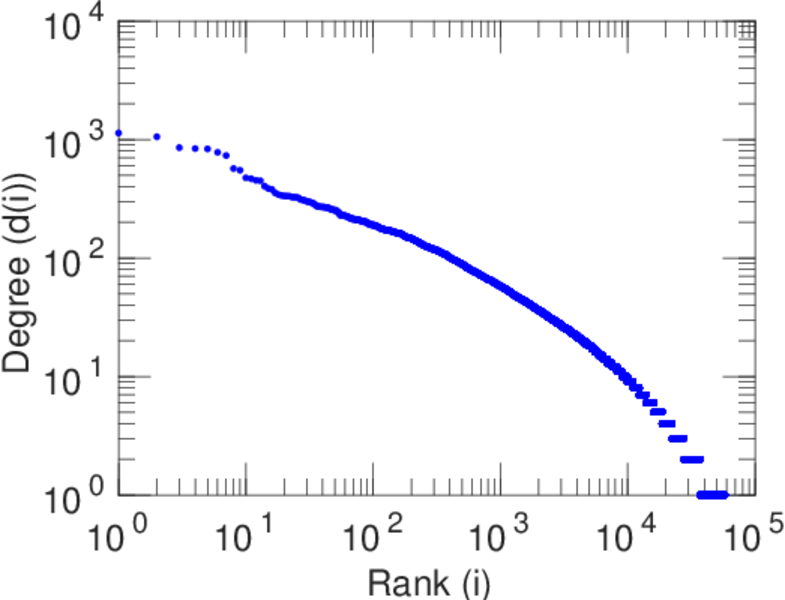
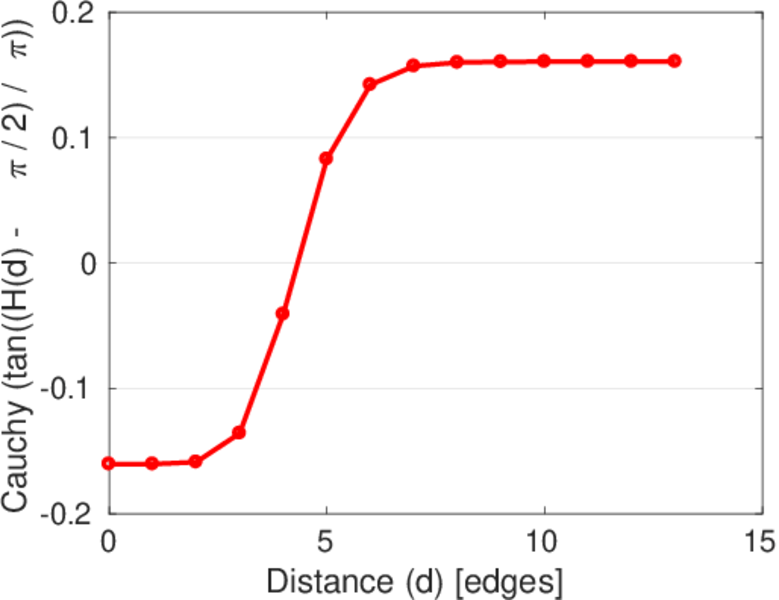
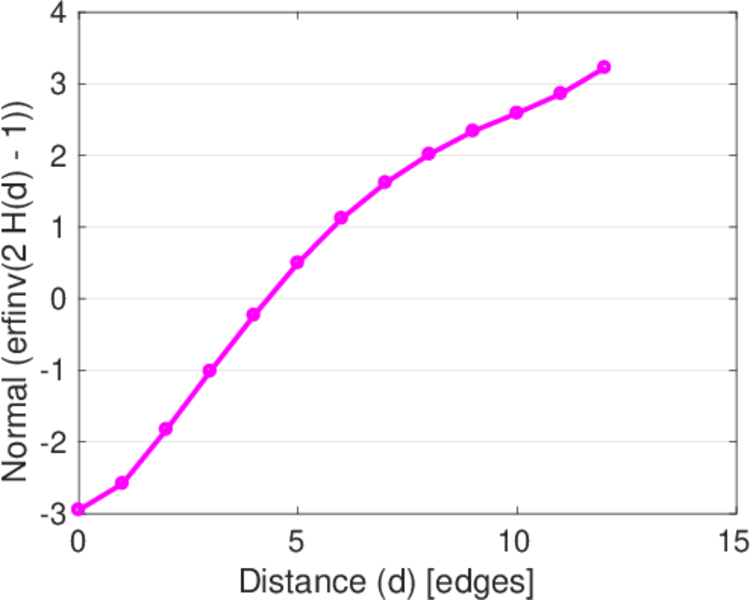
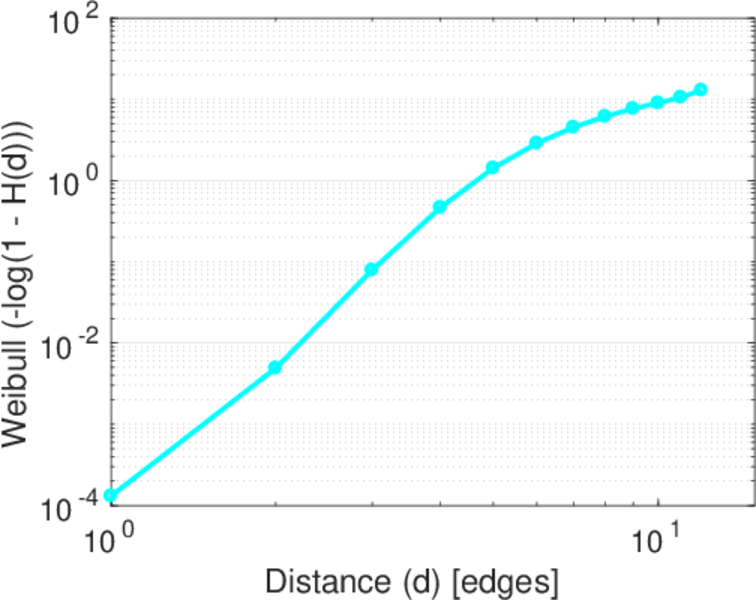
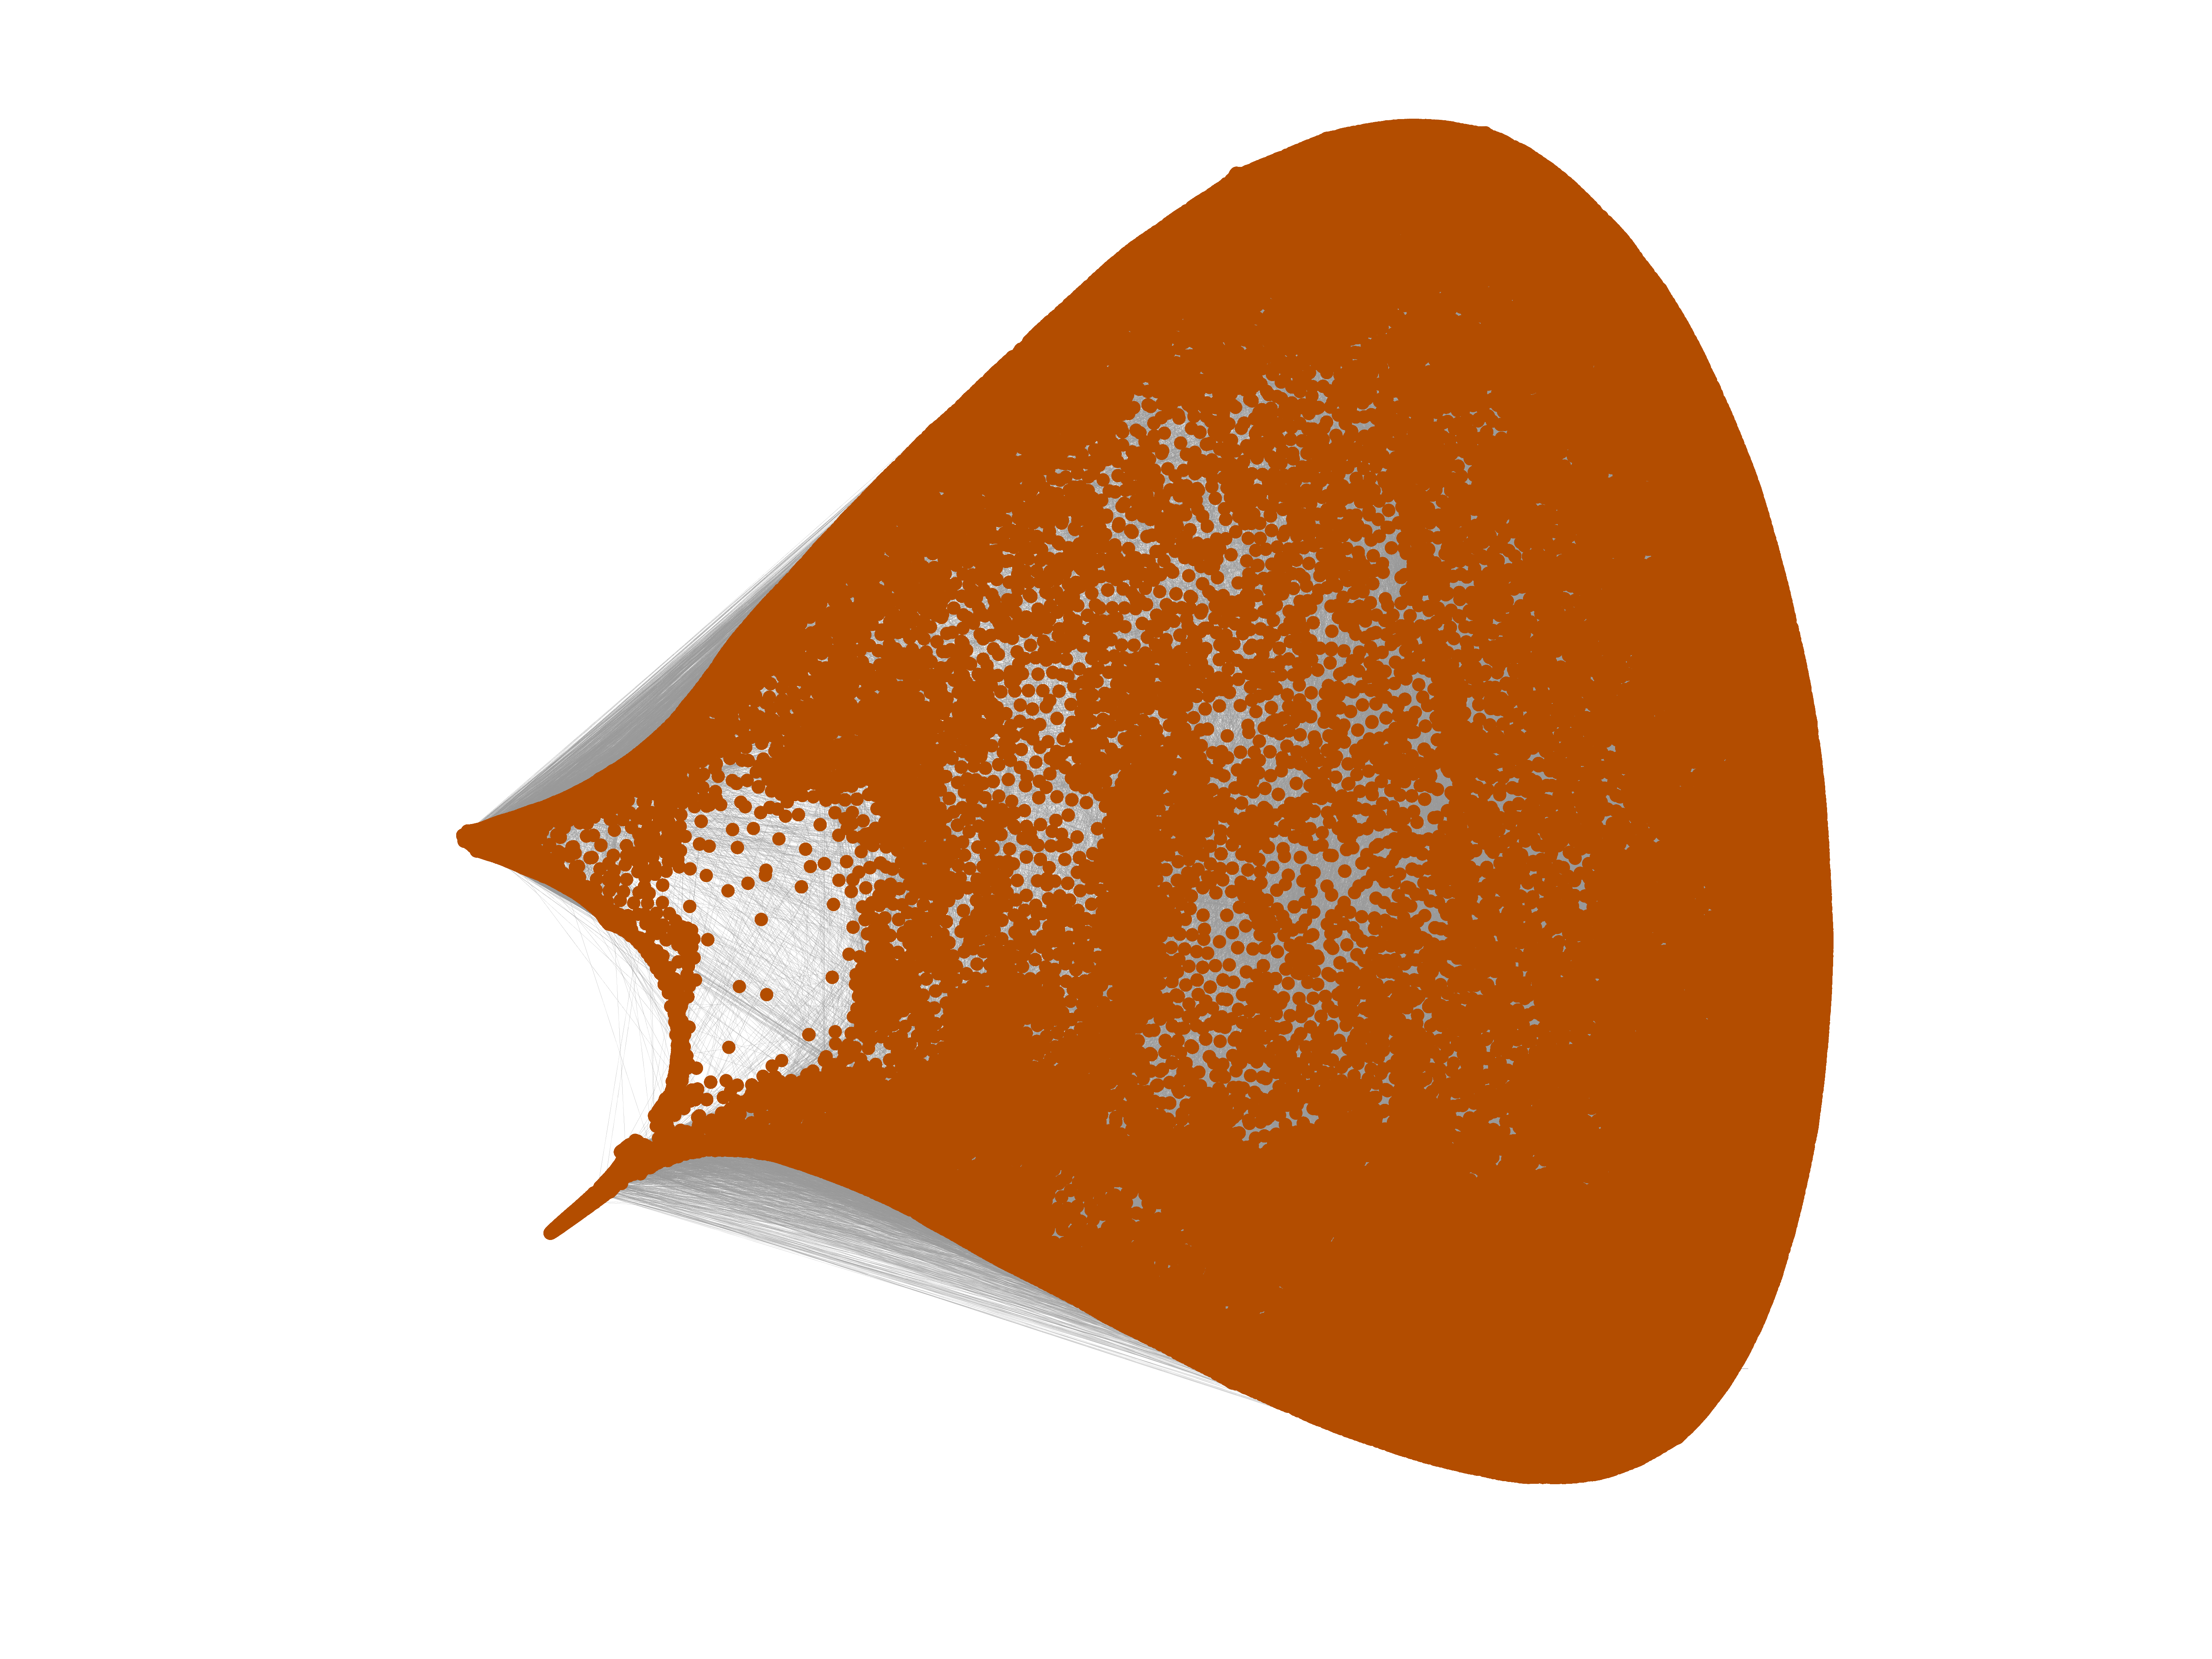
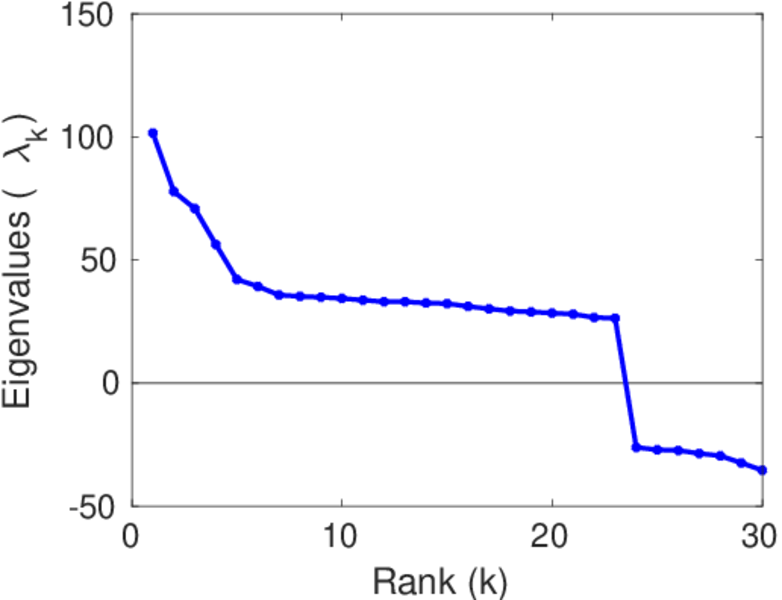
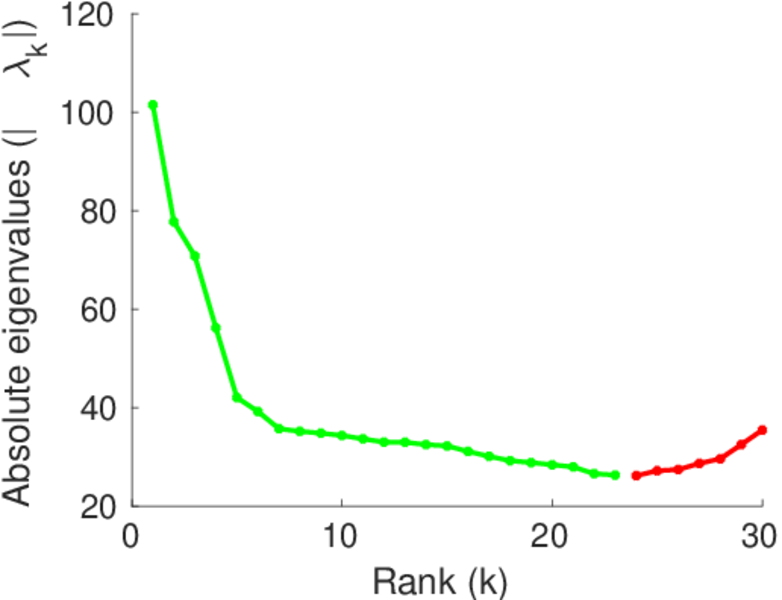
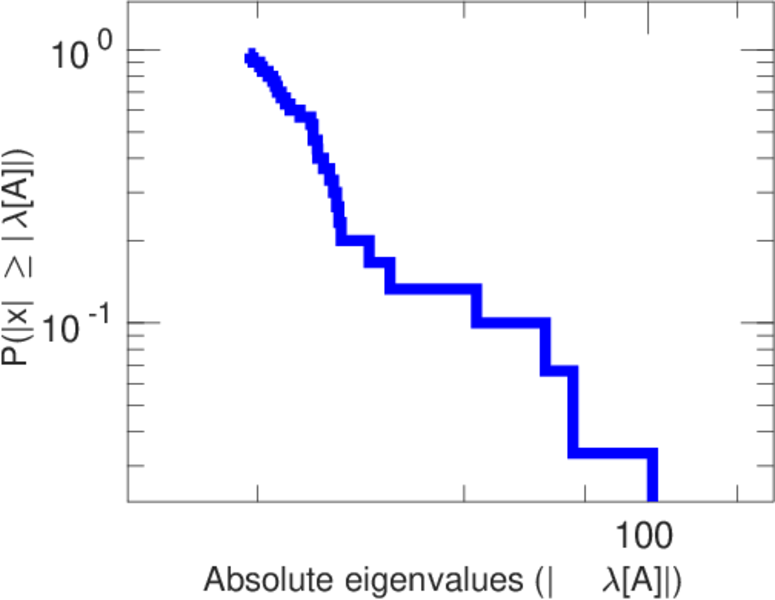
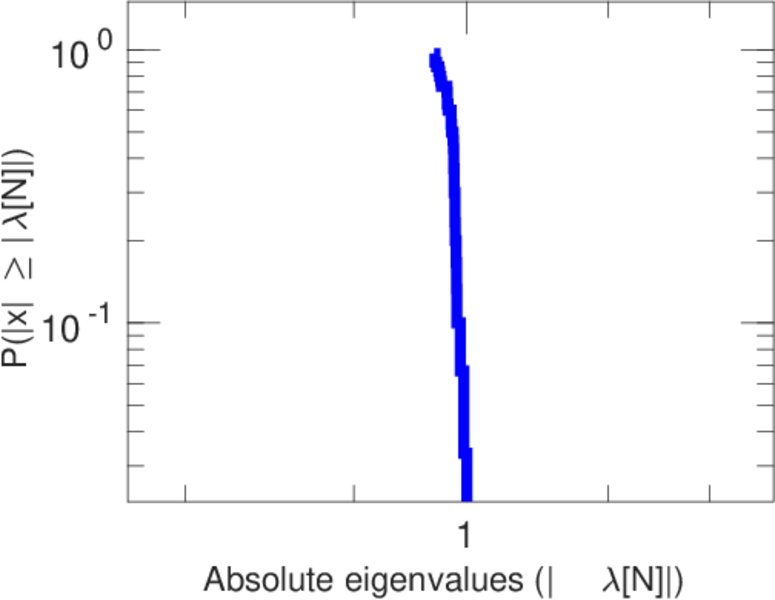
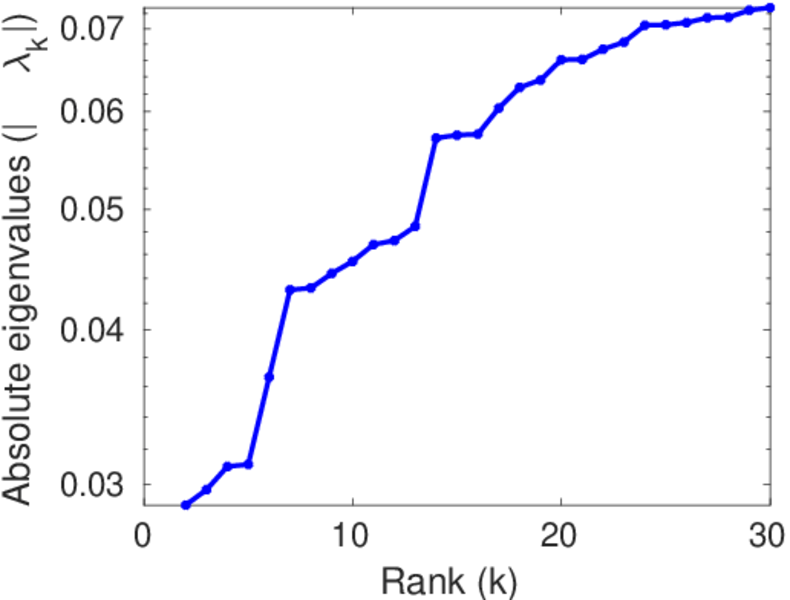
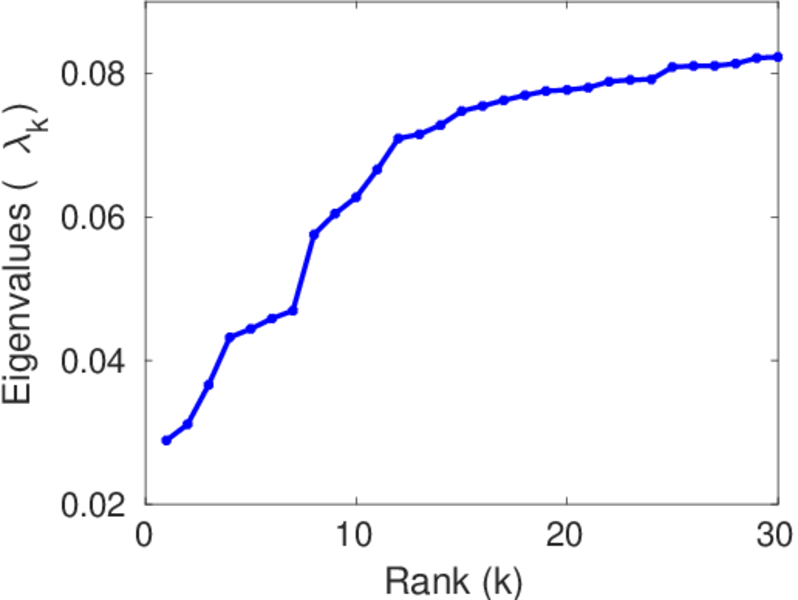
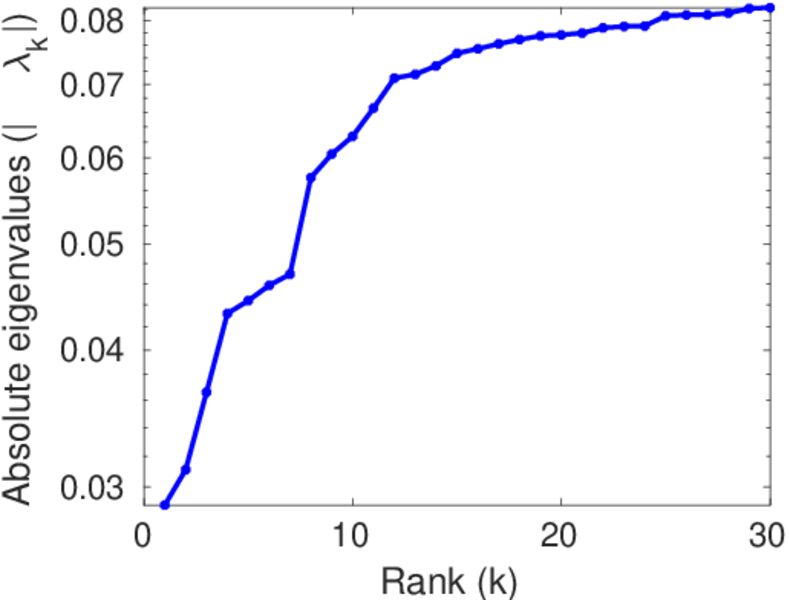
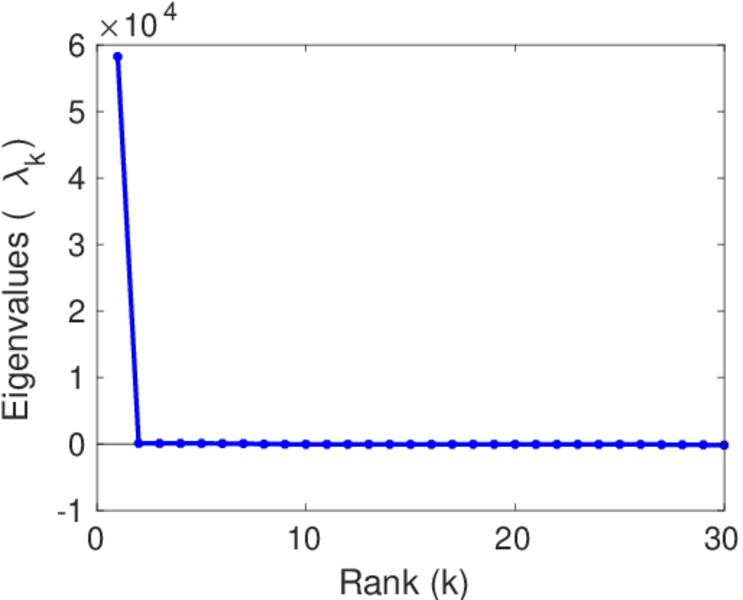
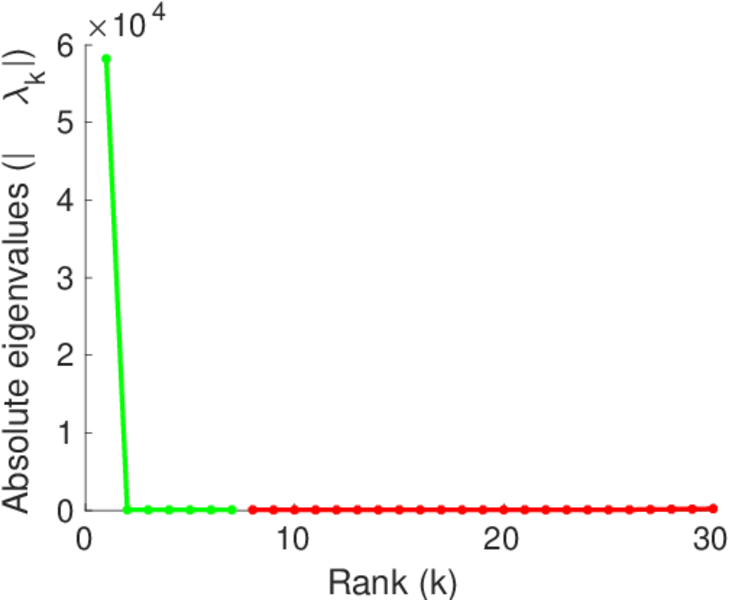
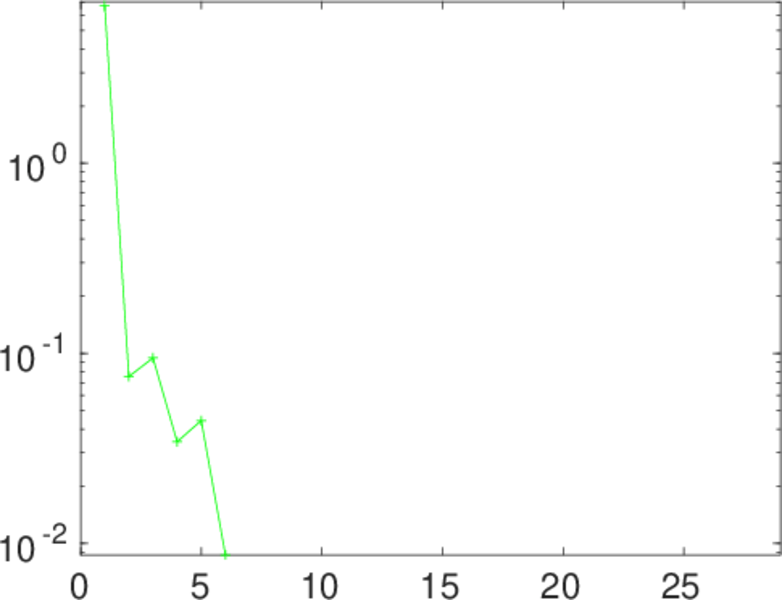
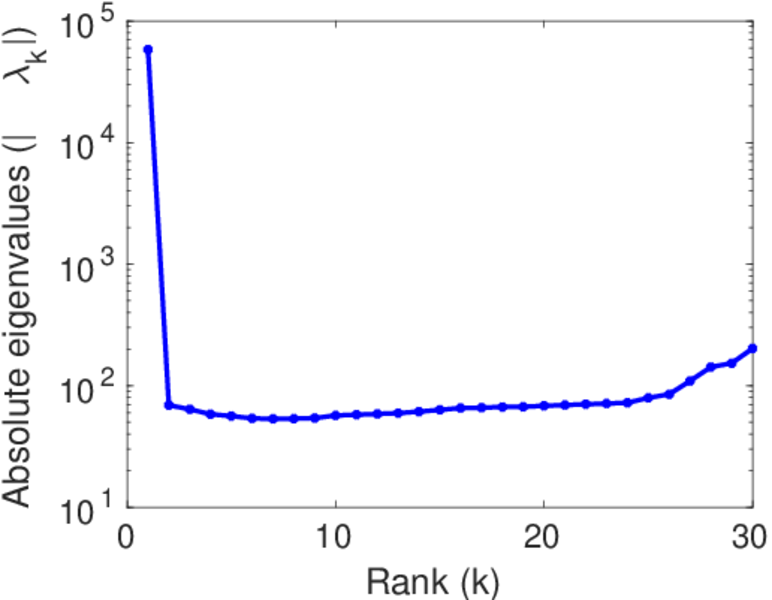
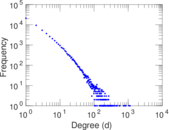
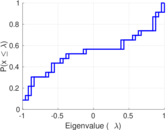
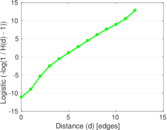
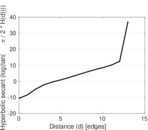
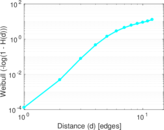
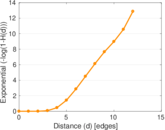
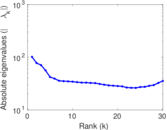
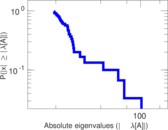
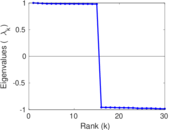
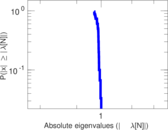
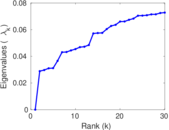
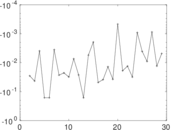
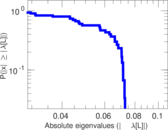
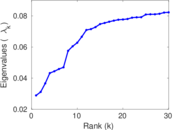
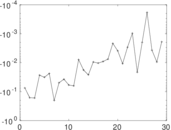
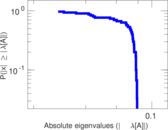
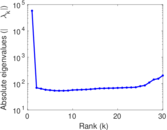
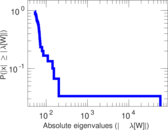
Plots


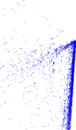
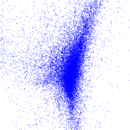


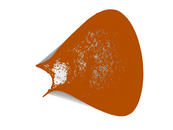


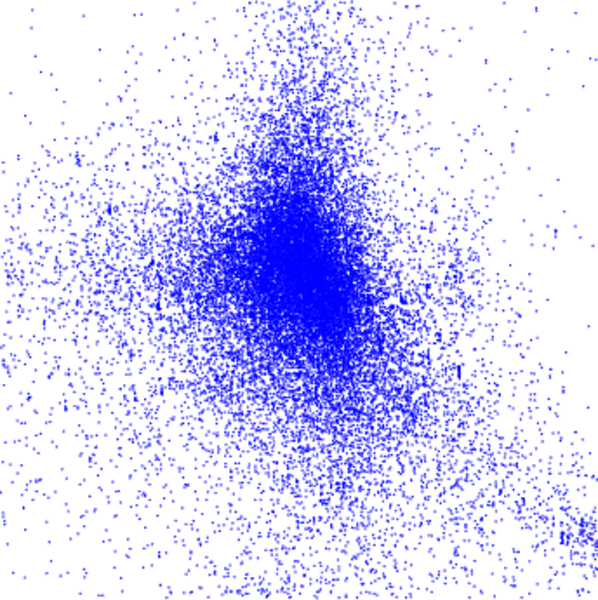
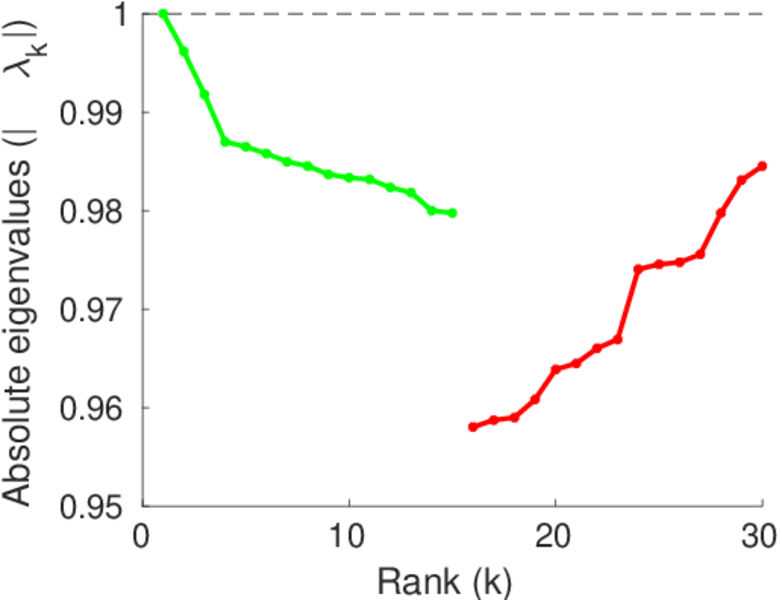
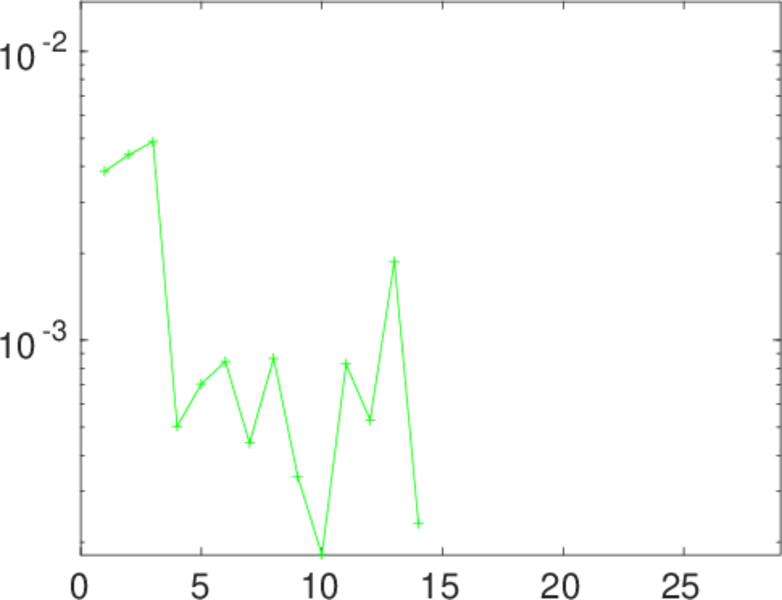
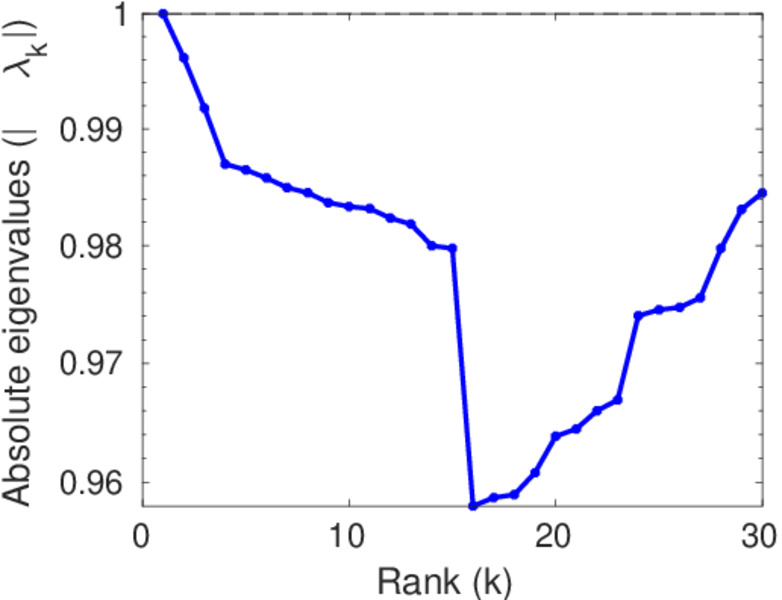
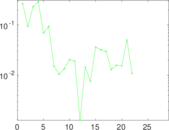
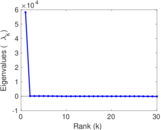
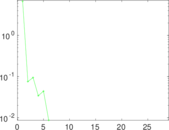
Matrix decompositions plots


Downloads
References
|
[1]
|
Jérôme Kunegis.
KONECT – The Koblenz Network Collection.
In Proc. Int. Conf. on World Wide Web Companion, pages
1343–1350, 2013.
[ http ]
|
|
[2]
|
Eunjoon Cho, Seth A. Myers, and Jure Leskovec.
Friendship and mobility: User movement in location-based social
networks.
In Proc. Int. Conf. on Knowl. Discov. and Data Min., pages
1082–1090, 2011.
|
 KONECT ‣ Networks ‣
Buy Me a Coffee
KONECT ‣ Networks ‣
Buy Me a Coffee