Gowalla
This undirected network contains user–user friendship relations from Gowalla,
a former location-based social network where user shared their locations. A
node represents a user and an edge indicates that a friendship exists between
the user represented by the left node and the user represented by the right
node.
Metadata
Statistics
| Size | n = | 196,591
|
| Volume | m = | 950,327
|
| Loop count | l = | 0
|
| Wedge count | s = | 290,400,040
|
| Claw count | z = | 787,564,904,976
|
| Cross count | x = | 2,482,179,360,928,230
|
| Triangle count | t = | 2,273,138
|
| Square count | q = | 146,652,712
|
| 4-Tour count | T4 = | 2,336,722,510
|
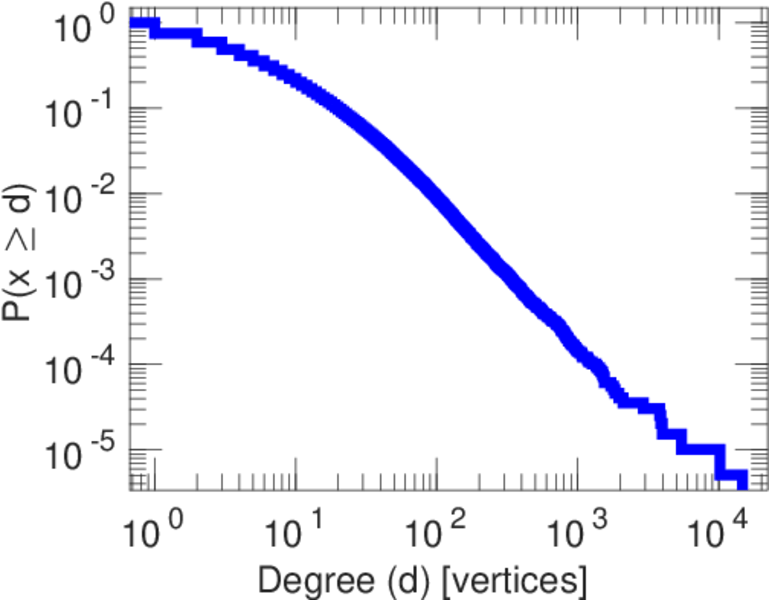
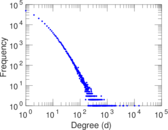
| Maximum degree | dmax = | 14,730
|
| Average degree | d = | 9.668 06
|
| Fill | p = | 4.917 88 × 10−5
|
| Size of LCC | N = | 196,591
|
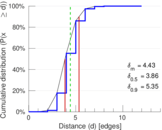
| Diameter | δ = | 16
|
| 50-Percentile effective diameter | δ0.5 = | 3.857 66
|
| 90-Percentile effective diameter | δ0.9 = | 5.350 12
|
| Median distance | δM = | 4
|
| Mean distance | δm = | 4.426 42
|
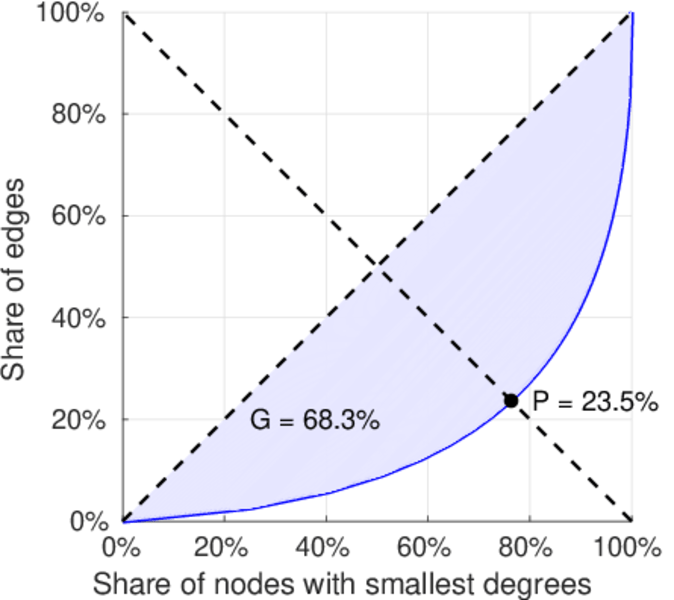
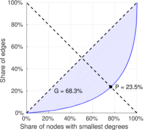
| Gini coefficient | G = | 0.683 353
|
| Balanced inequality ratio | P = | 0.235 012
|
| Relative edge distribution entropy | Her = | 0.904 326
|
| Power law exponent | γ = | 1.730 70
|
| Tail power law exponent | γt = | 2.651 00
|
| Tail power law exponent with p | γ3 = | 2.651 00
|
| p-value | p = | 0.000 00
|
| Degree assortativity | ρ = | −0.029 254 7
|
| Degree assortativity p-value | pρ = | 0.000 00
|
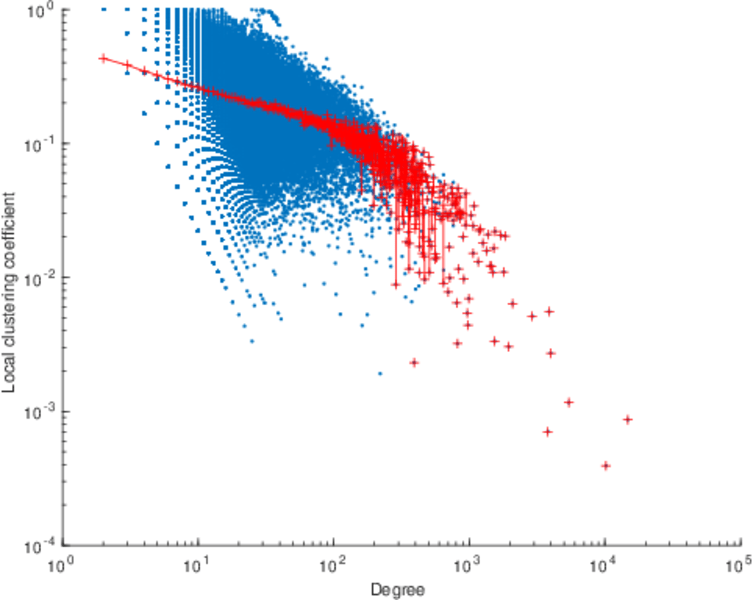
| Clustering coefficient | c = | 0.023 482 8
|
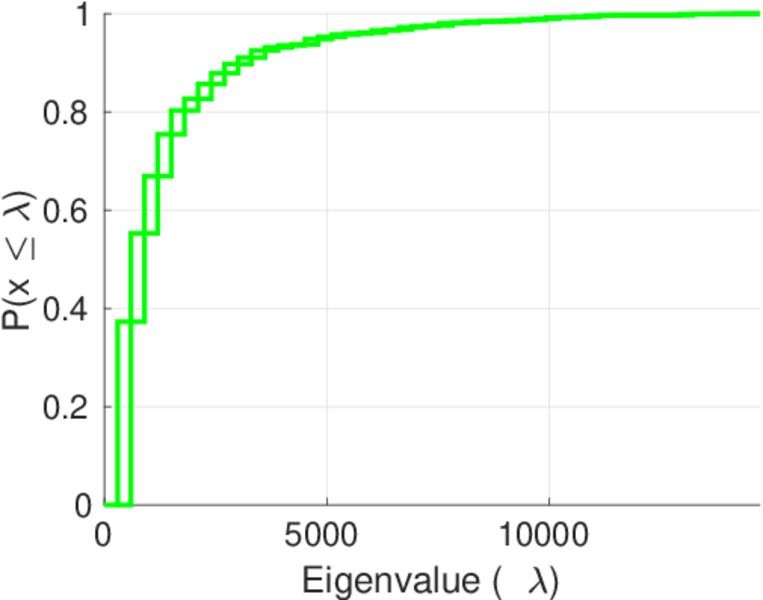
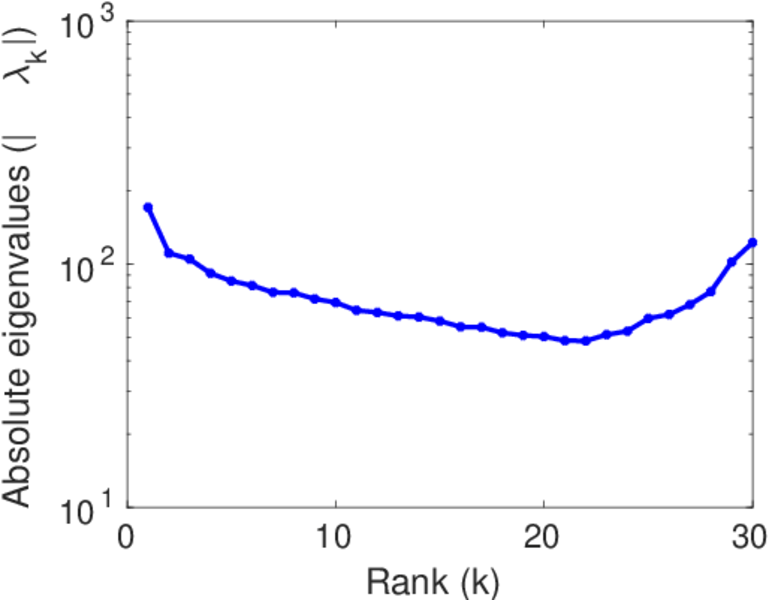
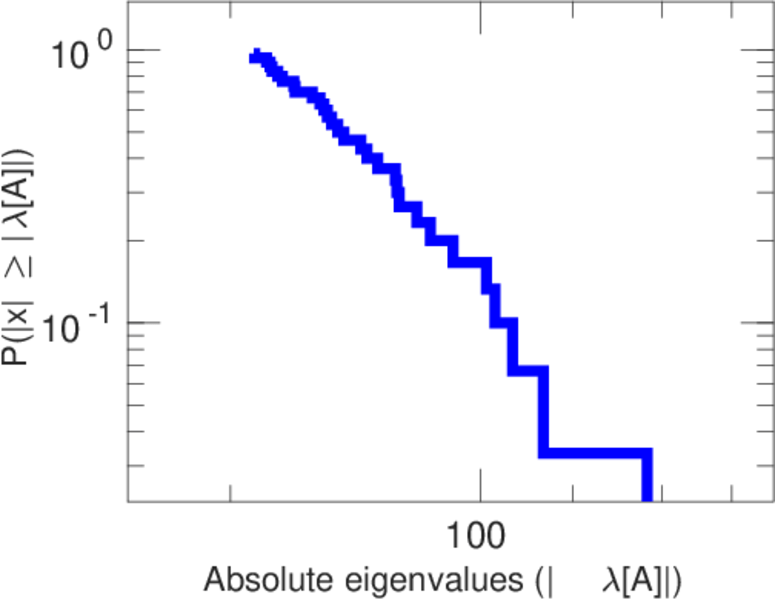
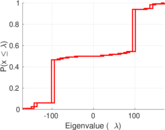
| Spectral norm | α = | 170.939
|
| Algebraic connectivity | a = | 0.021 547 2
|
| Spectral separation | |λ1[A] / λ2[A]| = | 1.395 92
|
| Non-bipartivity | bA = | 0.283 628
|
| Normalized non-bipartivity | bN = | 0.017 892 4
|
| Algebraic non-bipartivity | χ = | 0.033 180 9
|
| Spectral bipartite frustration | bK = | 0.000 858 003
|
| Controllability | C = | 36,679
|
| Relative controllability | Cr = | 0.186 575
|
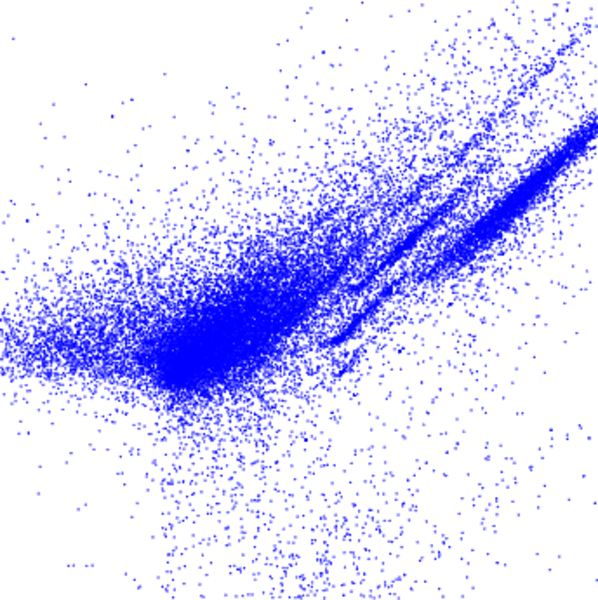
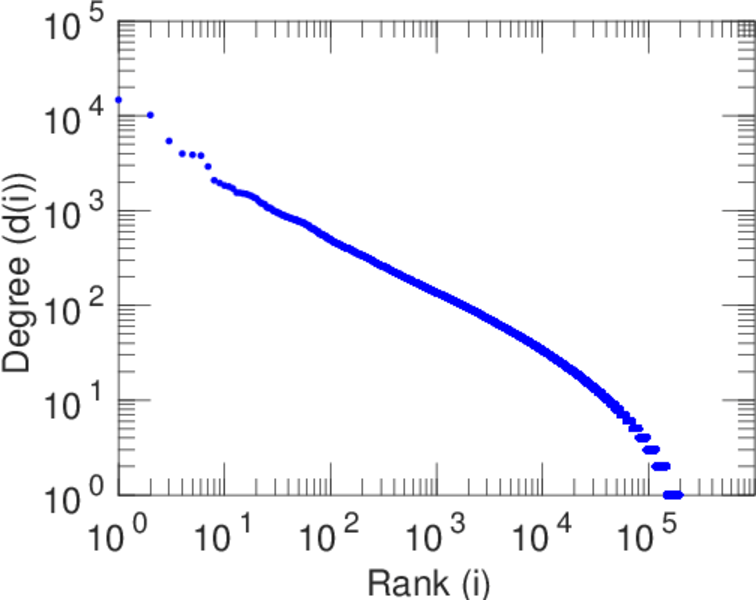
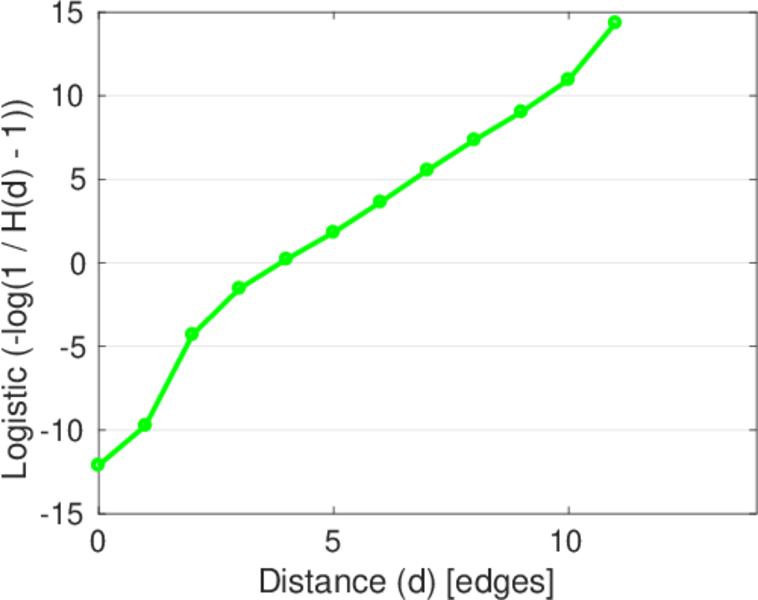
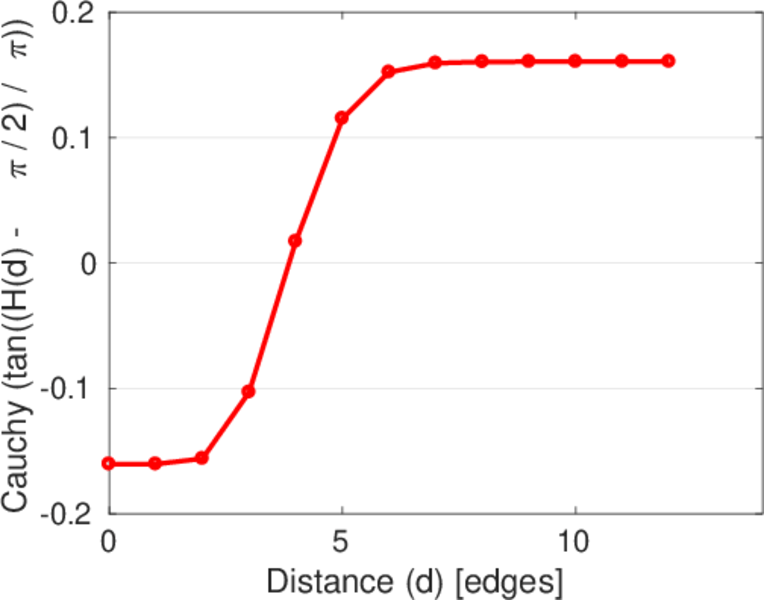
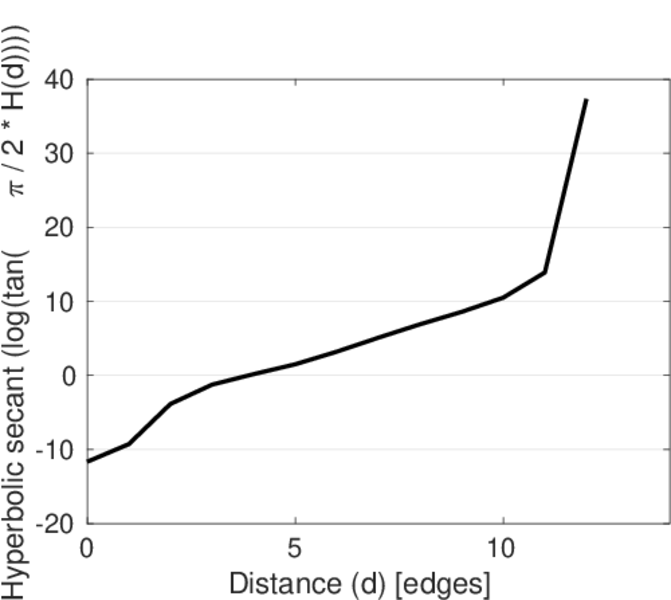
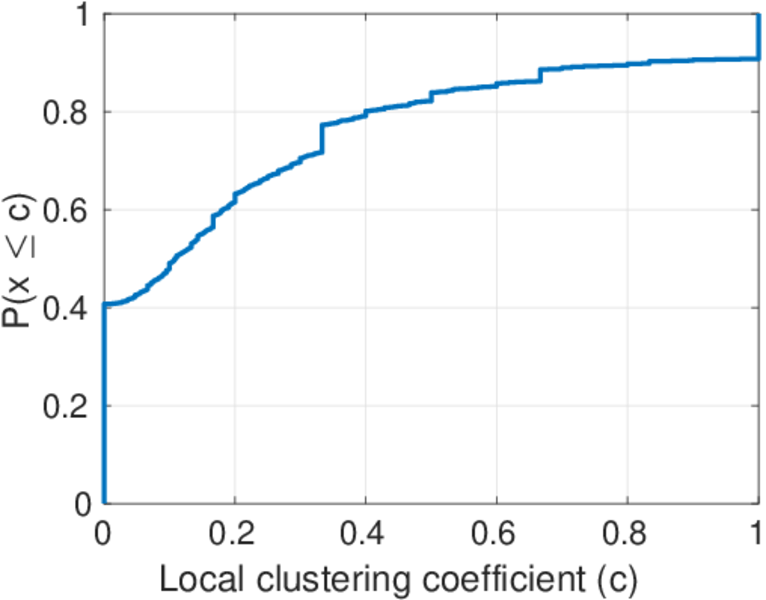
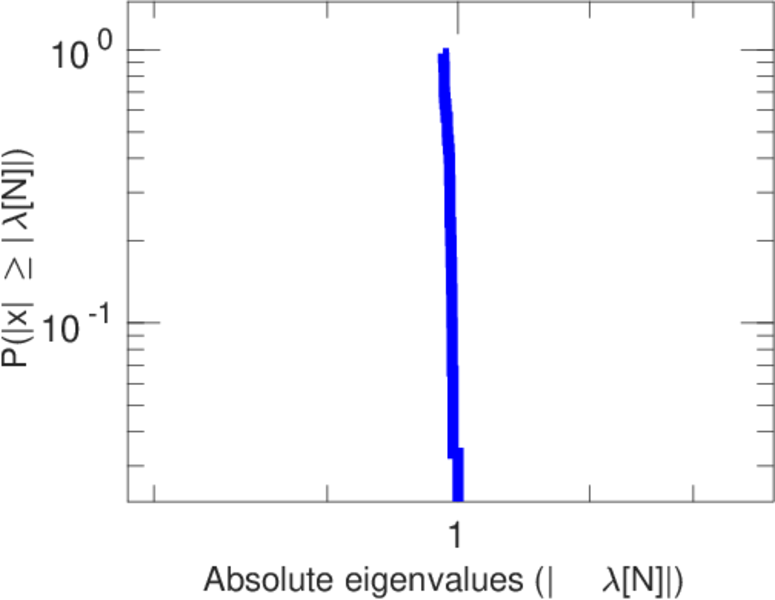
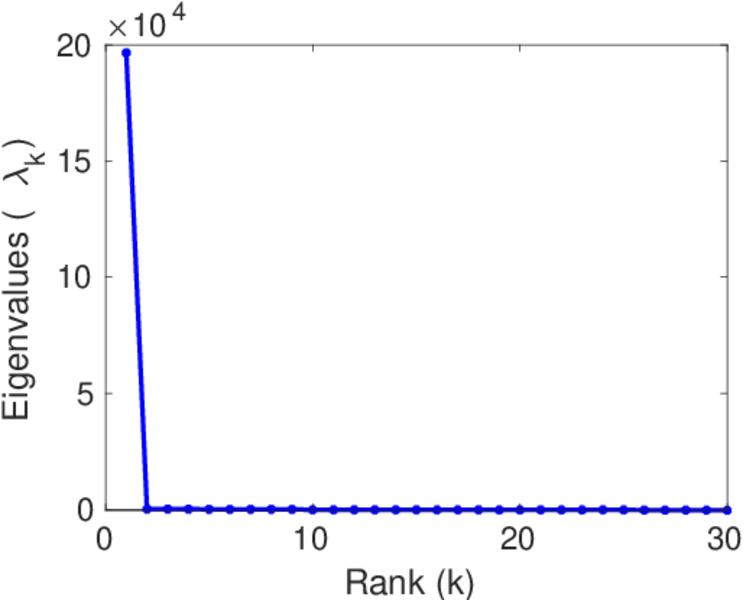
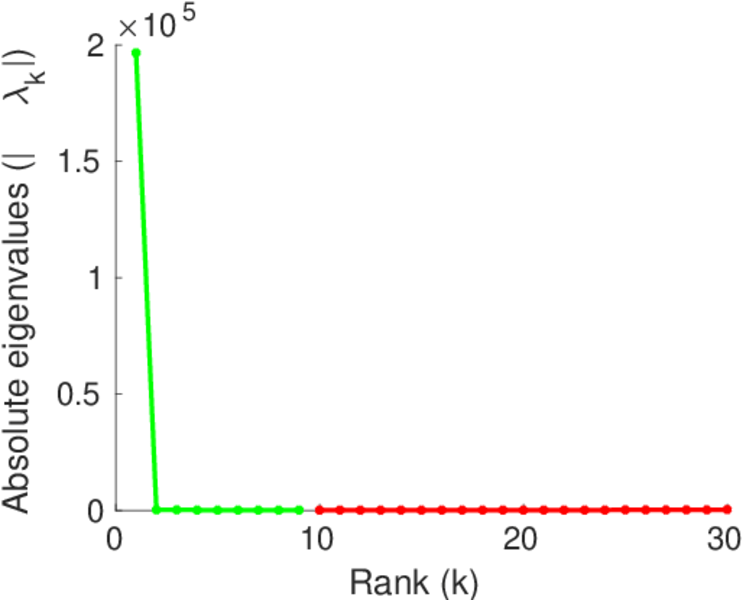
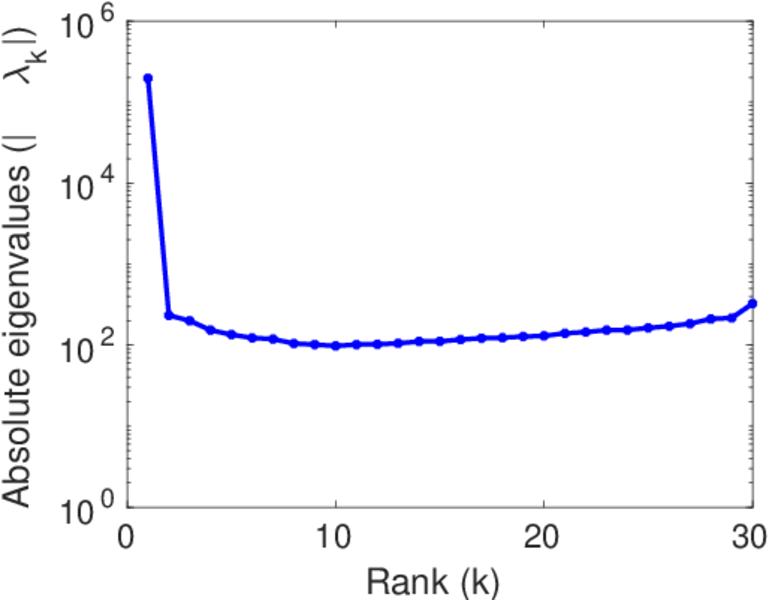
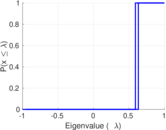
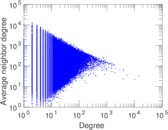
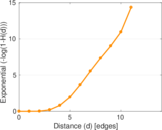
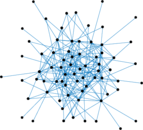
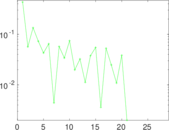
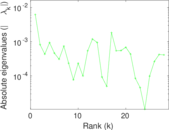
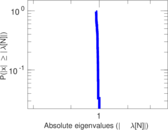
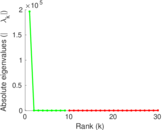
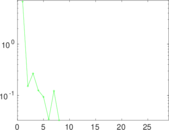
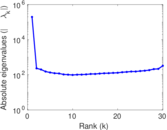
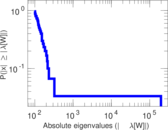
Plots


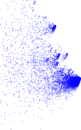
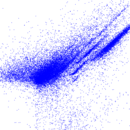


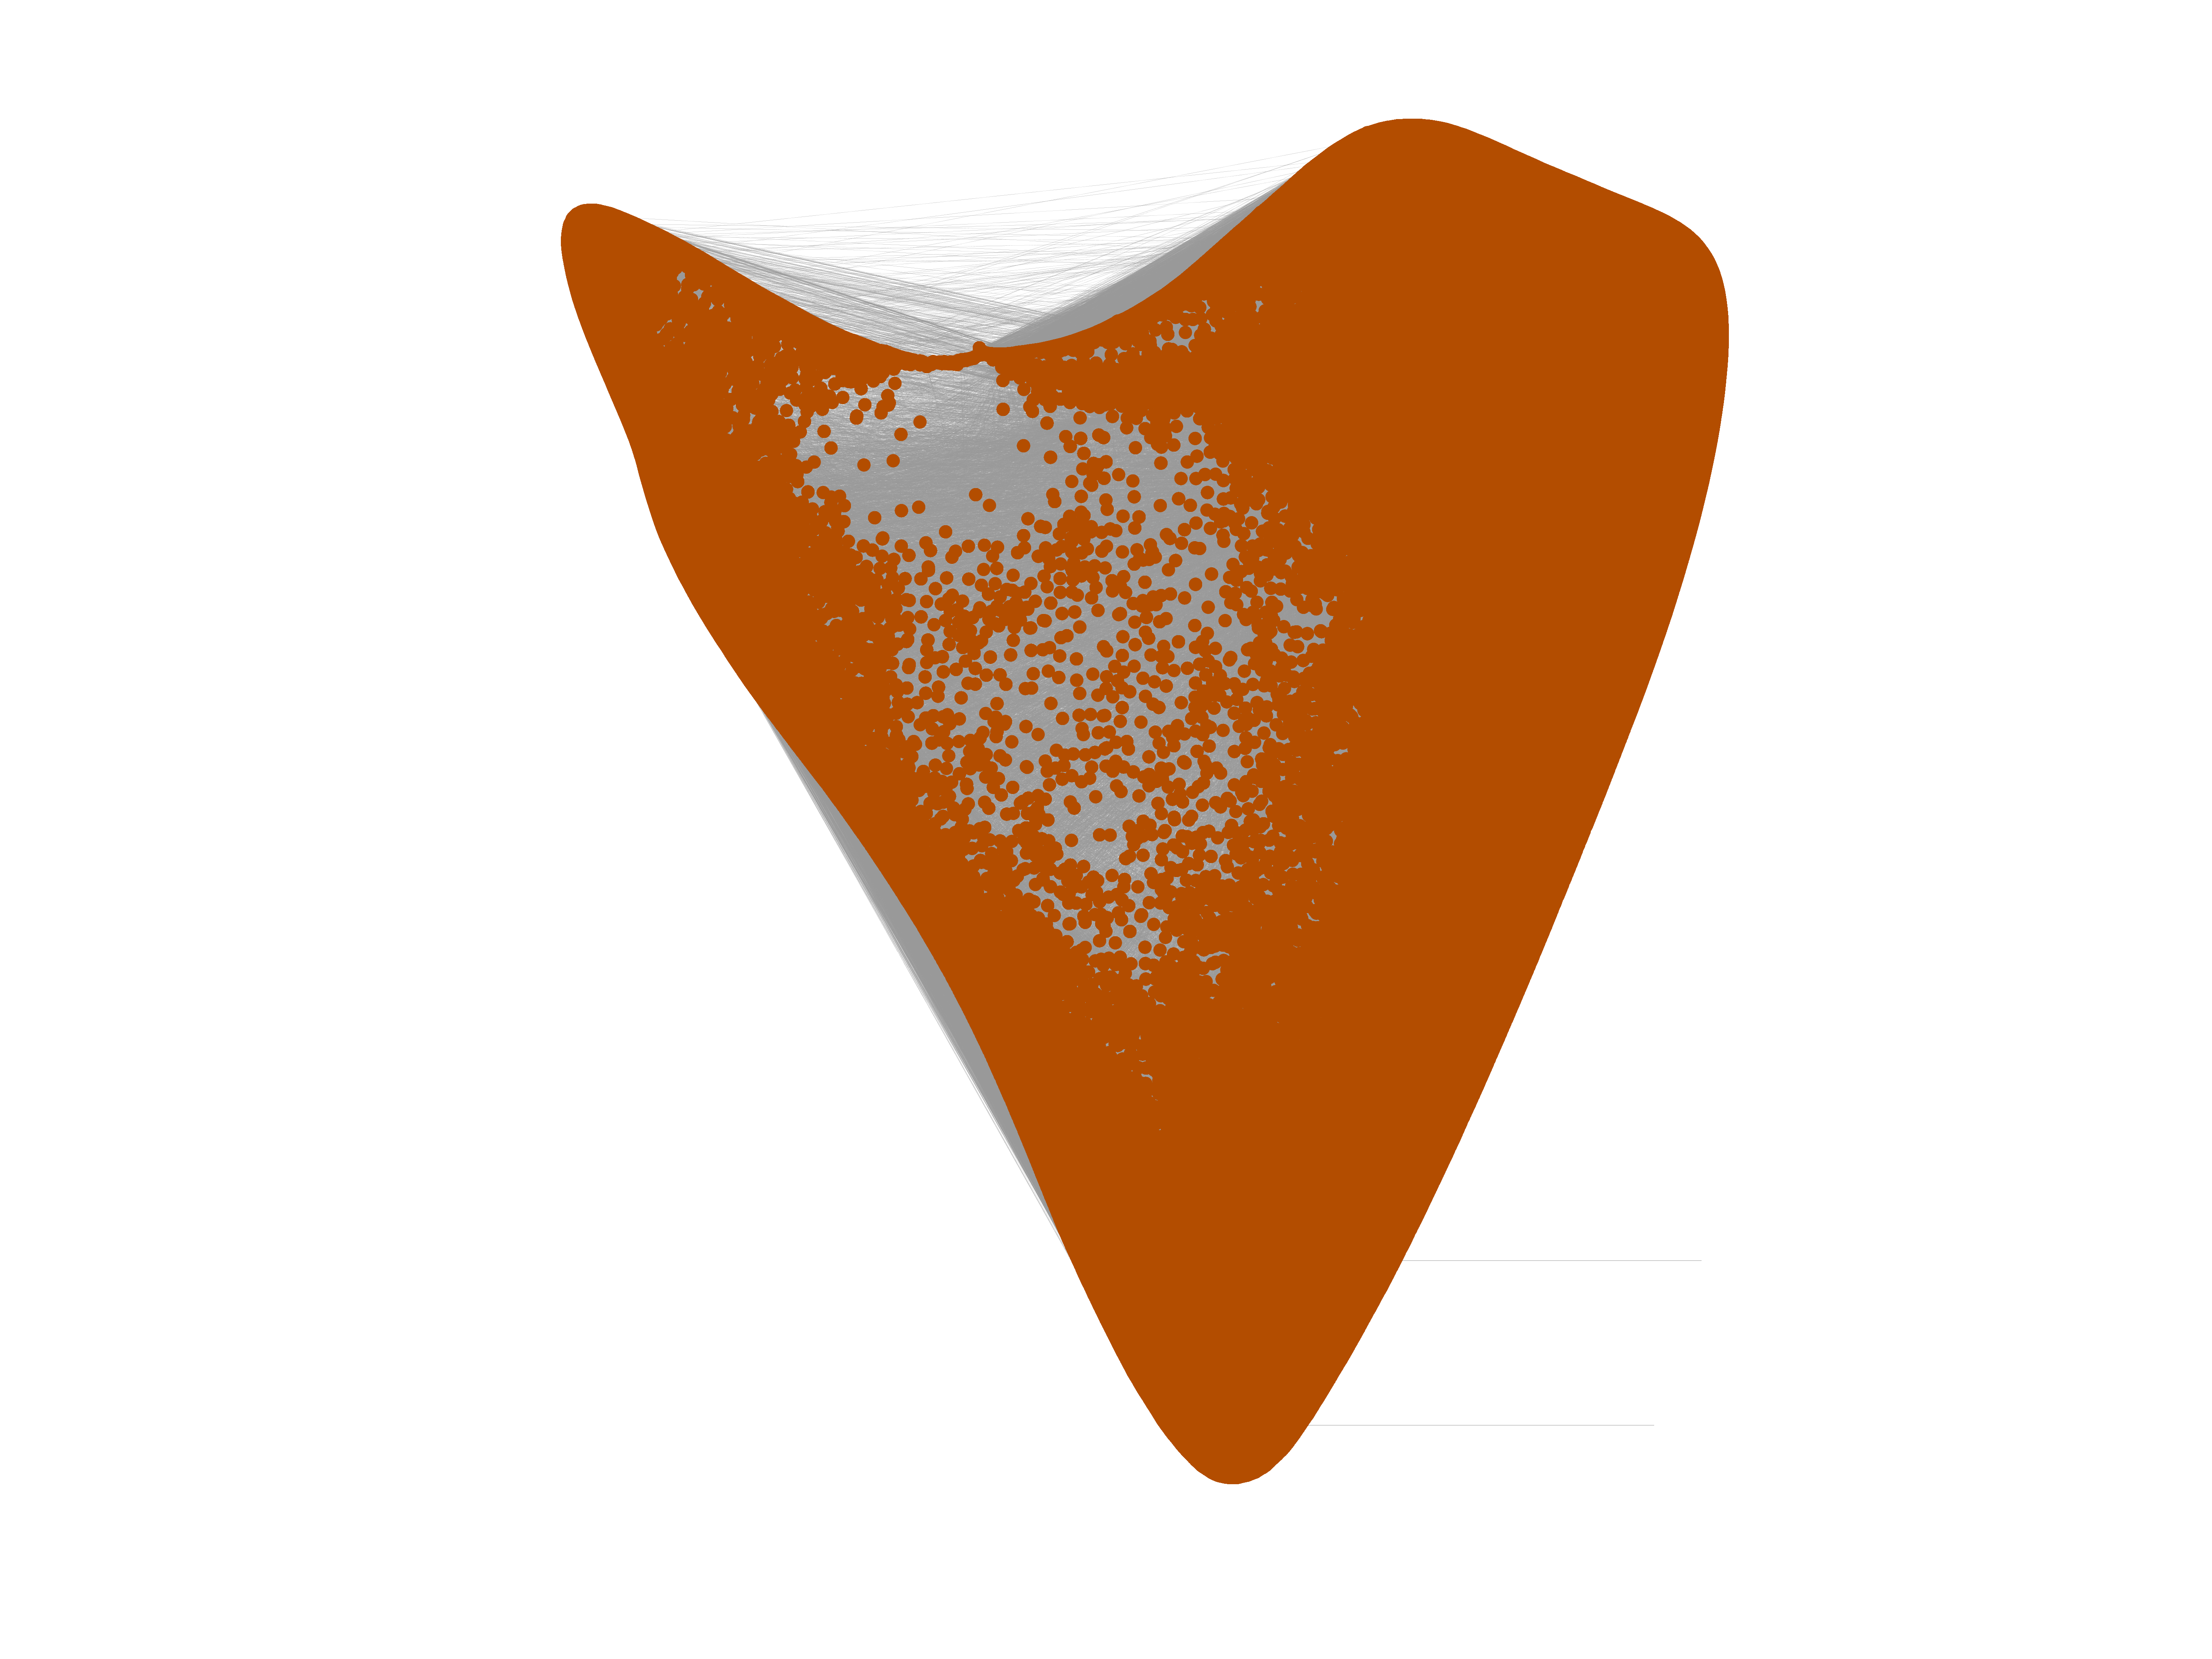
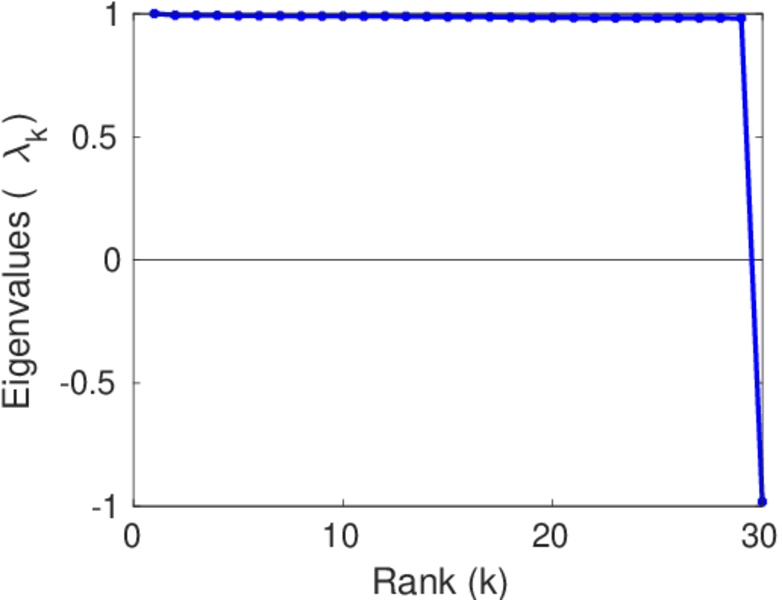
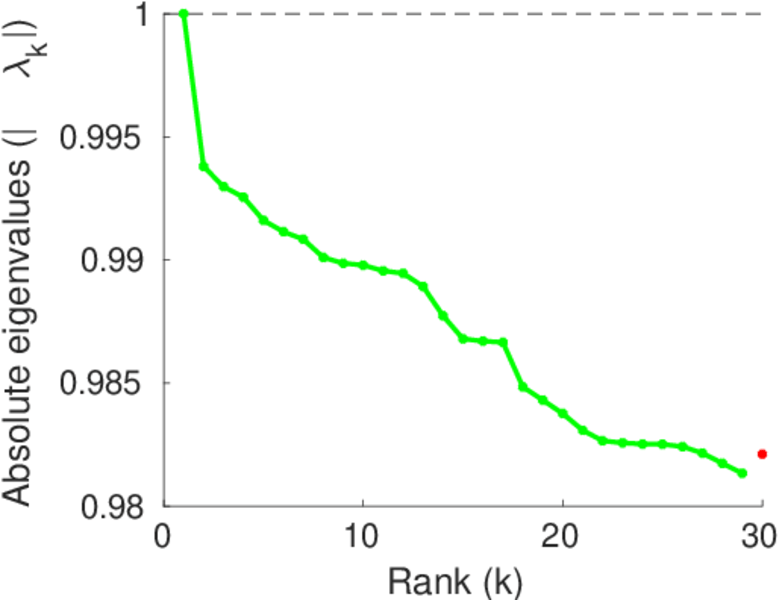
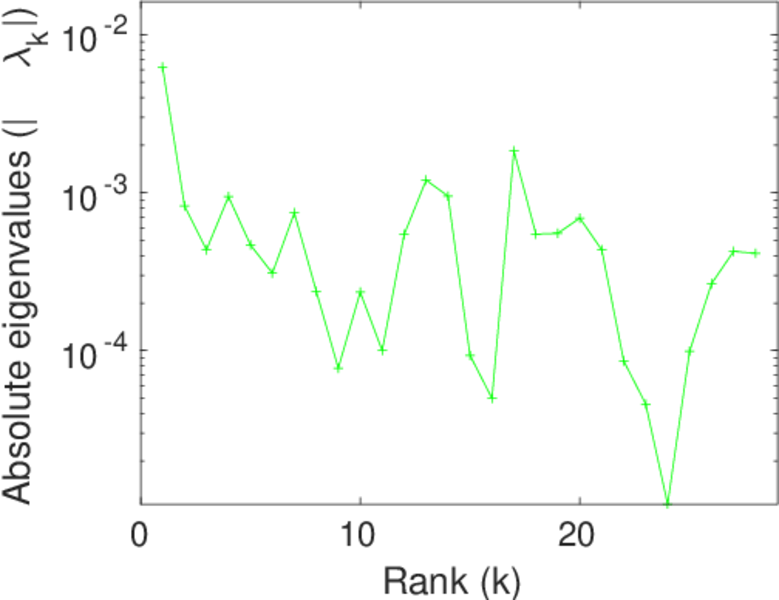
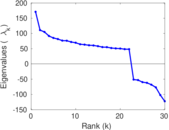
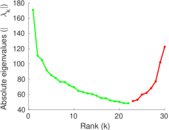
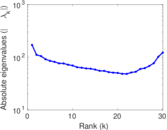
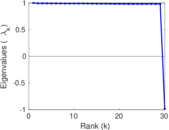
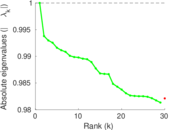
Matrix decompositions plots


Downloads
References
|
[1]
|
Jérôme Kunegis.
KONECT – The Koblenz Network Collection.
In Proc. Int. Conf. on World Wide Web Companion, pages
1343–1350, 2013.
[ http ]
|
|
[2]
|
Eunjoon Cho, Seth A. Myers, and Jure Leskovec.
Friendship and mobility: User movement in location-based social
networks.
In Proc. Int. Conf. on Knowl. Discov. and Data Min., pages
1082–1090, 2011.
|
 KONECT ‣ Networks ‣
Buy Me a Coffee
KONECT ‣ Networks ‣
Buy Me a Coffee