 KONECT ‣ Networks ‣
Buy Me a Coffee
KONECT ‣ Networks ‣
Buy Me a Coffee
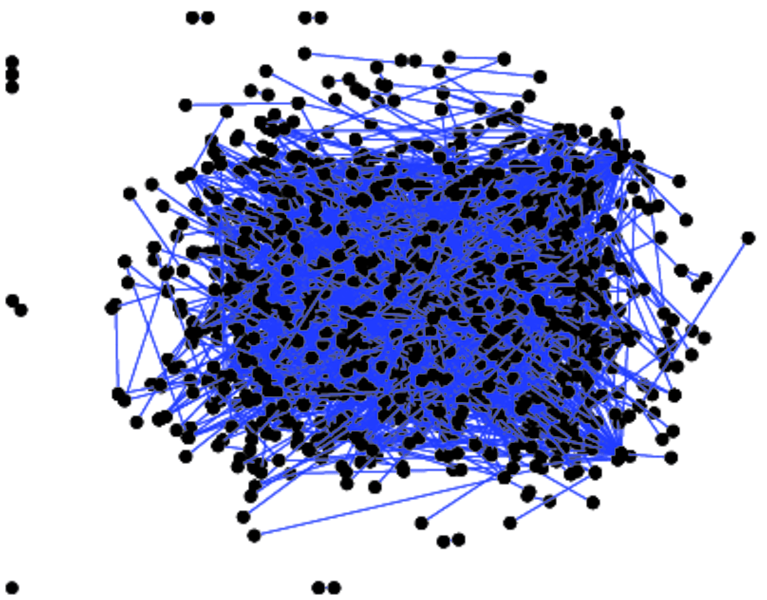
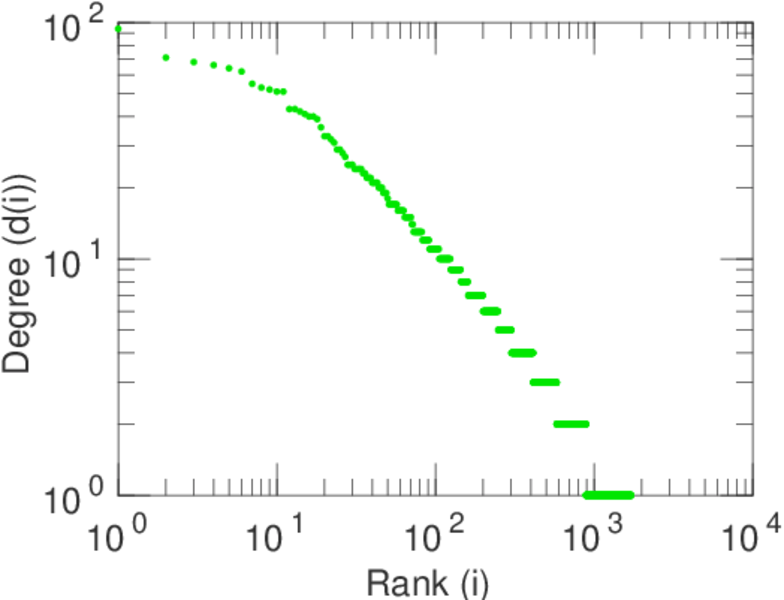
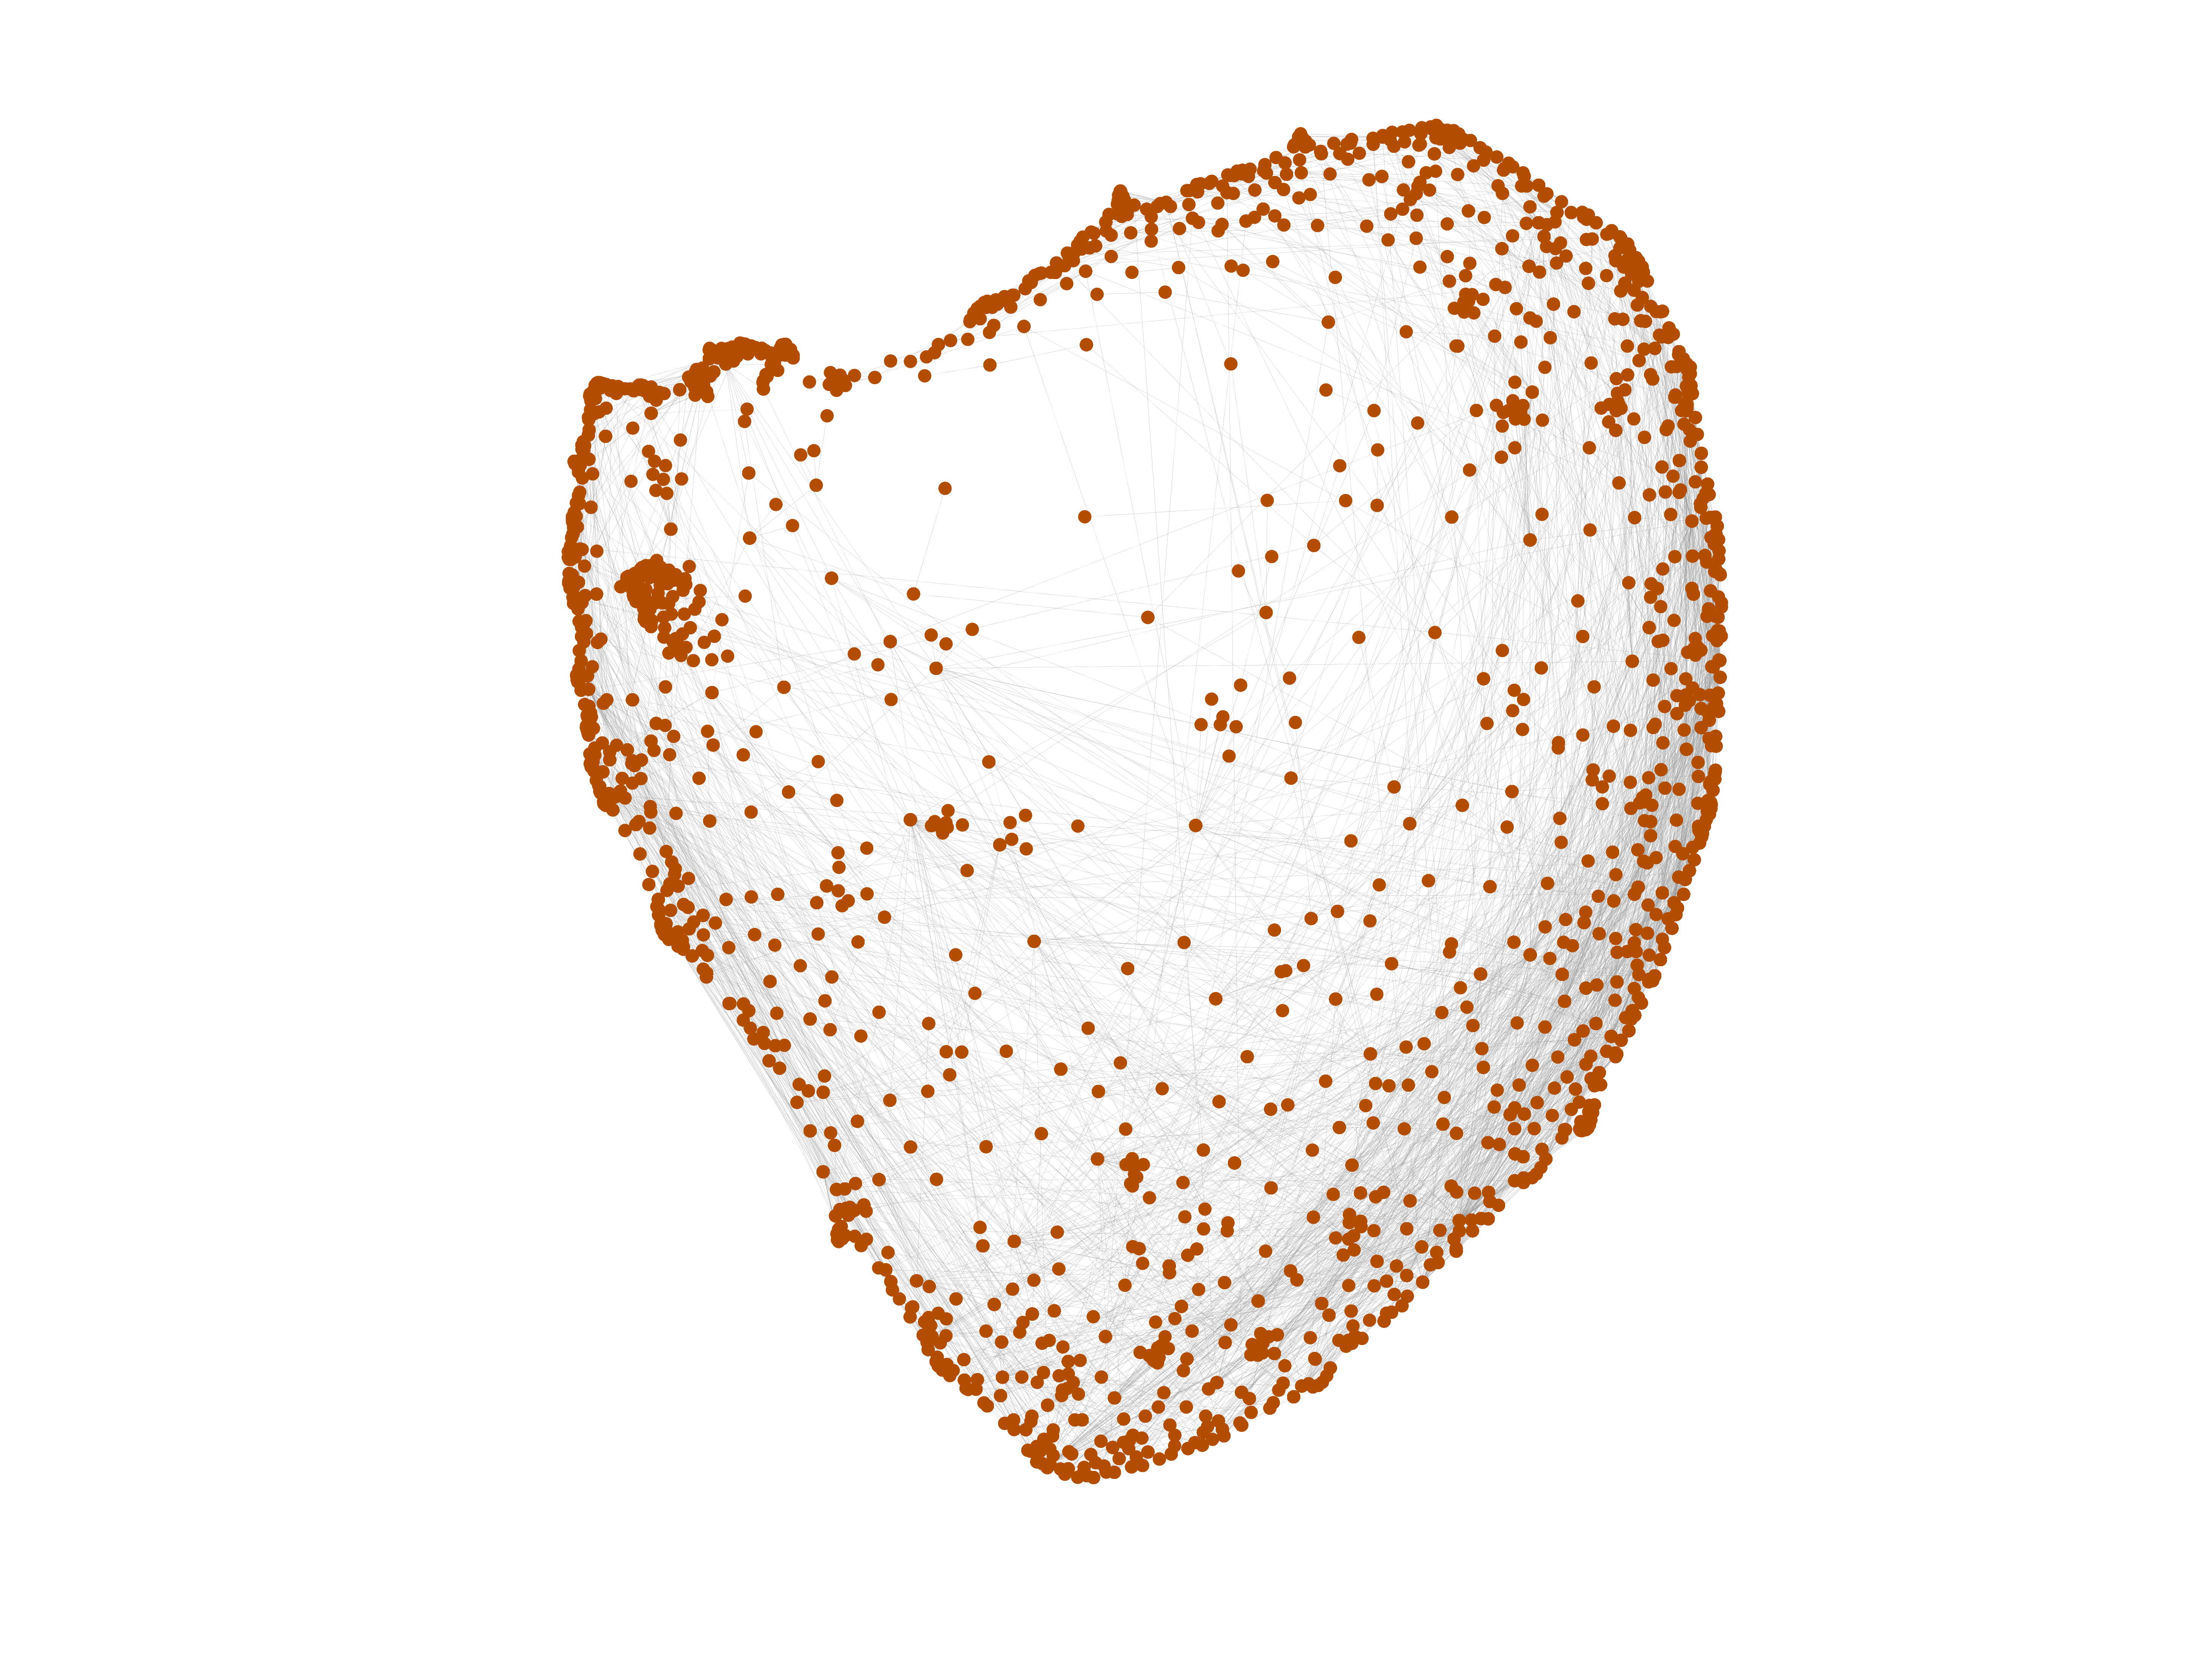
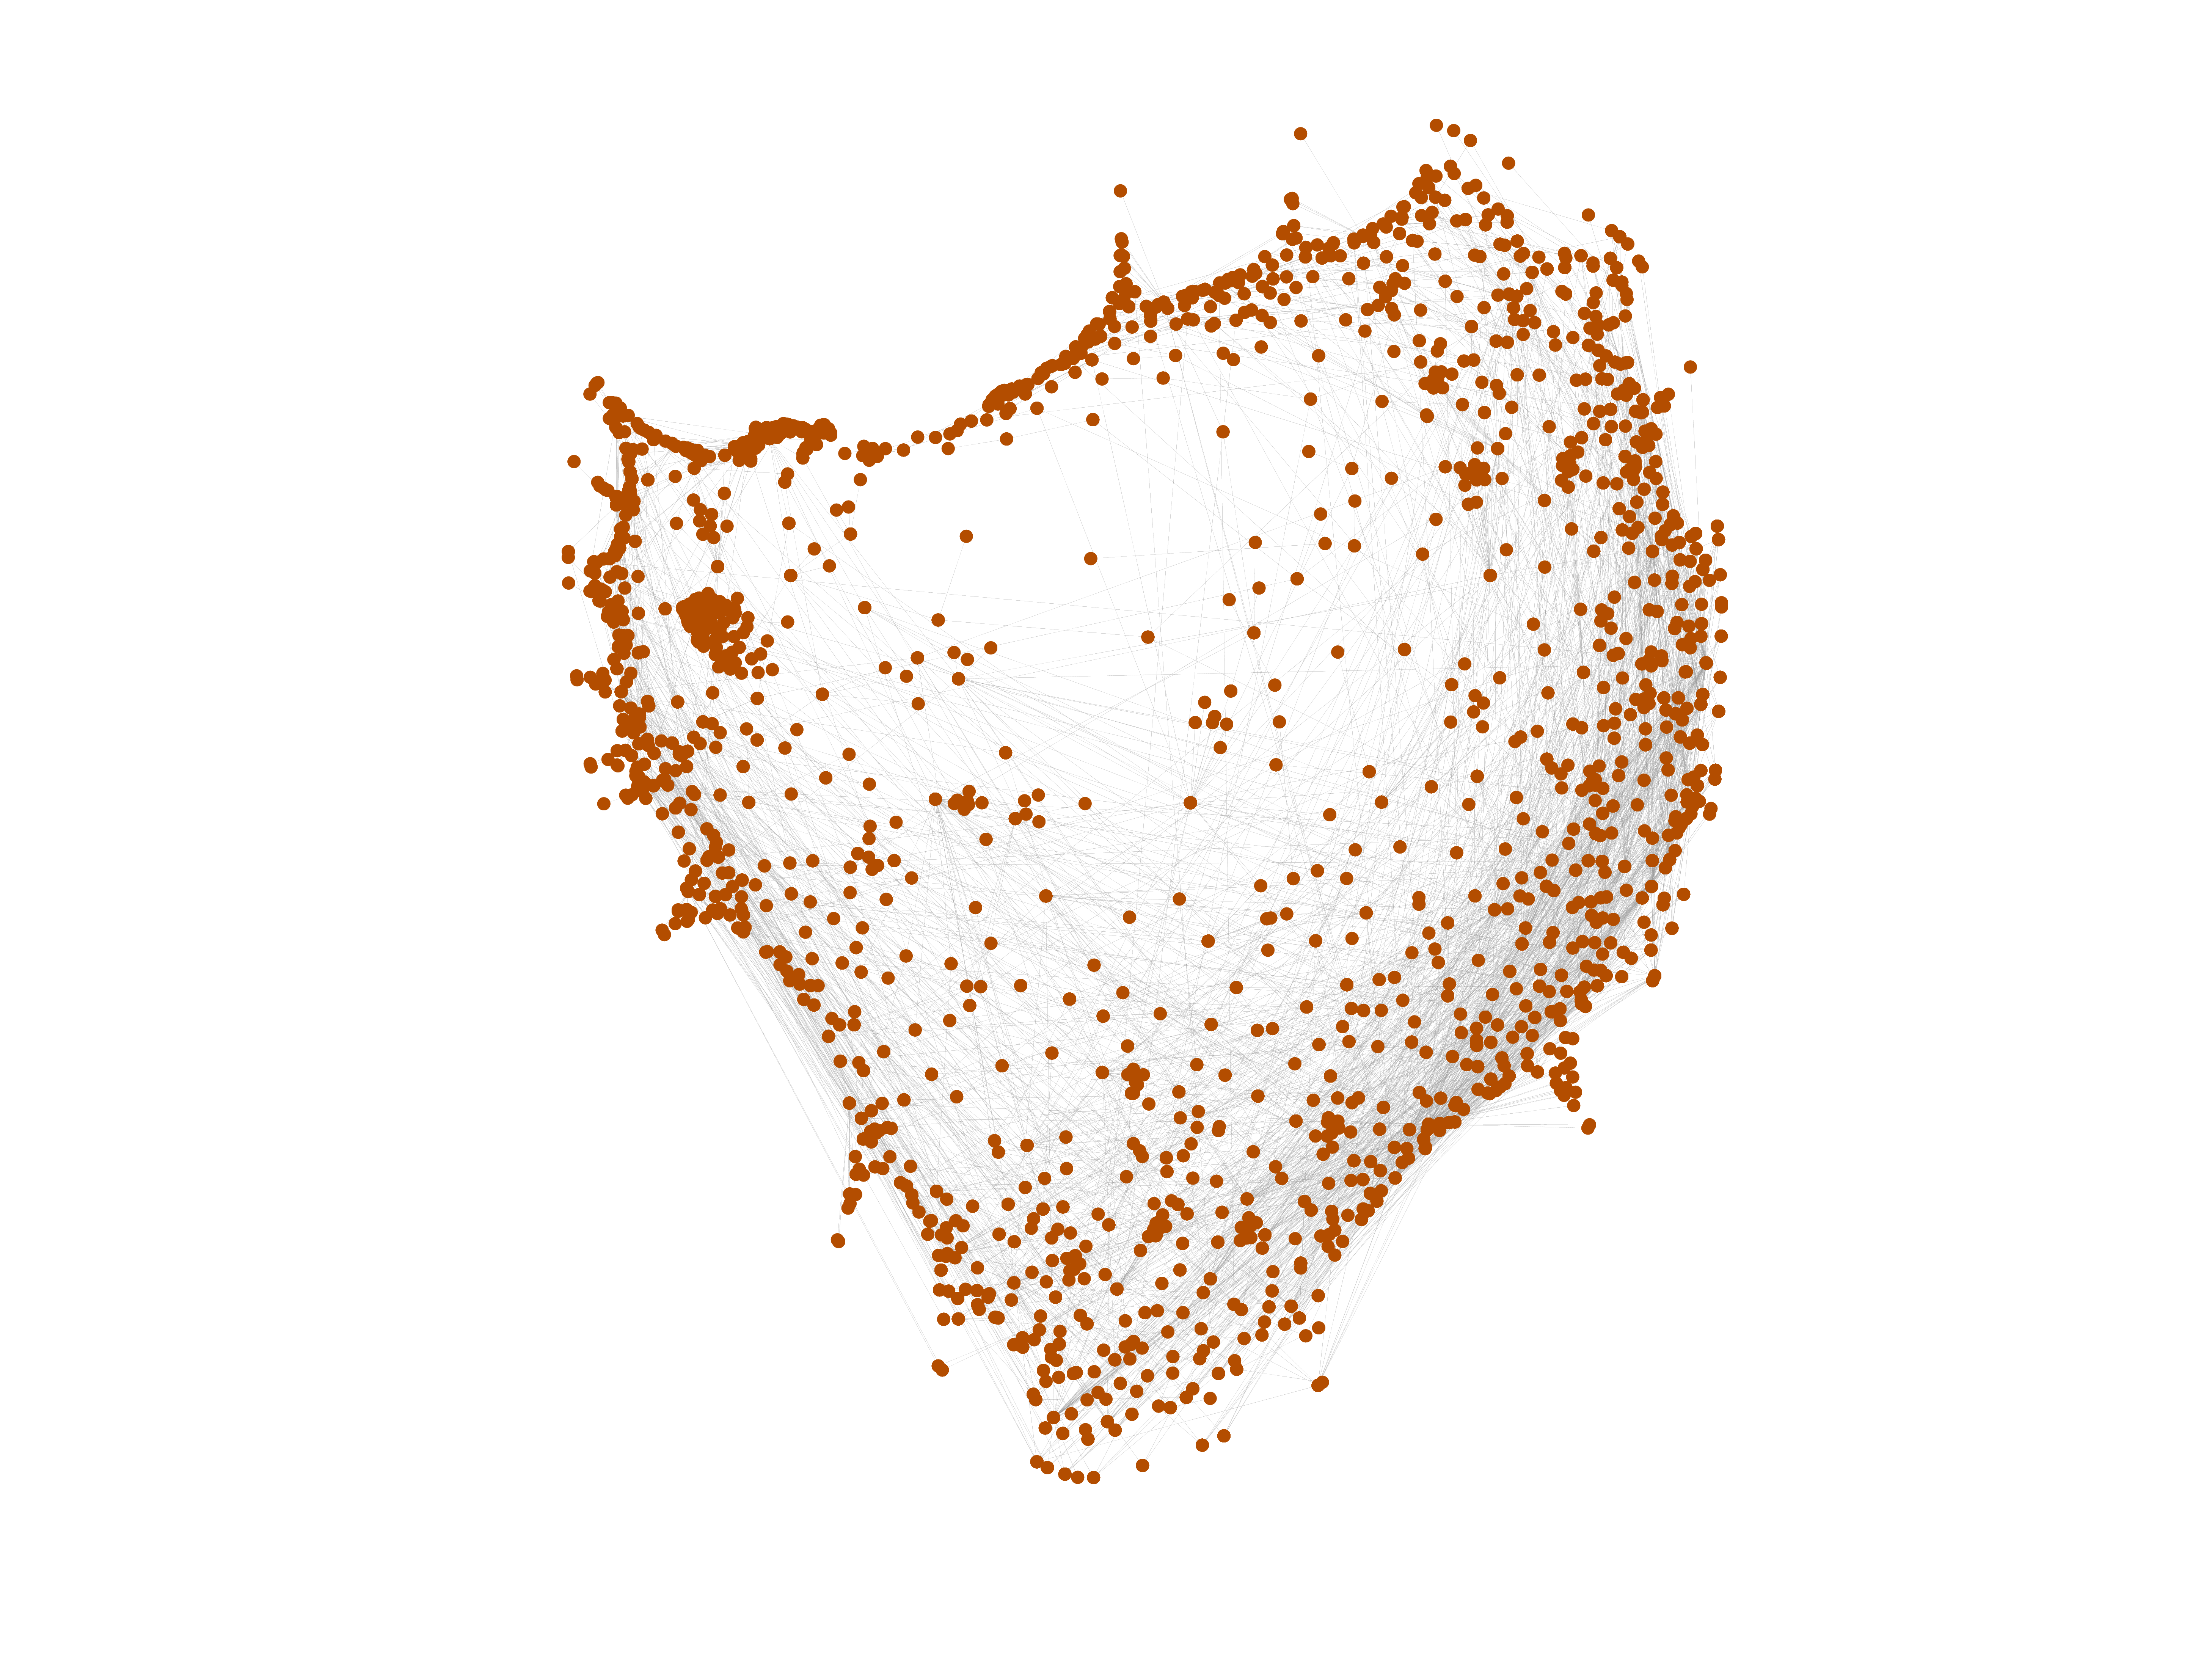
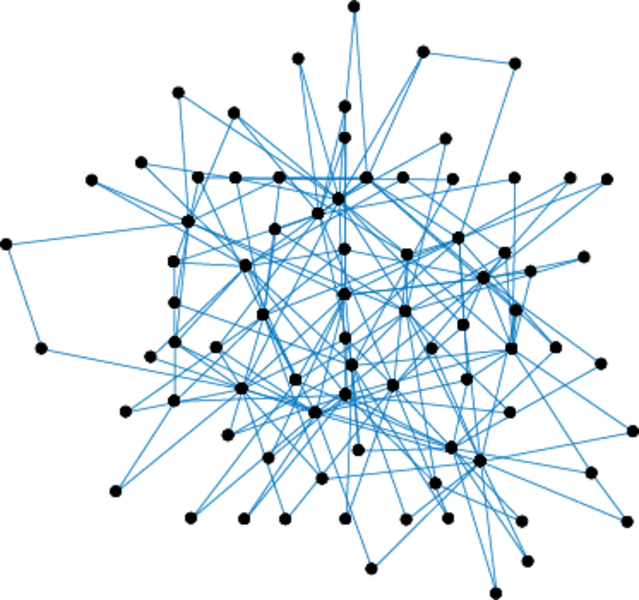
This network represens interacting pairs of protein in Humans (Homo sapiens).
| Code | MS
| |
| Internal name | maayan-Stelzl
| |
| Name | Human proteins (Stelzl) | |
| Data source | http://research.mssm.edu/maayan/datasets/qualitative_networks.shtml | |
| Availability | Dataset is available for download | |
| Consistency check | Dataset passed all tests | |
| Category | Metabolic network | |
| Node meaning | Protein | |
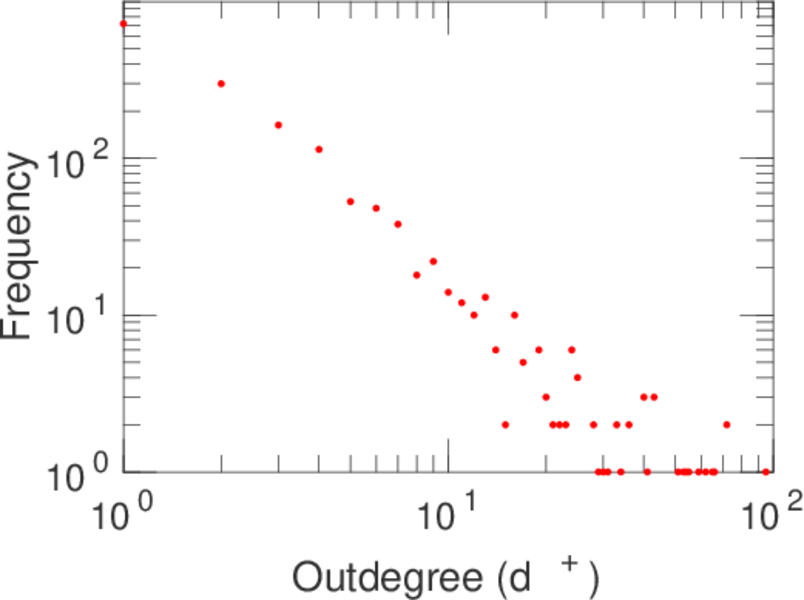
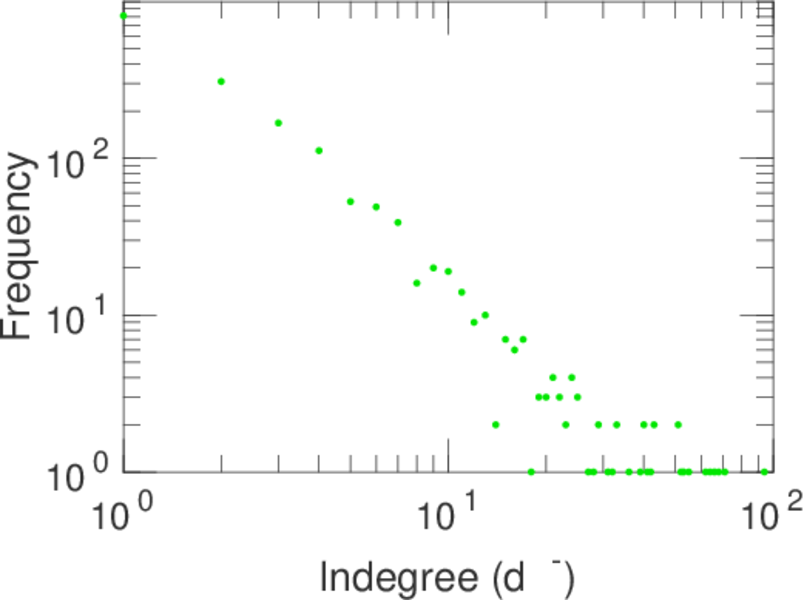
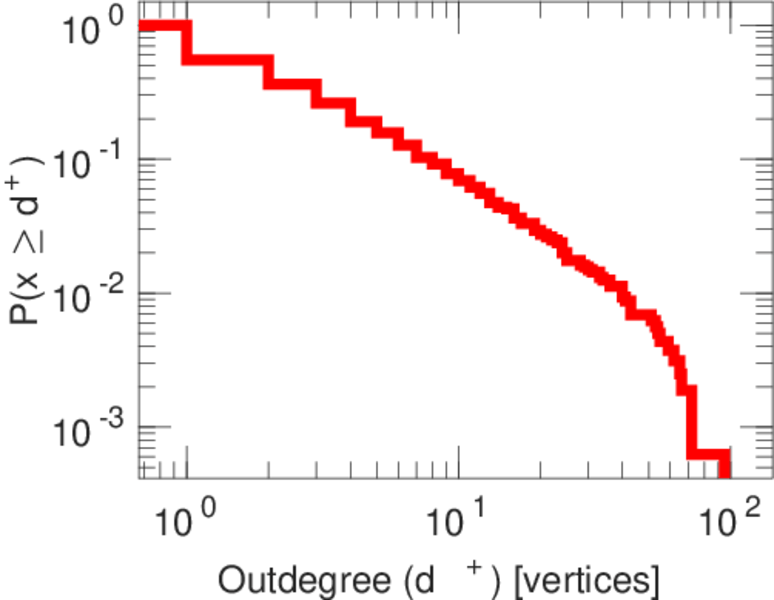
| Edge meaning | Interaction | |
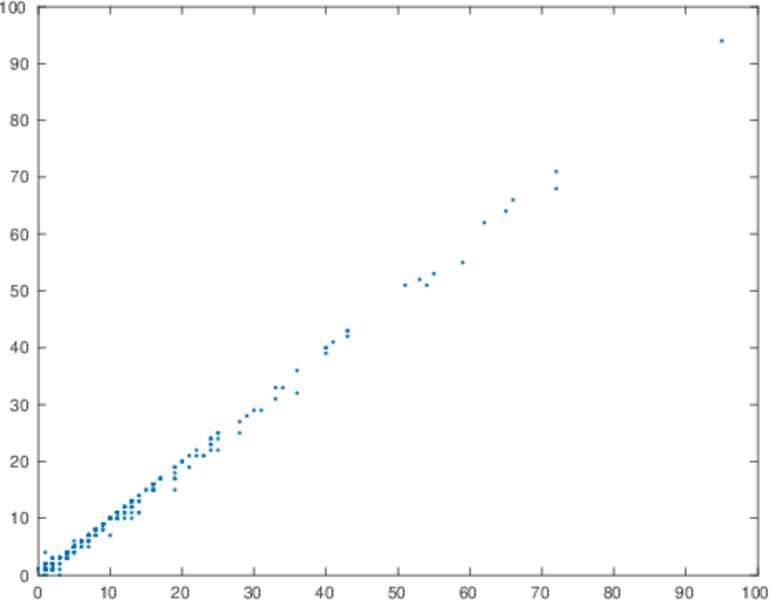
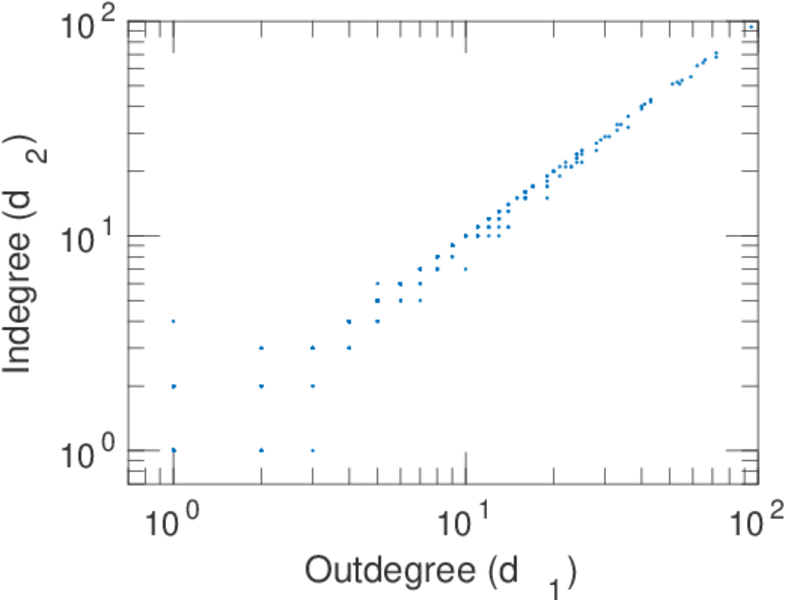
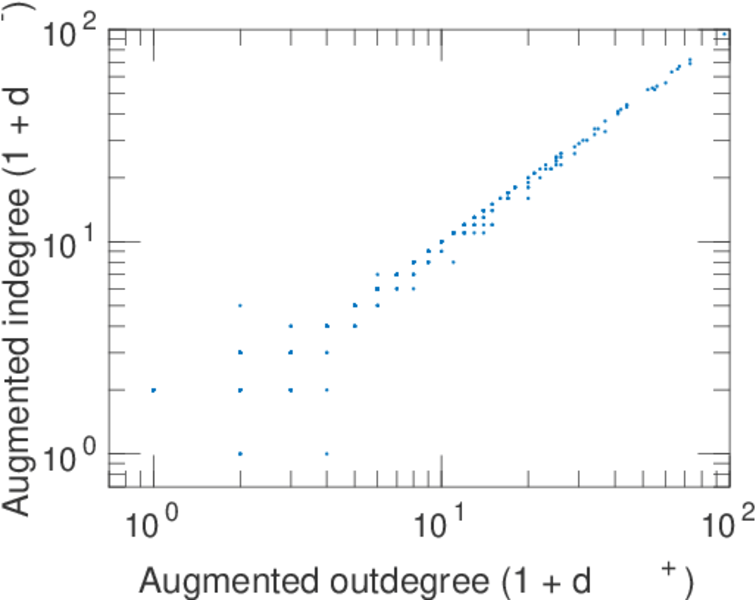
| Network format | Unipartite, directed | |
| Edge type | Unweighted, no multiple edges | |
| Reciprocal | Contains reciprocal edges | |
| Directed cycles | Contains directed cycles | |
| Loops | Contains loops |


| [1] | Jérôme Kunegis. KONECT – The Koblenz Network Collection. In Proc. Int. Conf. on World Wide Web Companion, pages 1343–1350, 2013. [ http ] |
| [2] | U. Stelzl, U. Worm, M. Lalowski, C. Haenig, F. H. Brembeck, H. Goehler, M. Stroedicke, M. Zenkner, A. Schoenherr, S. Koeppen, J. Timm, S. Mintzlaff, C. Abraham, N. Bock, S. Kietzmann, A. Goedde, E Toksöz, A. Droege, S. Krobitsch, B. Korn, W. Birchmeier, H. Lehrach, and E. E. Wanker. A human protein–protein interaction network: A resource for annotating the proteome. Cell, 122:957–968, 2005. |