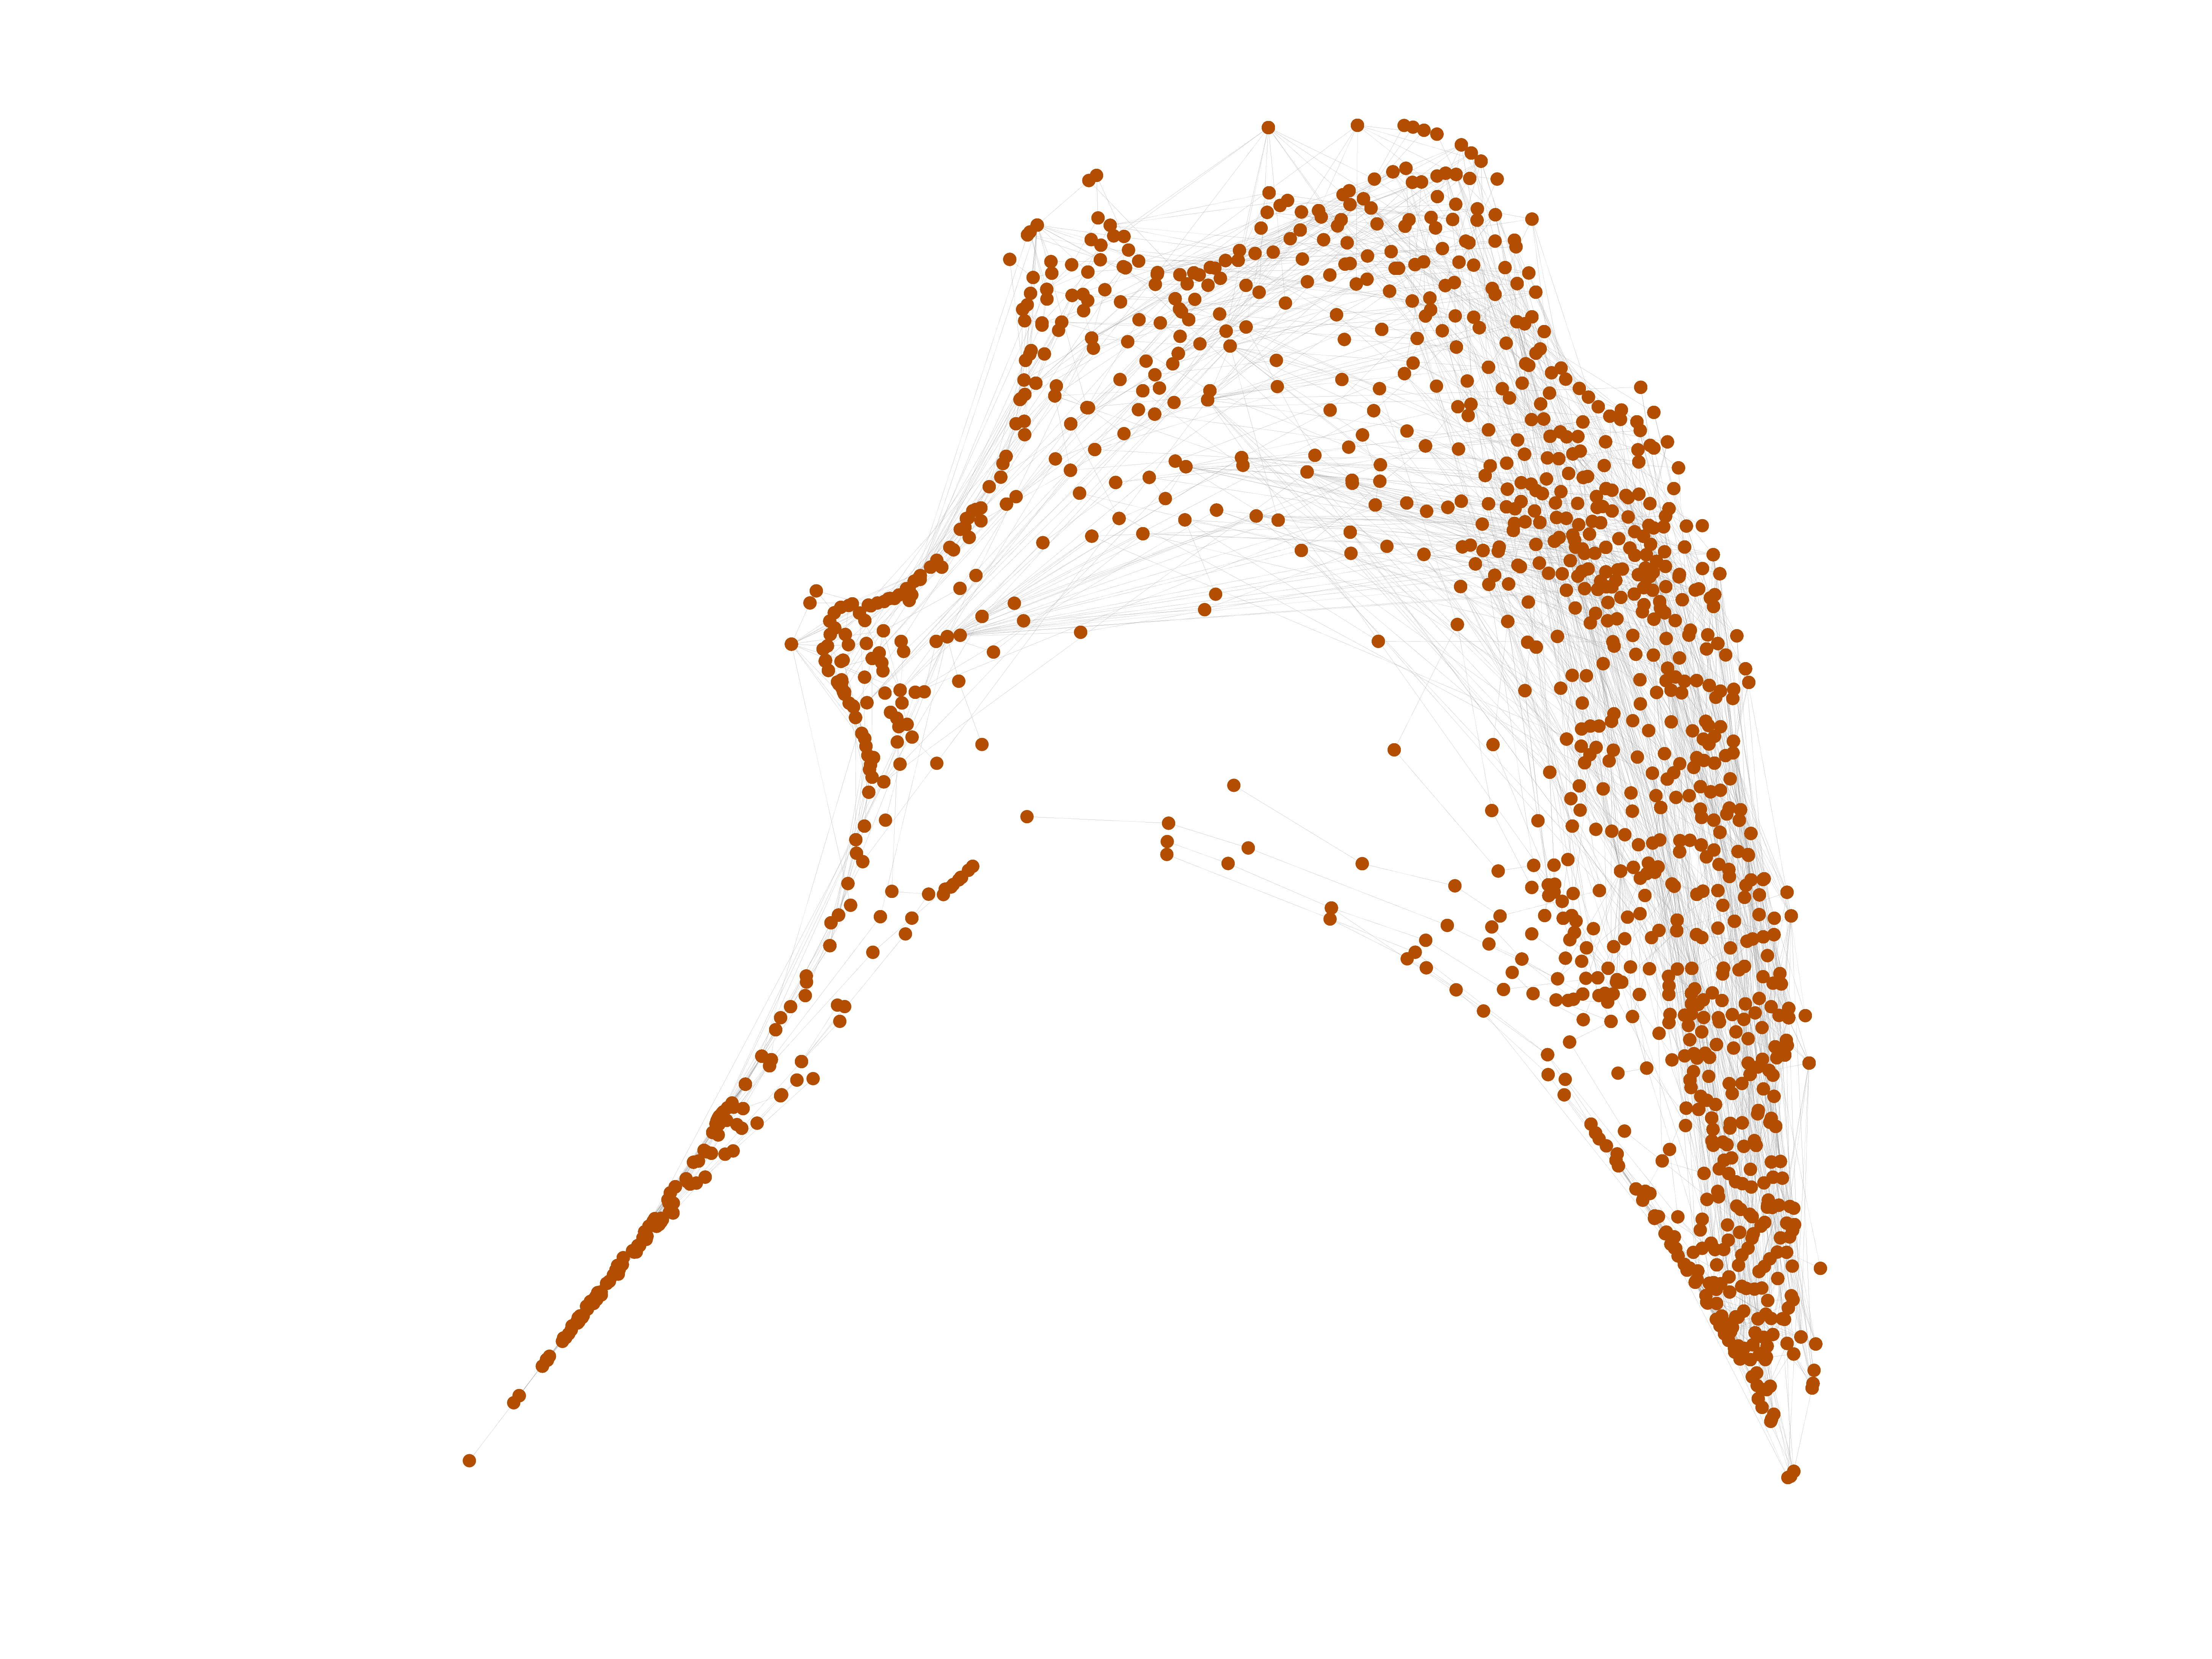
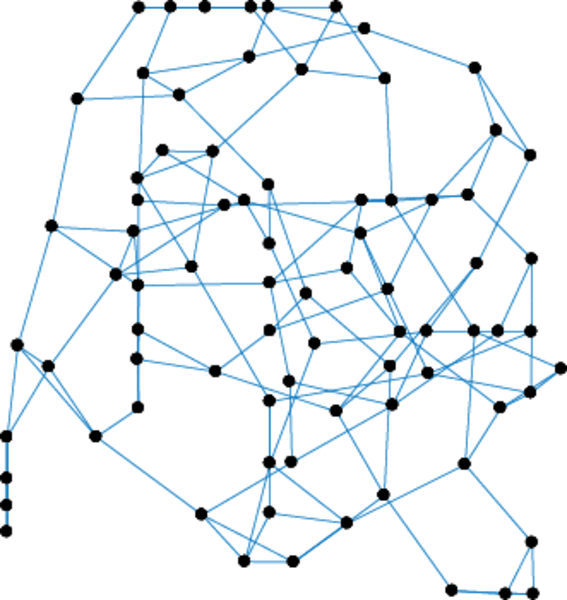
Air traffic control
This network was constructed from the USA's FAA (Federal Aviation
Administration) National Flight Data Center (NFDC), Preferred Routes Database.
Nodes in this network represent airports or service centers and links are
created from strings of preferred routes recommended by the NFDC.
Metadata
Statistics
| Size | n = | 1,226
|
| Volume | m = | 2,615
|
| Loop count | l = | 2
|
| Wedge count | s = | 15,307
|
| Claw count | z = | 94,389
|
| Cross count | x = | 461,087
|
| Triangle count | t = | 326
|
| Square count | q = | 1,103
|
| 4-Tour count | T4 = | 74,868
|
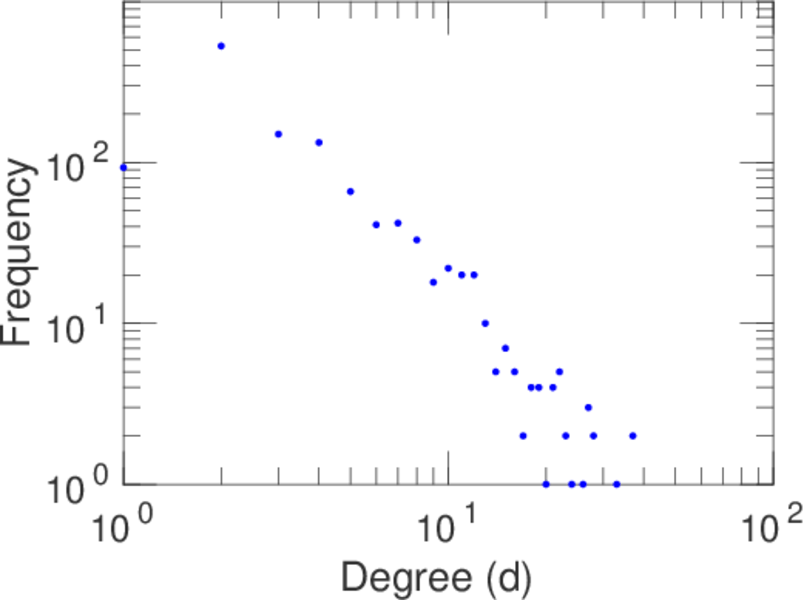
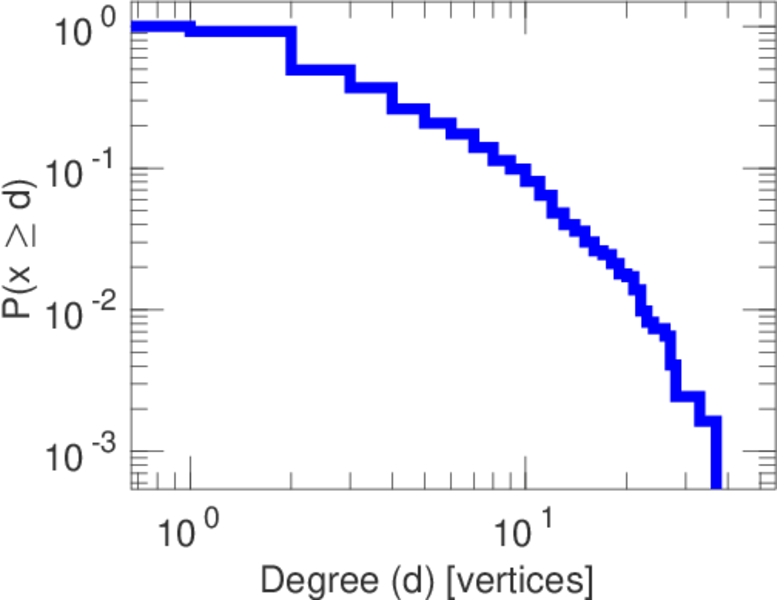
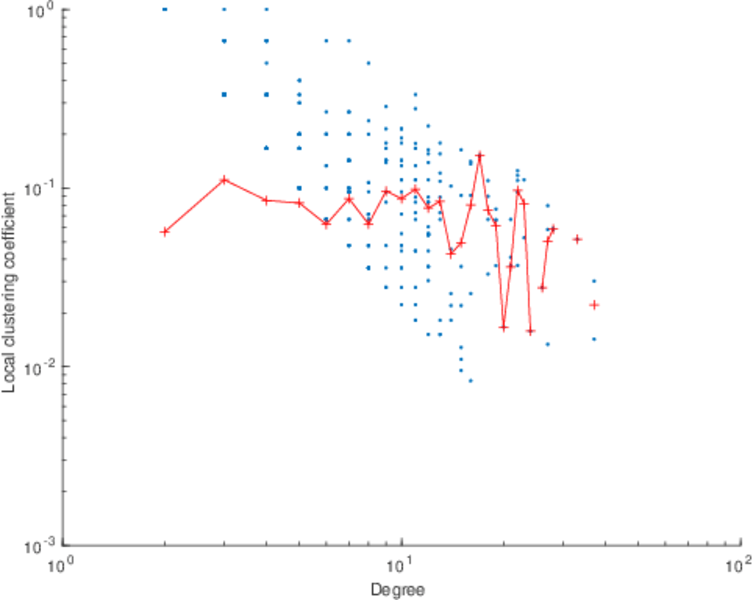
| Maximum degree | dmax = | 37
|
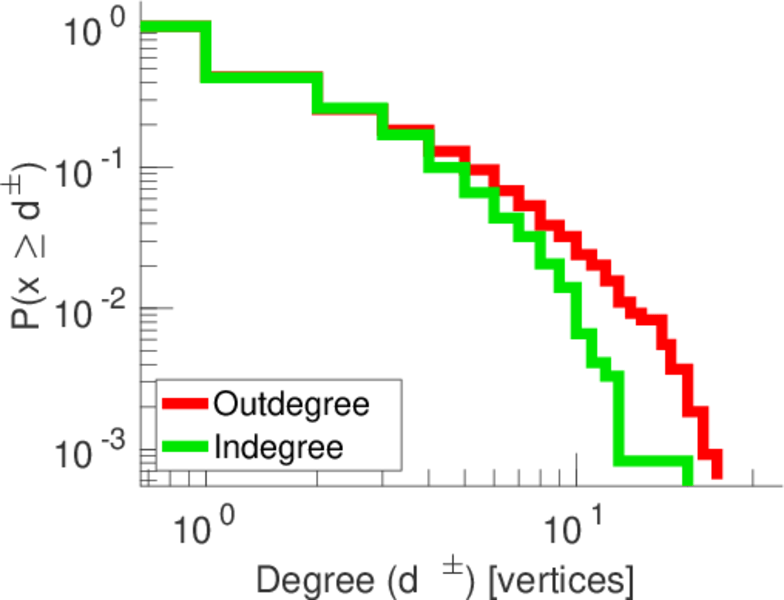
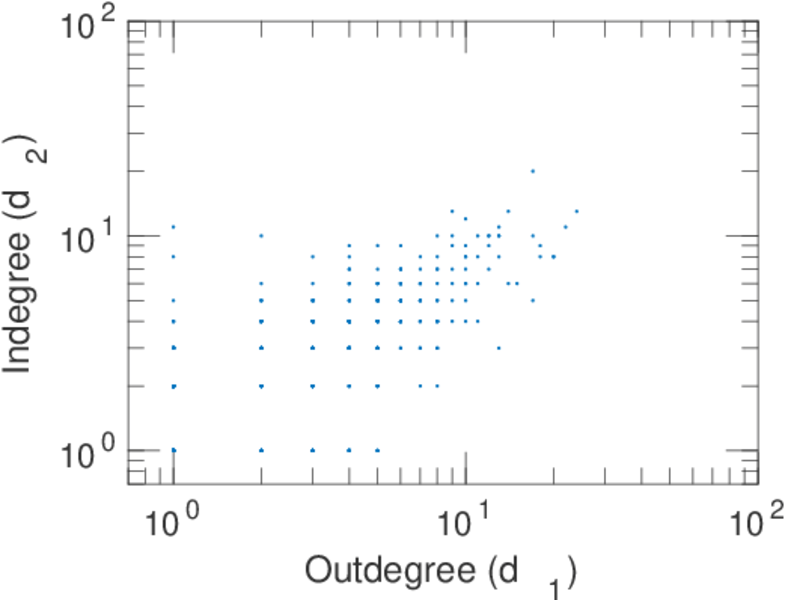
| Maximum outdegree | d+max = | 24
|
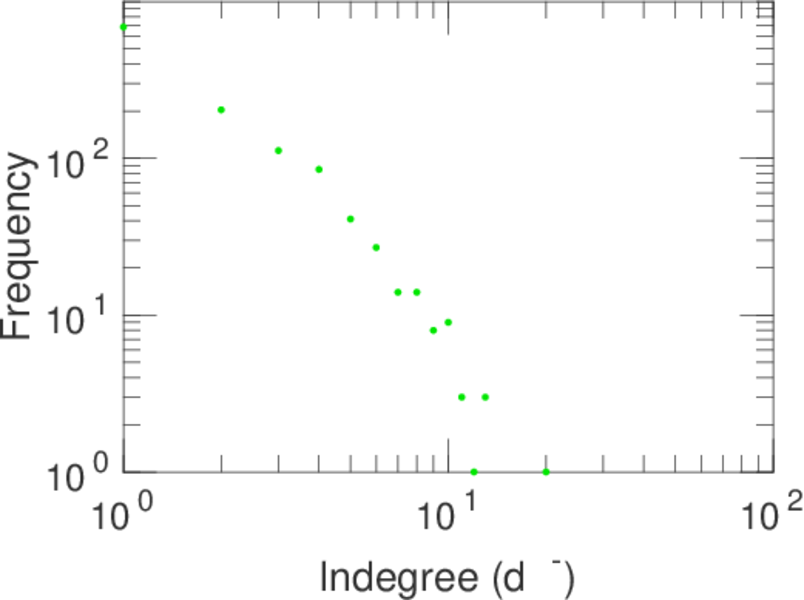
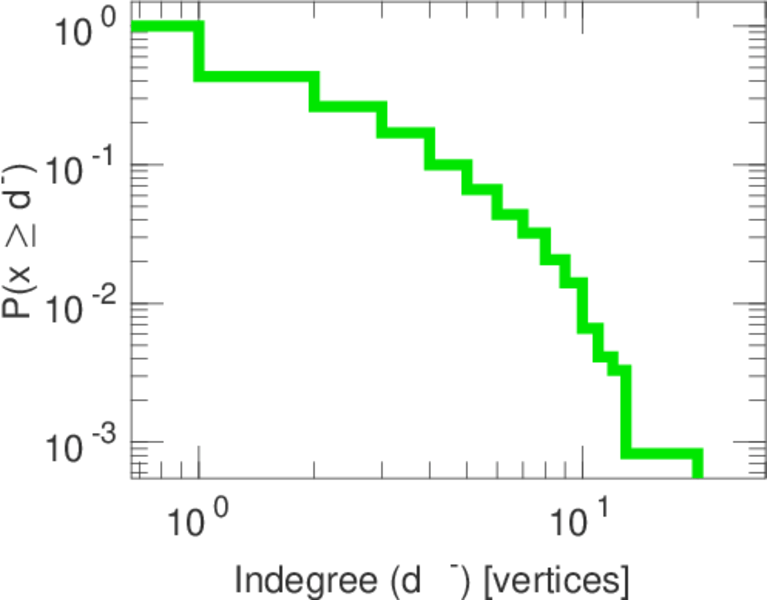
| Maximum indegree | d−max = | 20
|
| Average degree | d = | 4.265 91
|
| Fill | p = | 0.001 739 77
|
| Size of LCC | N = | 1,226
|
| Size of LSCC | Ns = | 792
|
| Relative size of LSCC | Nrs = | 0.646 003
|
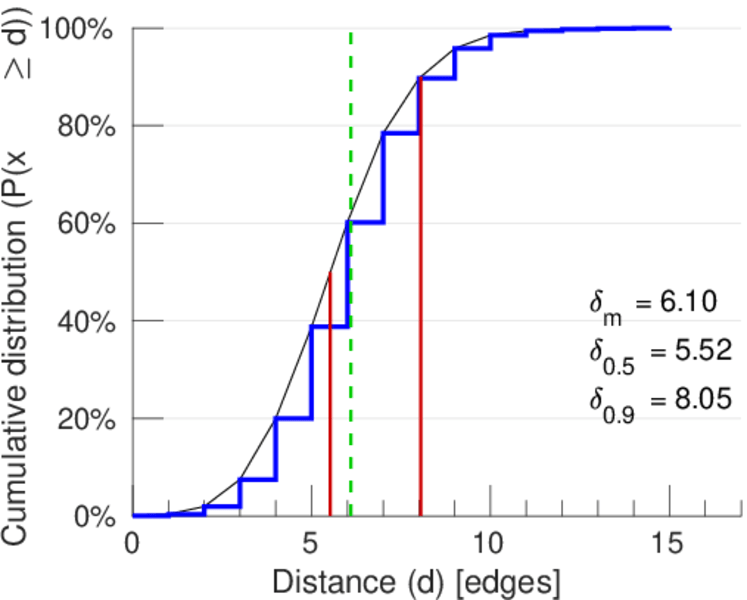
| Diameter | δ = | 17
|
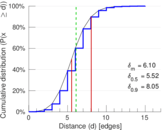
| 50-Percentile effective diameter | δ0.5 = | 5.524 77
|
| 90-Percentile effective diameter | δ0.9 = | 8.054 20
|
| Median distance | δM = | 6
|
| Mean distance | δm = | 6.097 86
|
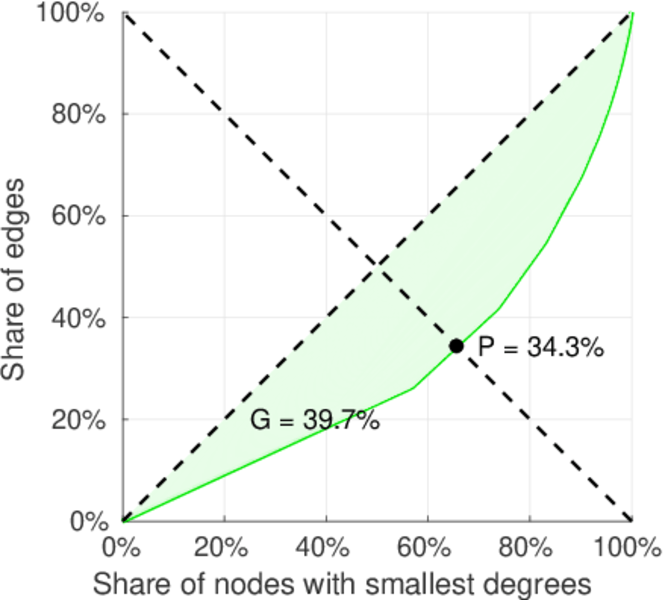
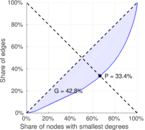
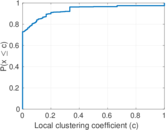
| Gini coefficient | G = | 0.428 460
|
| Balanced inequality ratio | P = | 0.334 417
|
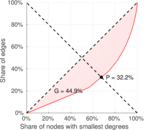
| Outdegree balanced inequality ratio | P+ = | 0.321 989
|
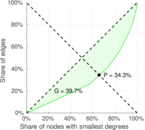
| Indegree balanced inequality ratio | P− = | 0.342 639
|
| Relative edge distribution entropy | Her = | 0.951 408
|
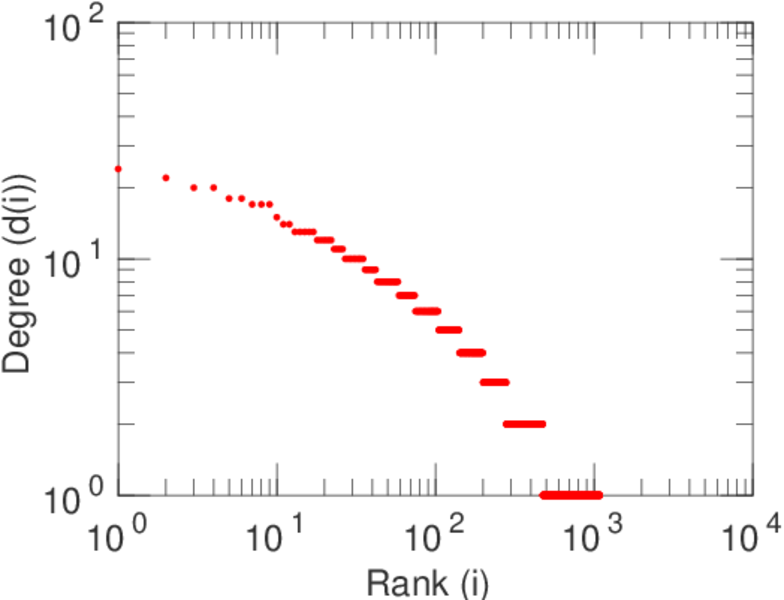
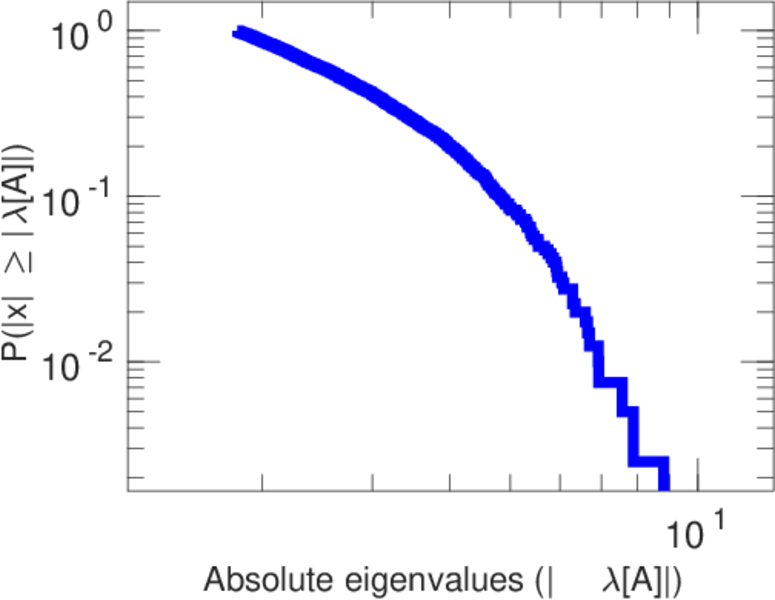
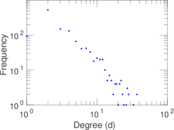
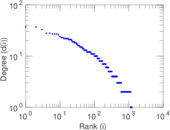
| Power law exponent | γ = | 1.905 32
|
| Tail power law exponent | γt = | 3.701 00
|
| Tail power law exponent with p | γ3 = | 3.701 00
|
| p-value | p = | 0.185 000
|
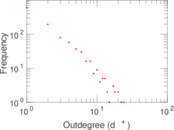
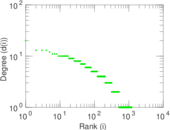
| Outdegree tail power law exponent with p | γ3,o = | 2.031 00
|
| Outdegree p-value | po = | 0.000 00
|
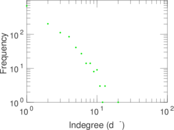
| Indegree tail power law exponent with p | γ3,i = | 3.411 00
|
| Indegree p-value | pi = | 0.029 000 0
|
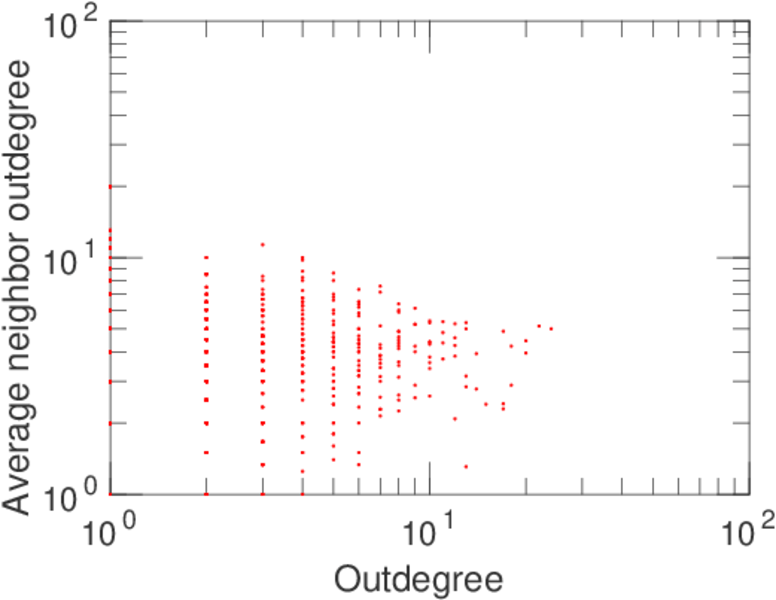
| Degree assortativity | ρ = | −0.015 202 8
|
| Degree assortativity p-value | pρ = | 0.291 508
|
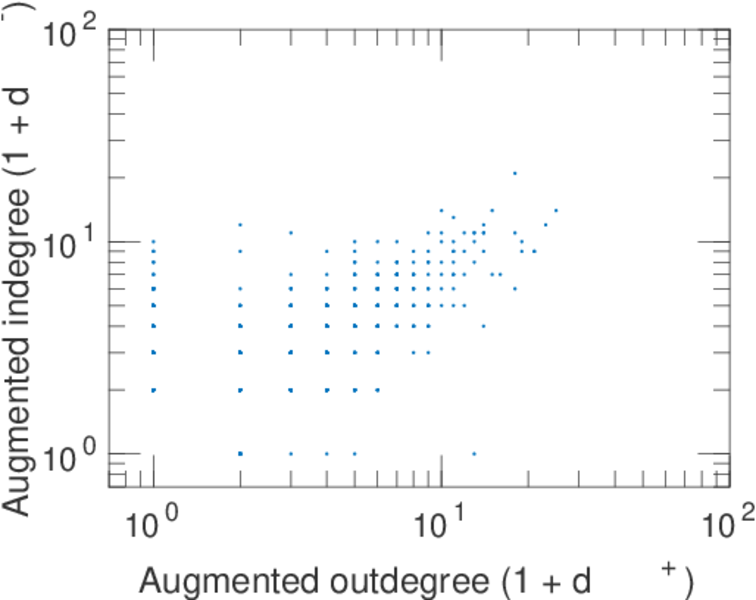
| In/outdegree correlation | ρ± = | +0.595 248
|
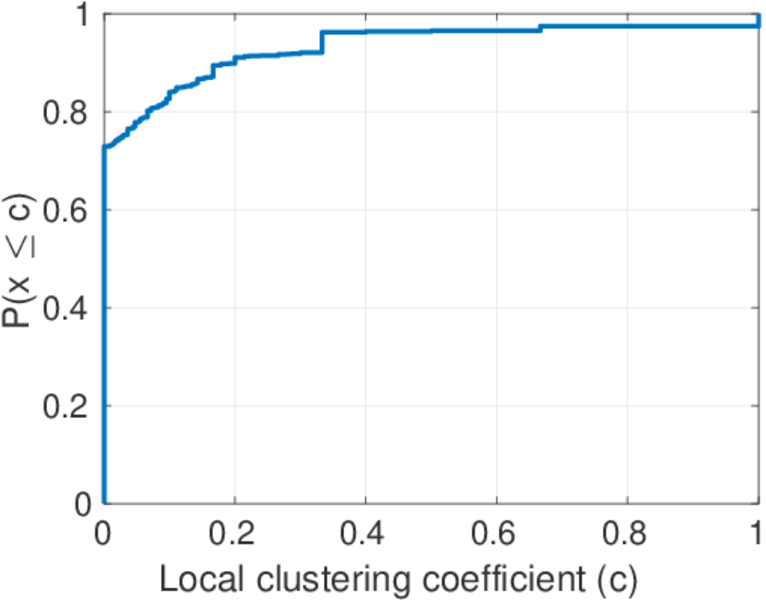
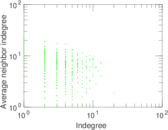
| Clustering coefficient | c = | 0.063 892 3
|
| Directed clustering coefficient | c± = | 0.049 203 8
|
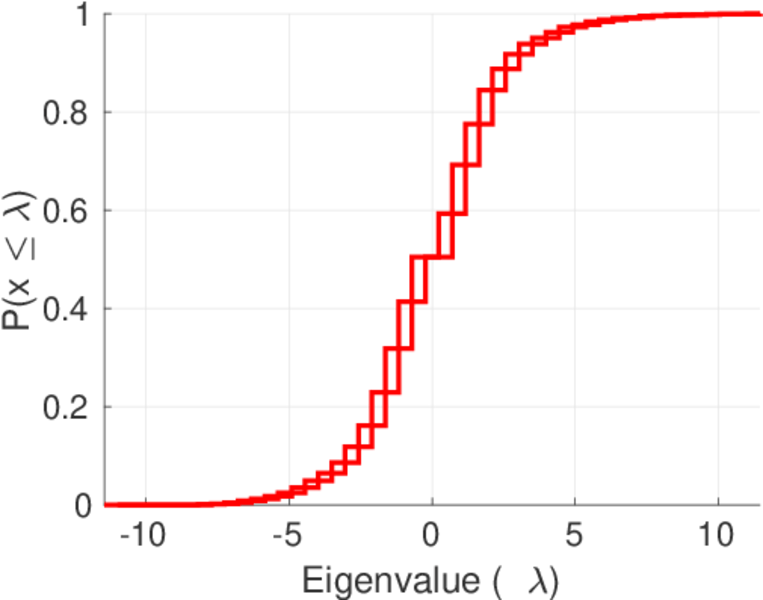
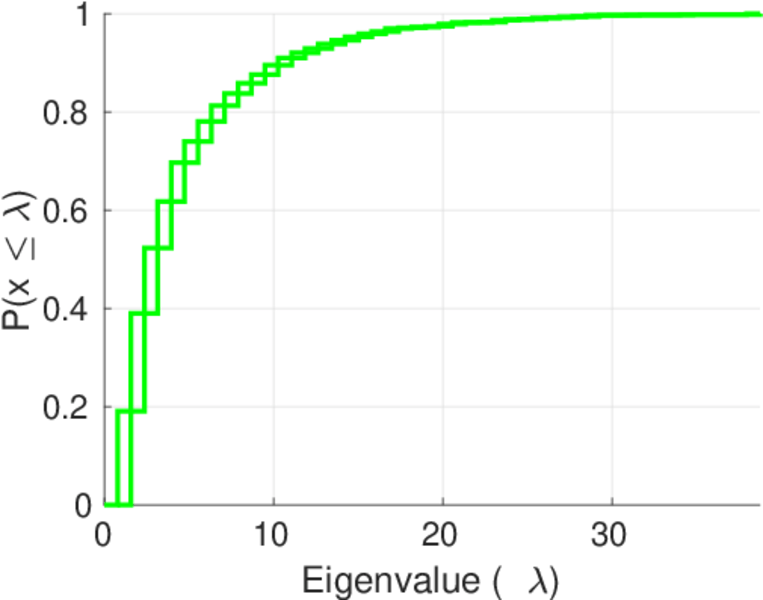
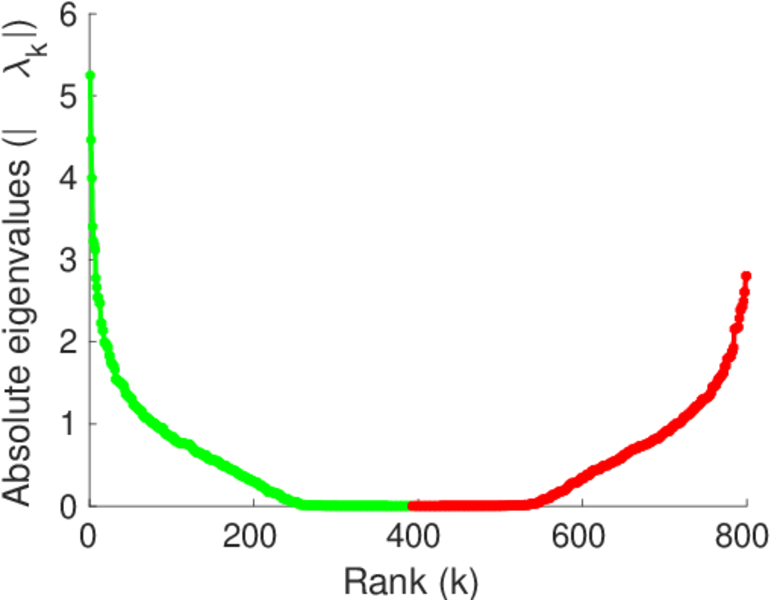
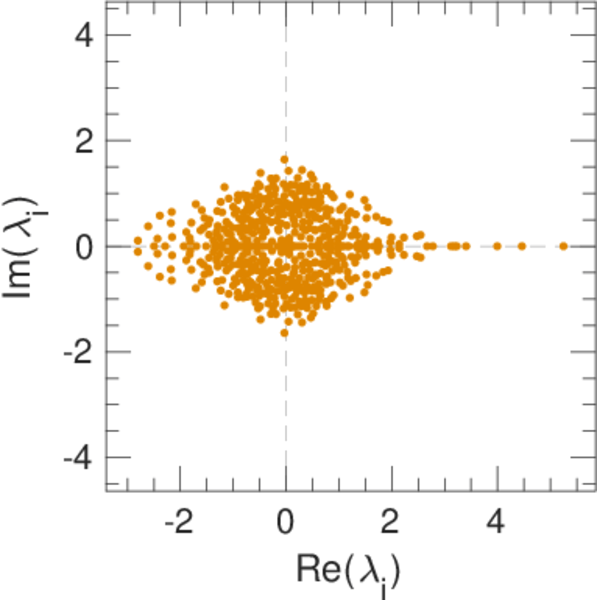
| Spectral norm | α = | 11.454 8
|
| Operator 2-norm | ν = | 6.411 86
|
| Cyclic eigenvalue | π = | 5.248 33
|
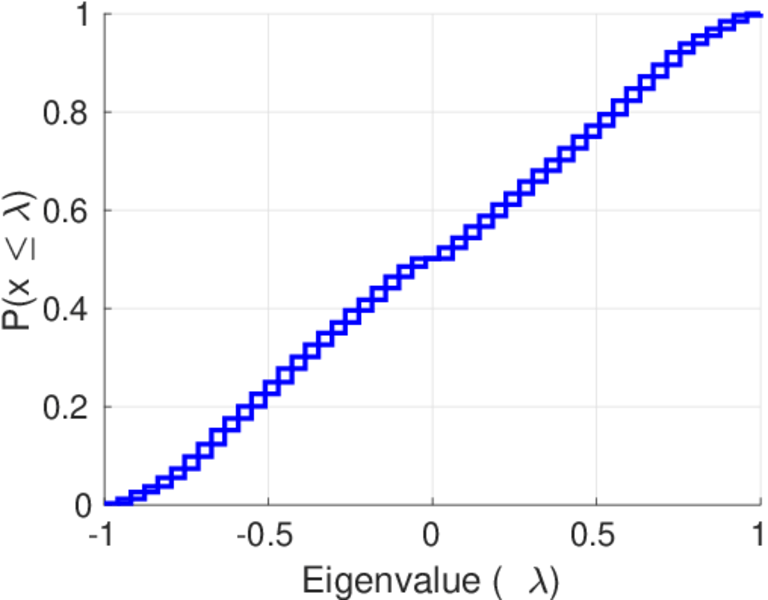
| Algebraic connectivity | a = | 0.025 827 8
|
| Spectral separation | |λ1[A] / λ2[A]| = | 1.149 38
|
| Reciprocity | y = | 0.157 553
|
| Non-bipartivity | bA = | 0.320 044
|
| Normalized non-bipartivity | bN = | 0.013 871 1
|
| Algebraic non-bipartivity | χ = | 0.025 807 5
|
| Spectral bipartite frustration | bK = | 0.001 641 08
|
| Controllability | C = | 364
|
| Relative controllability | Cr = | 0.296 900
|
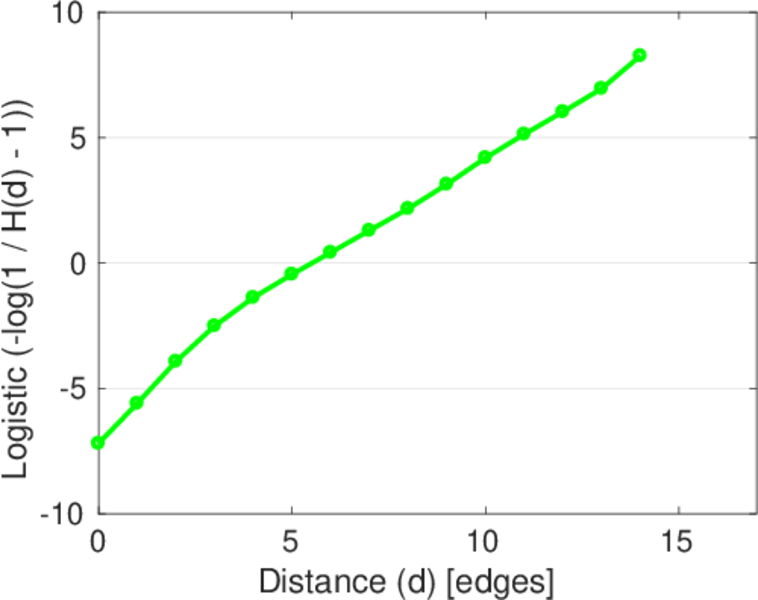
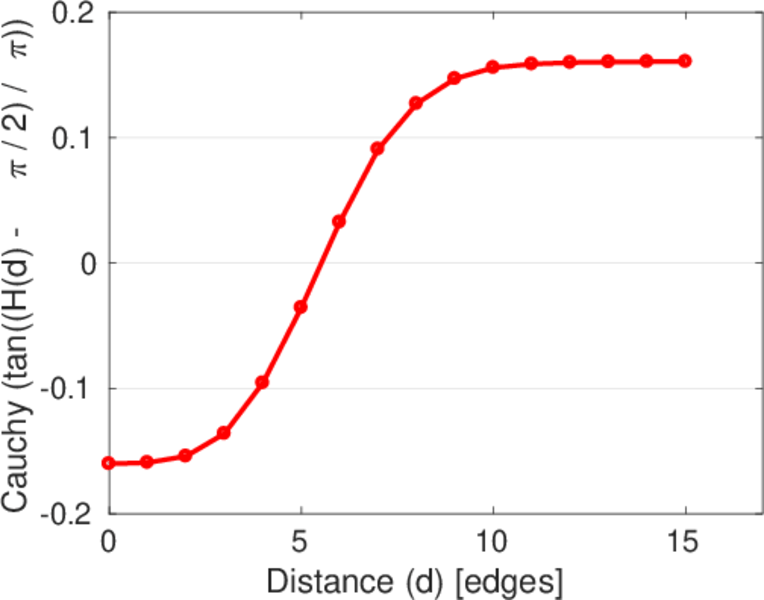
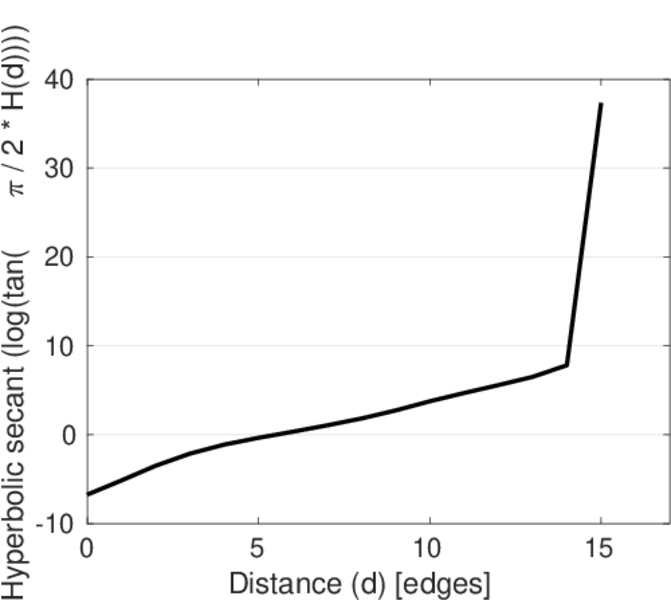
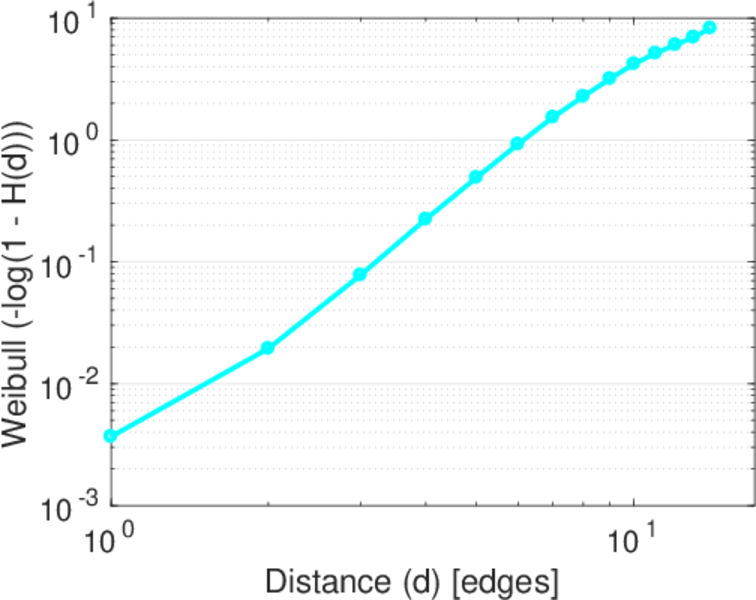
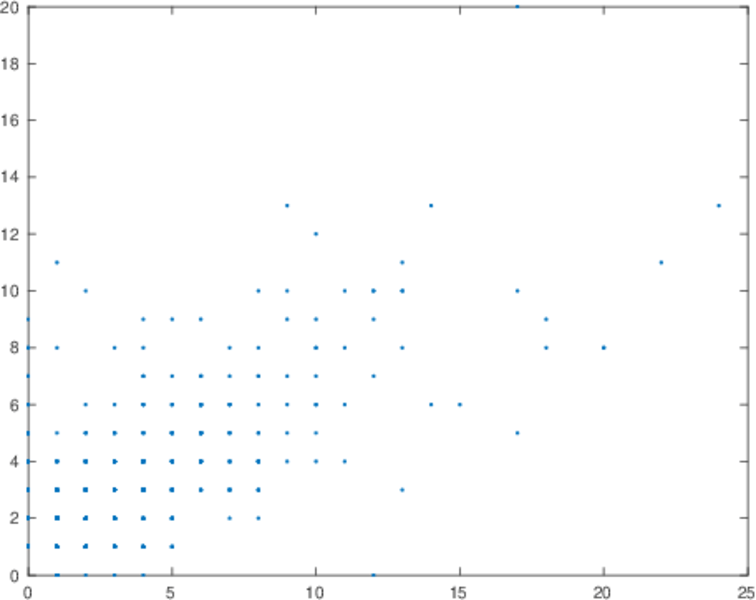
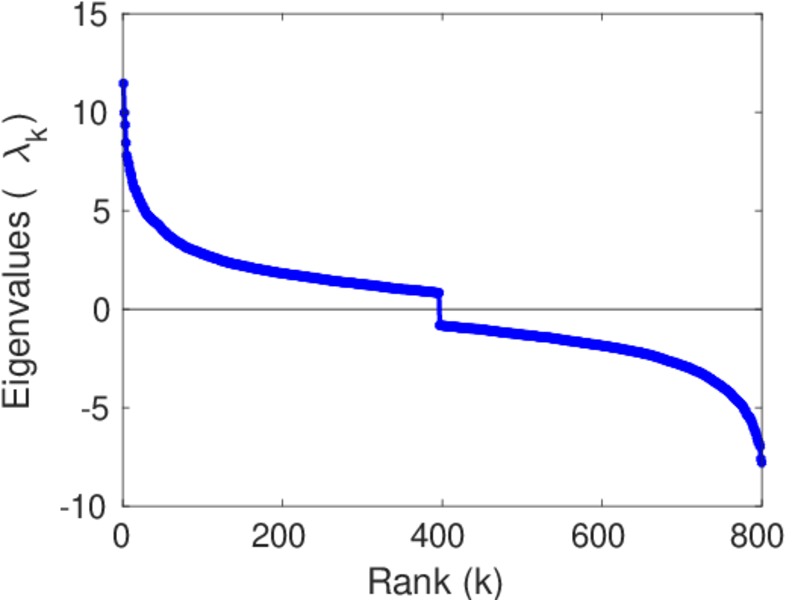
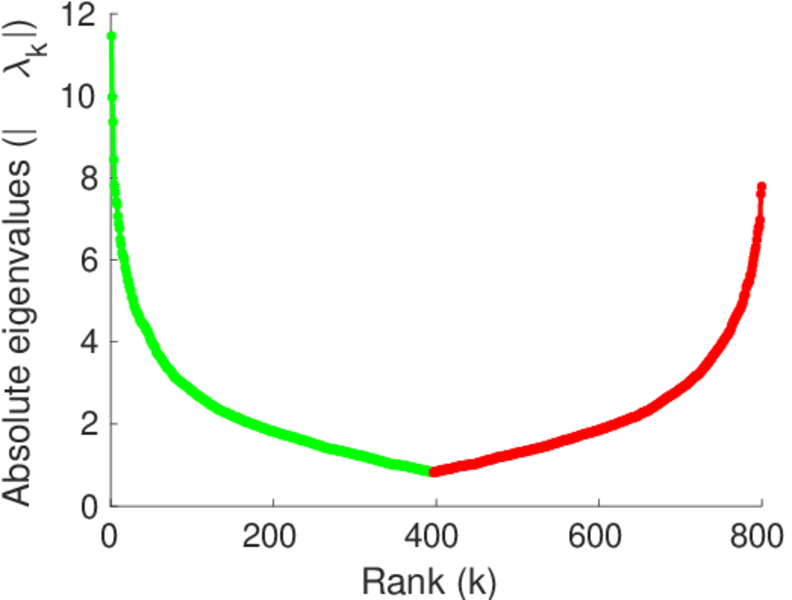
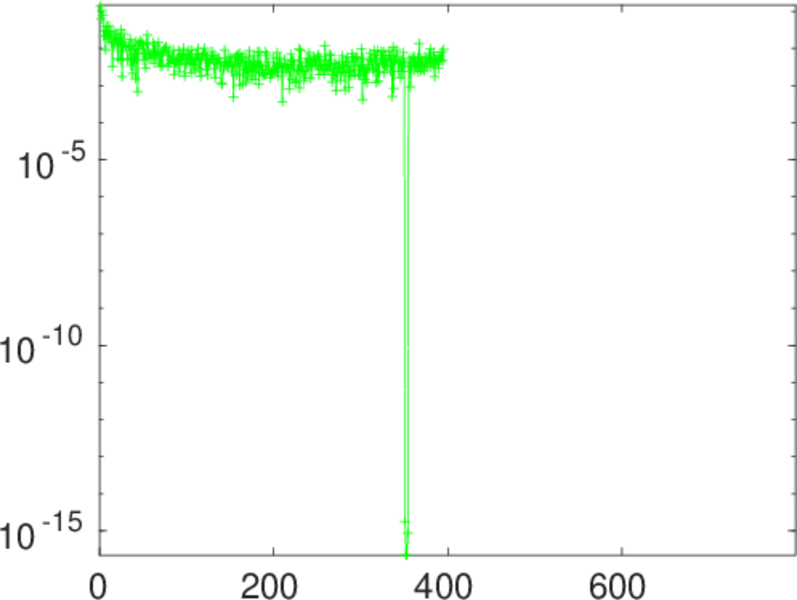
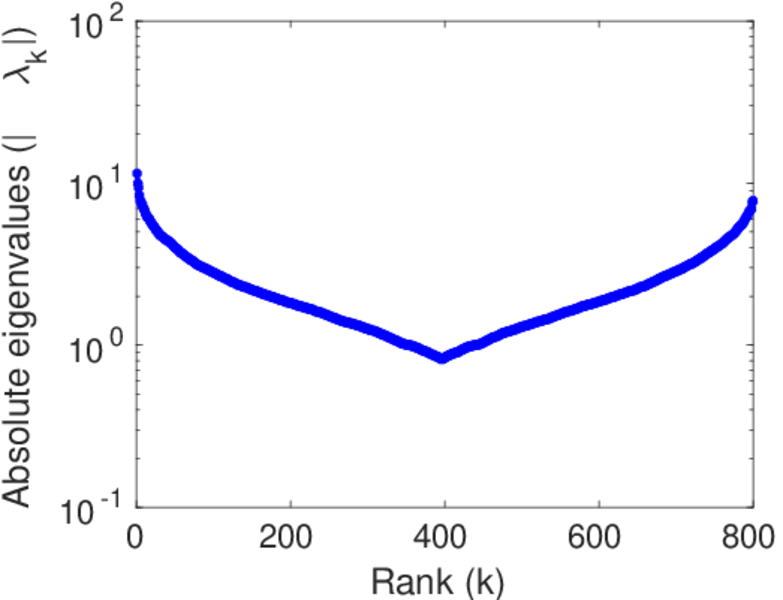
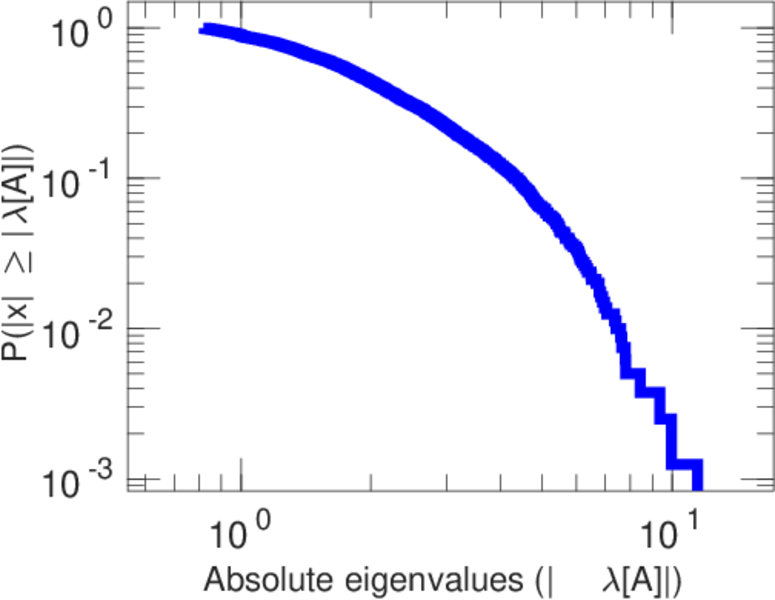
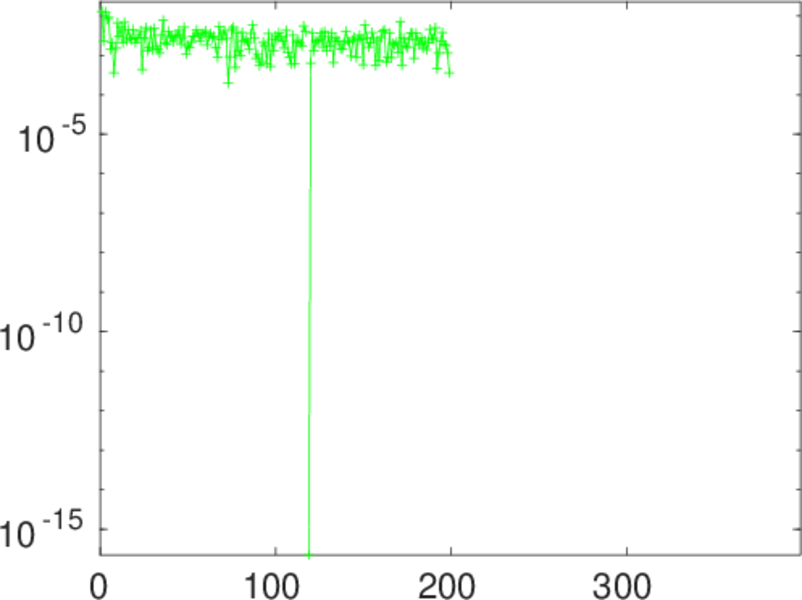
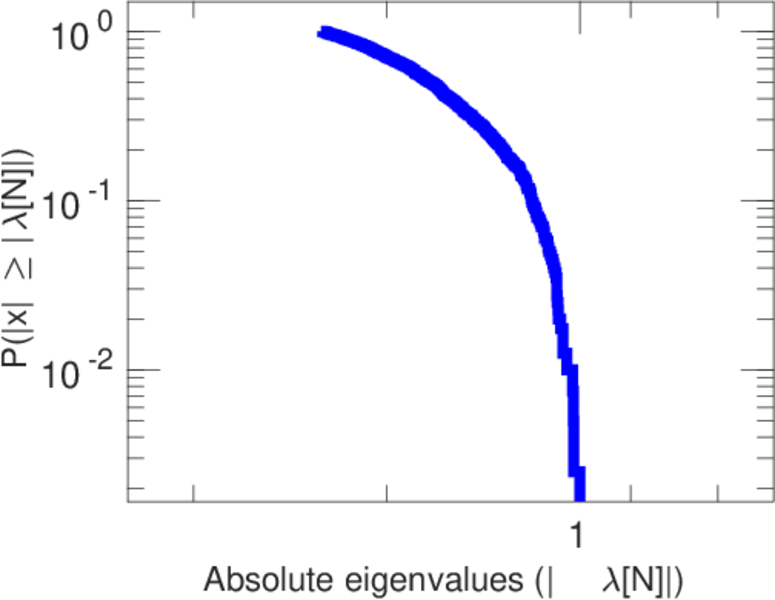
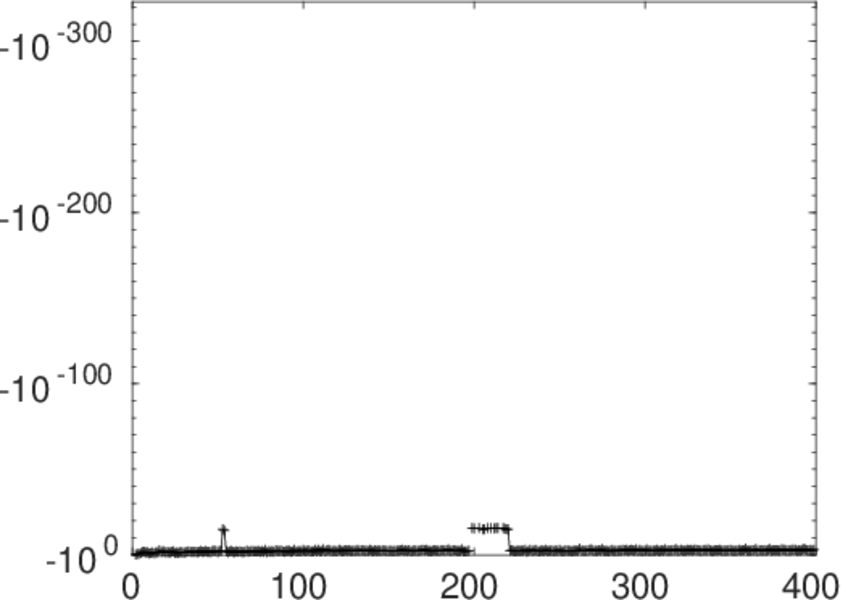
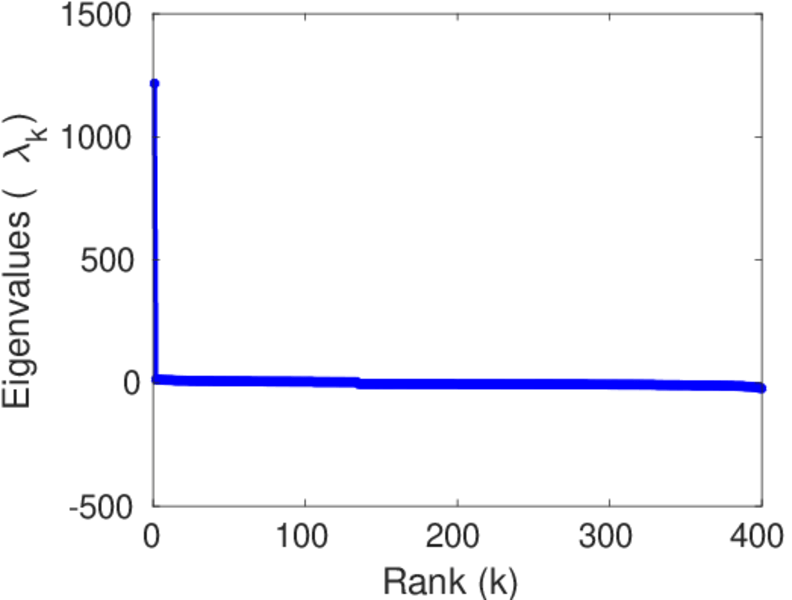
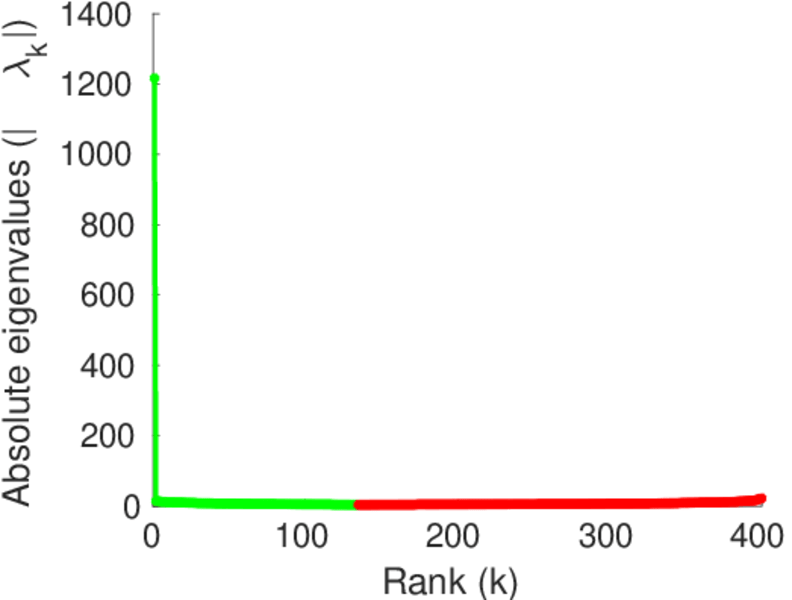
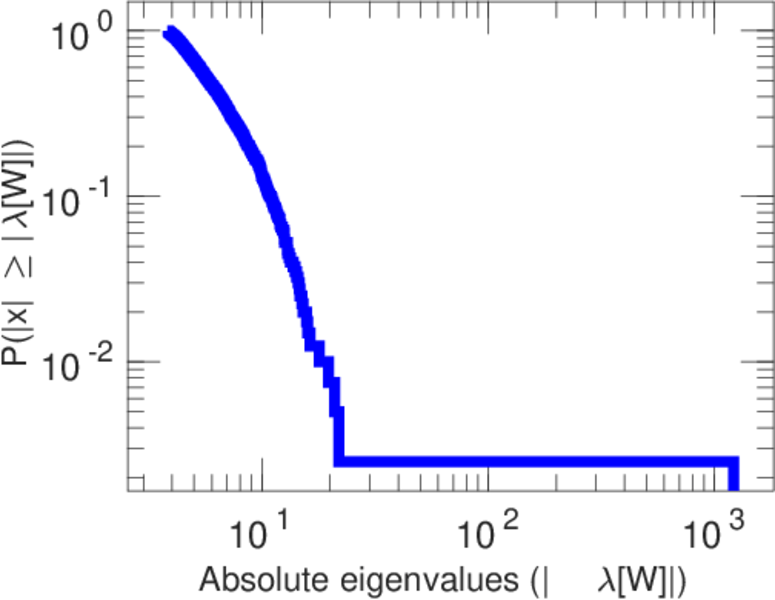
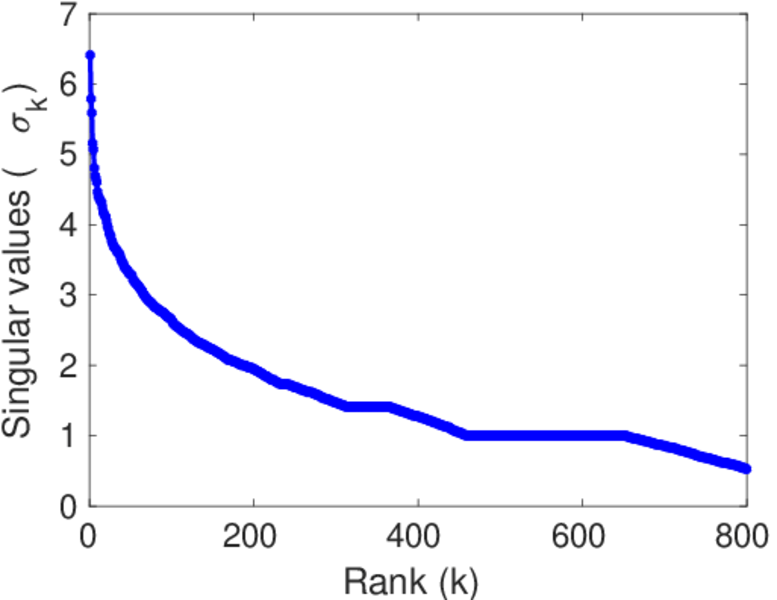
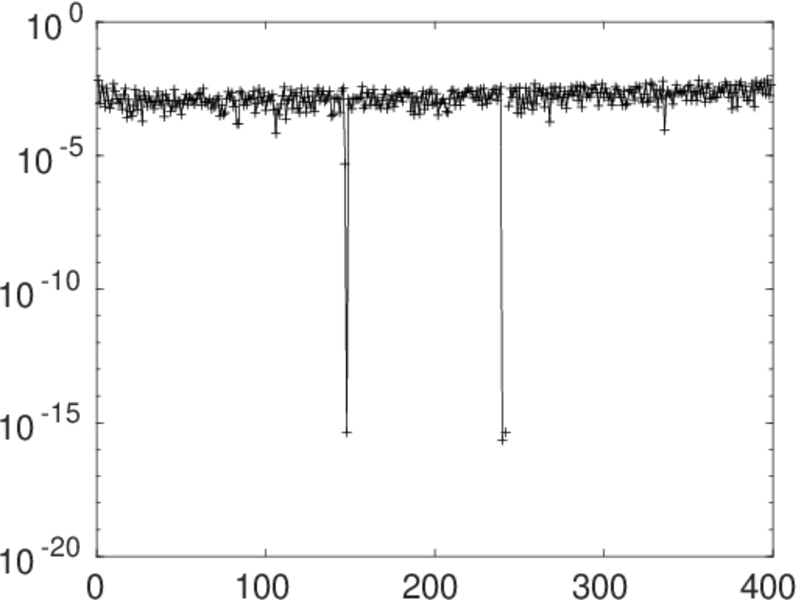
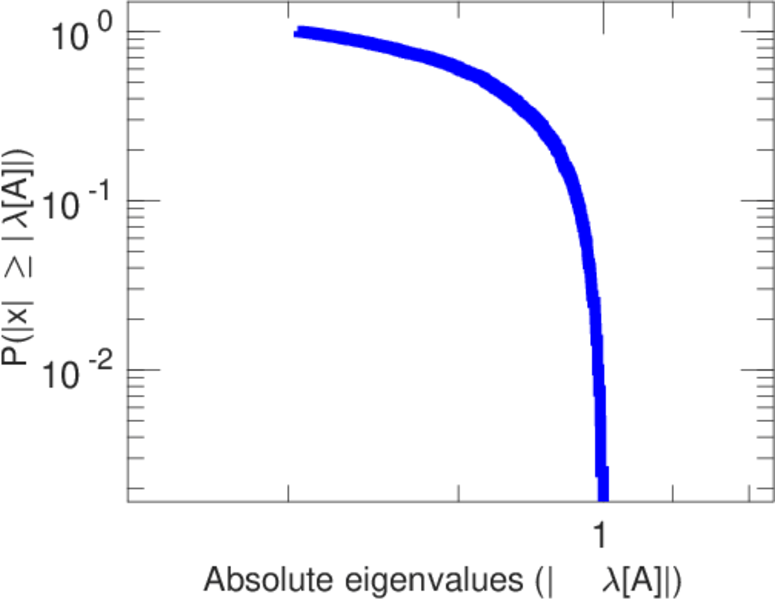
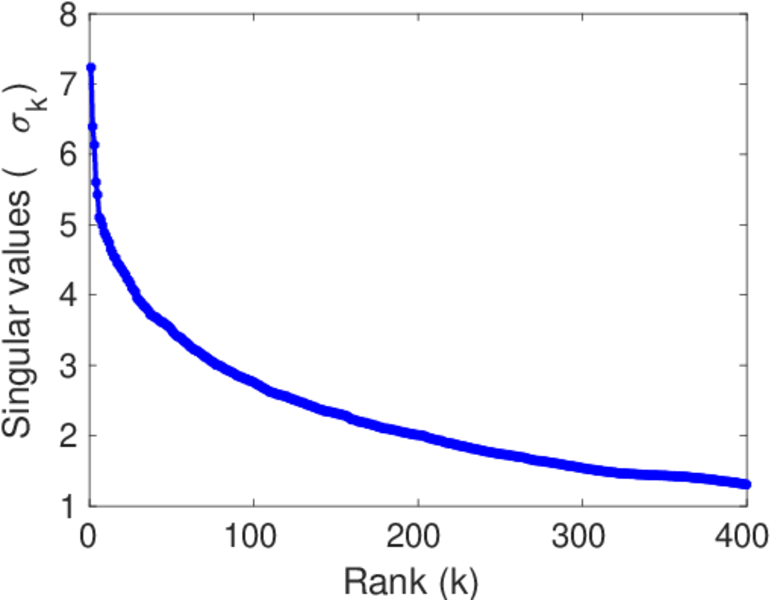
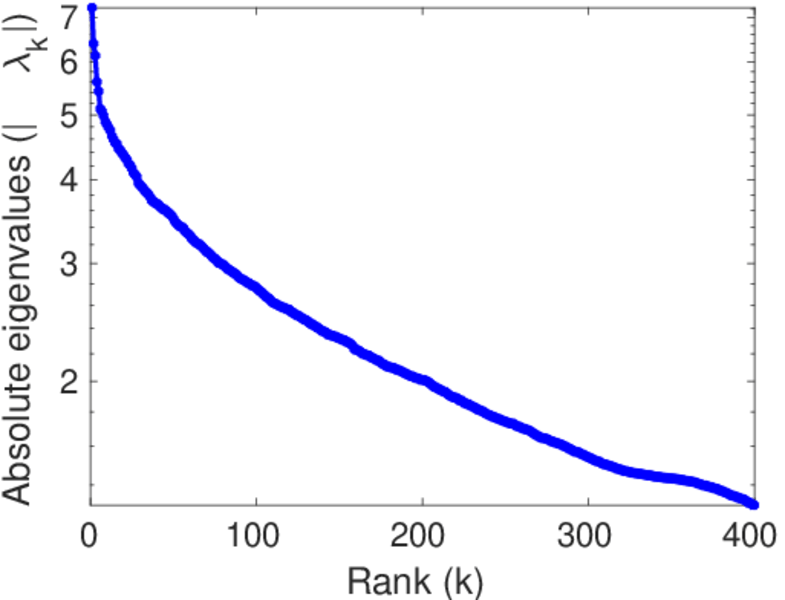
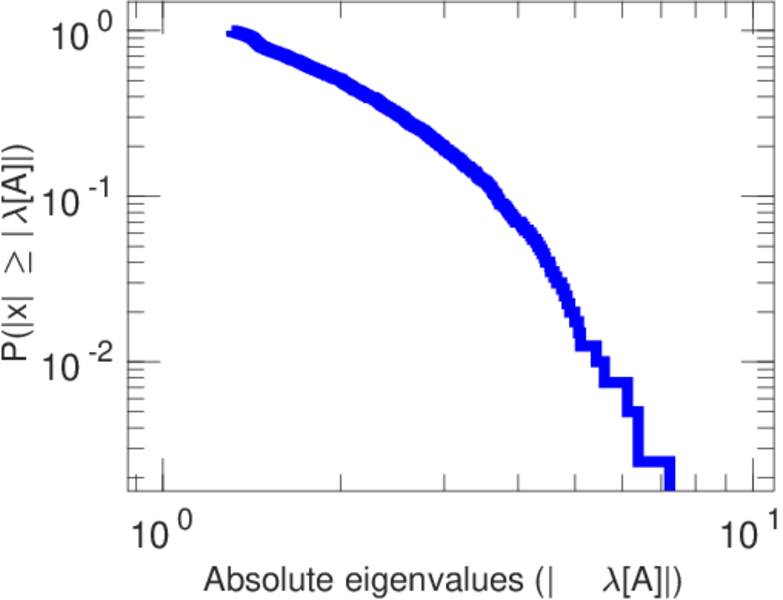
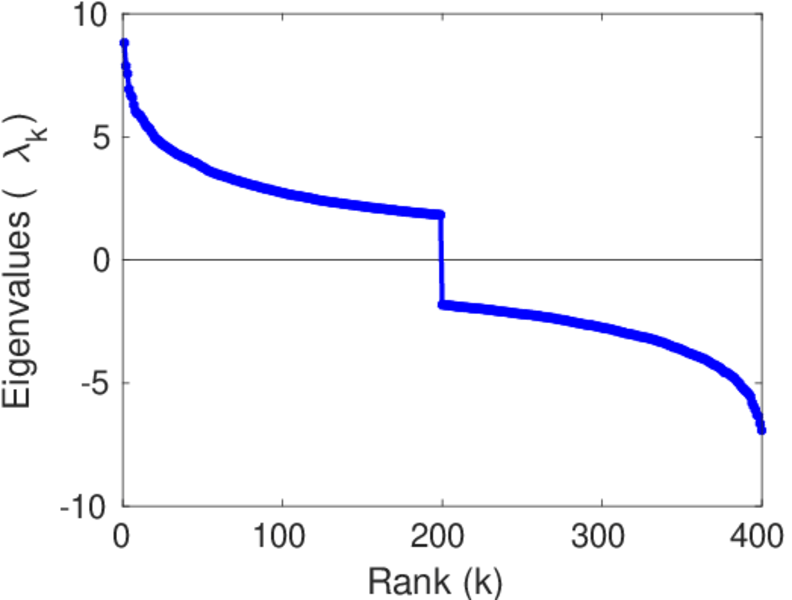
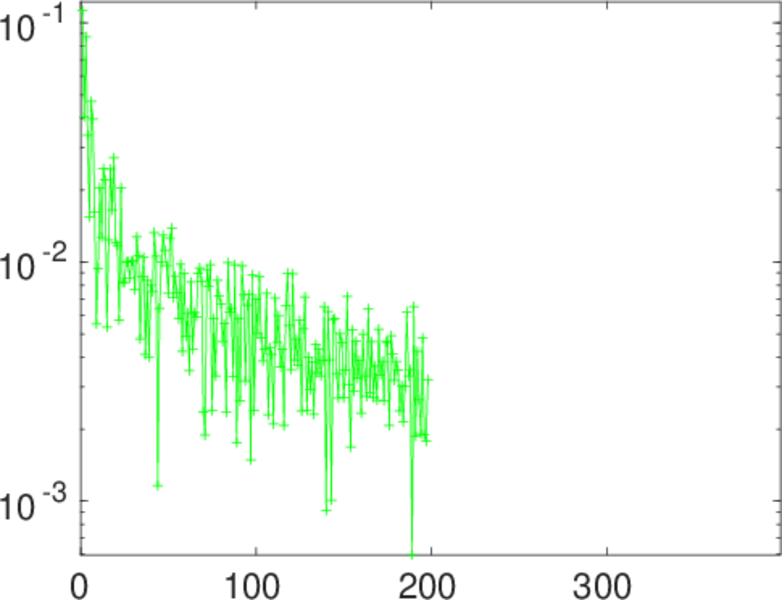
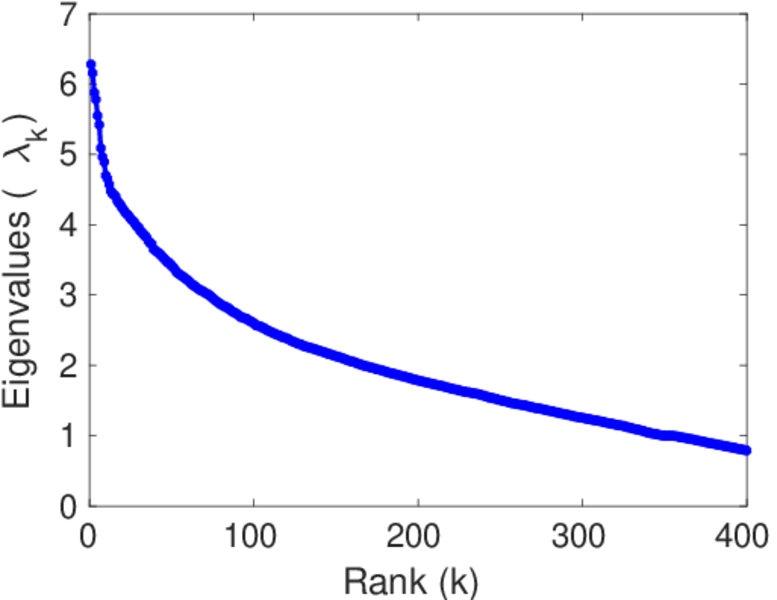
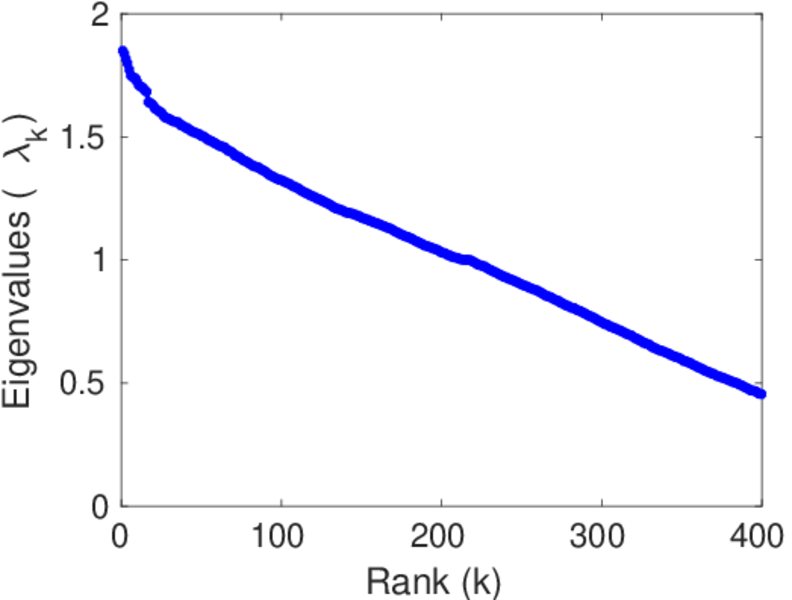
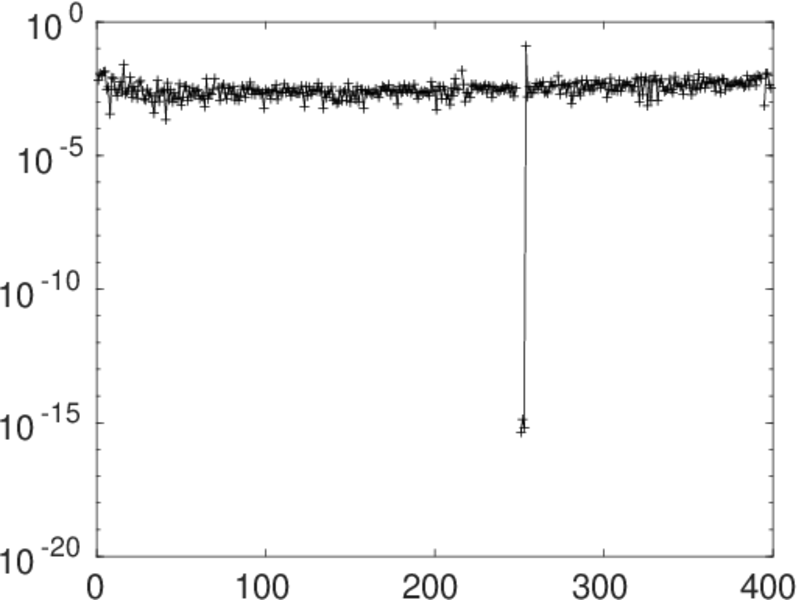
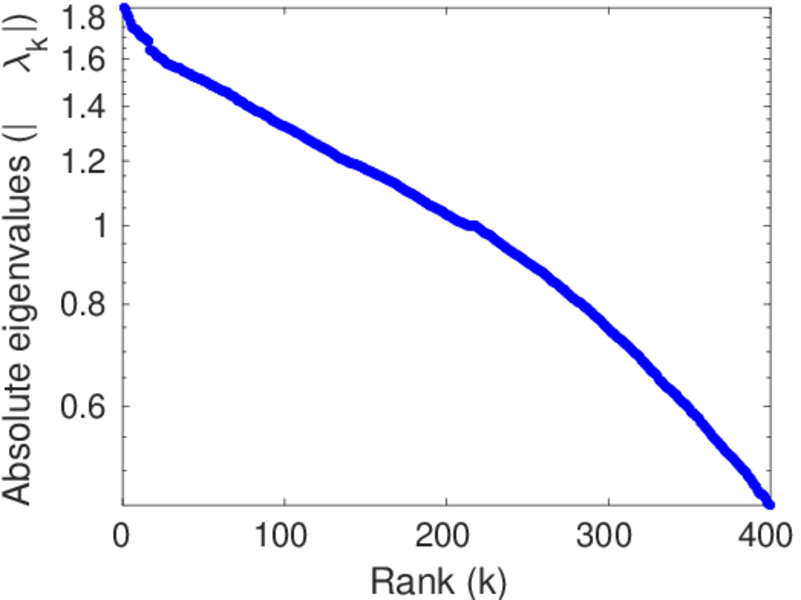
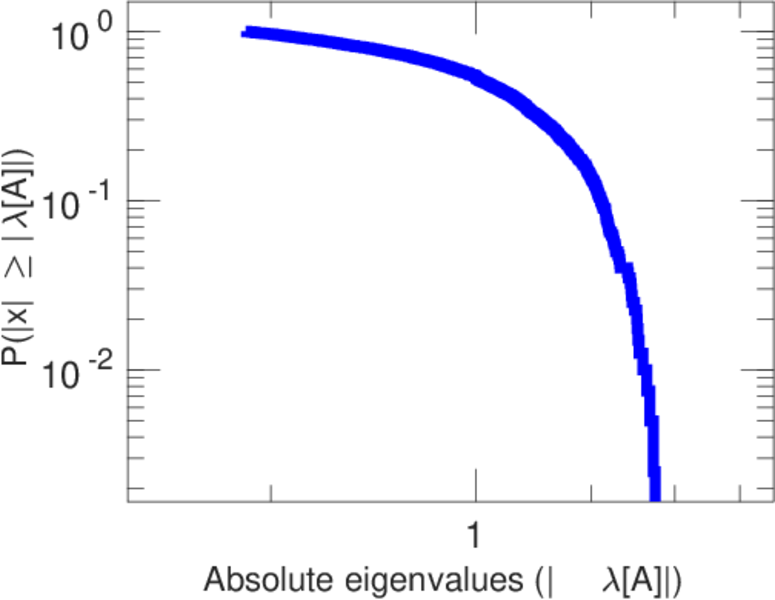
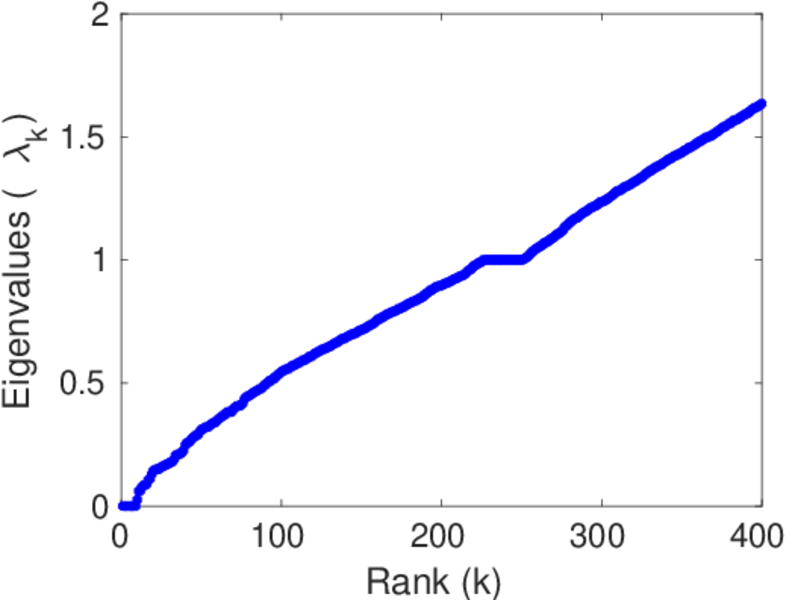
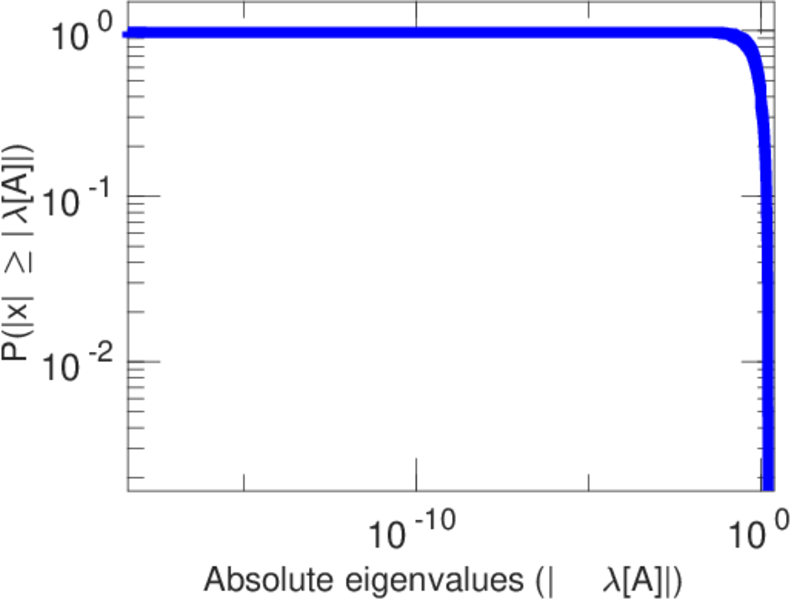
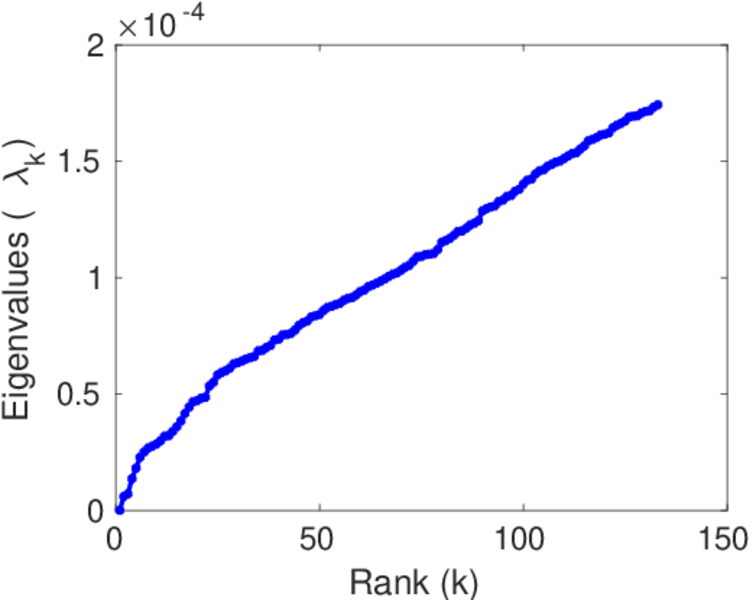
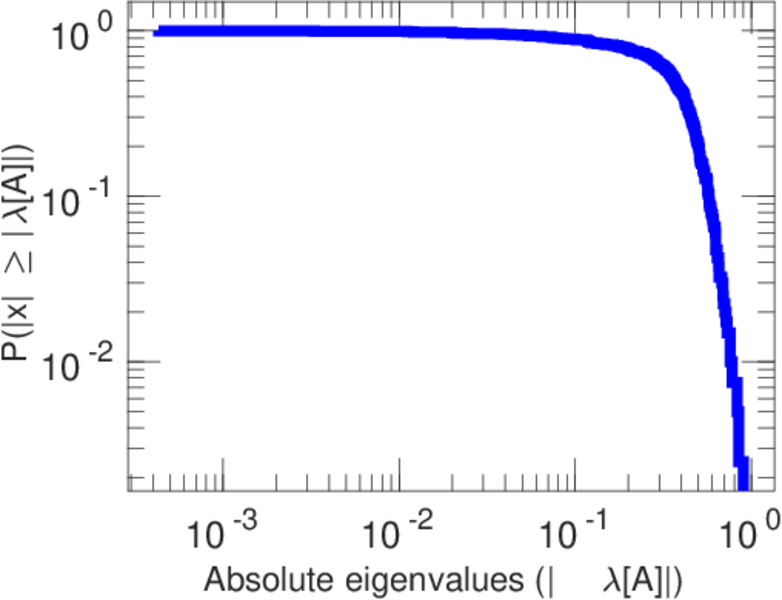
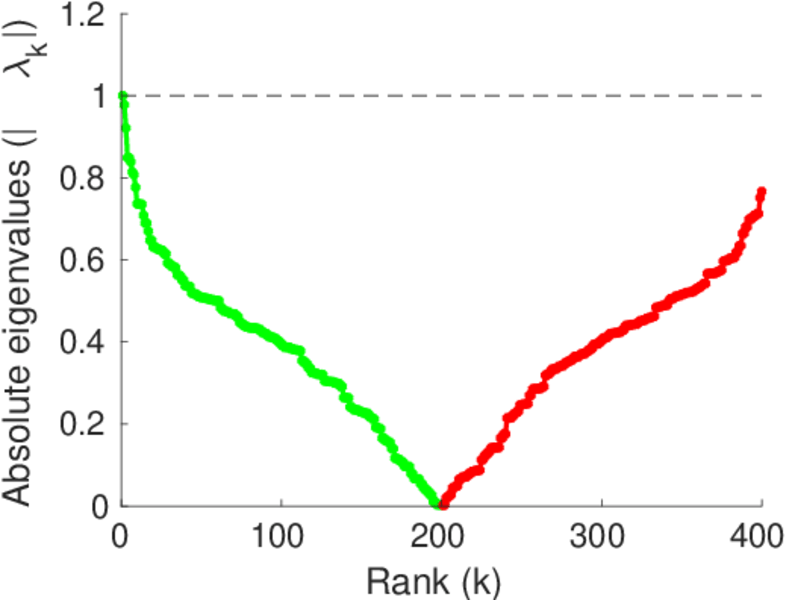
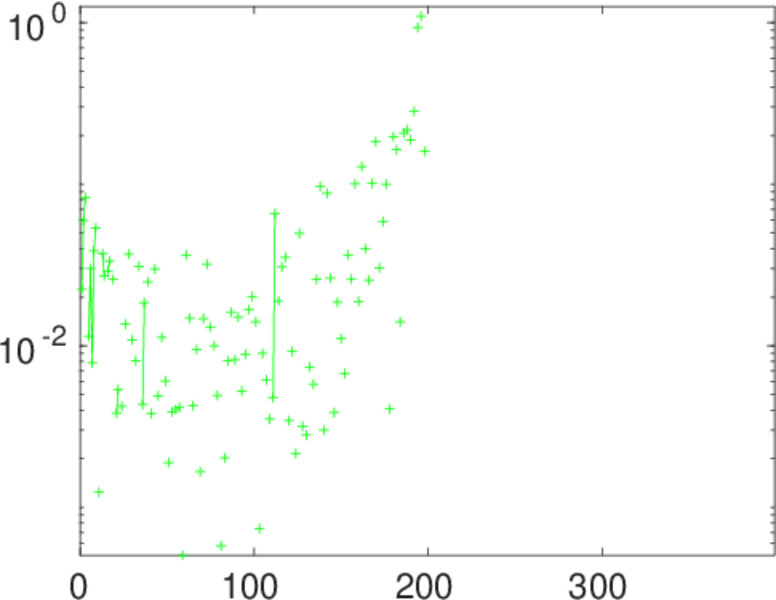
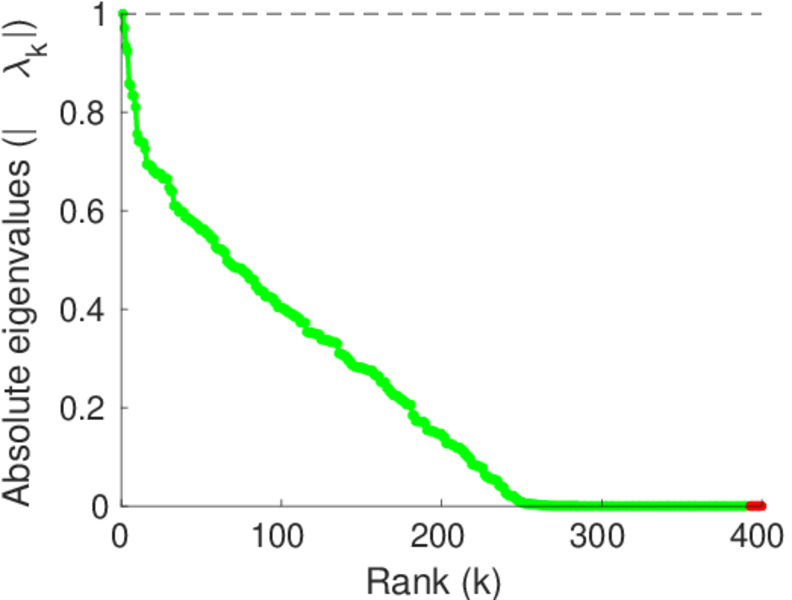
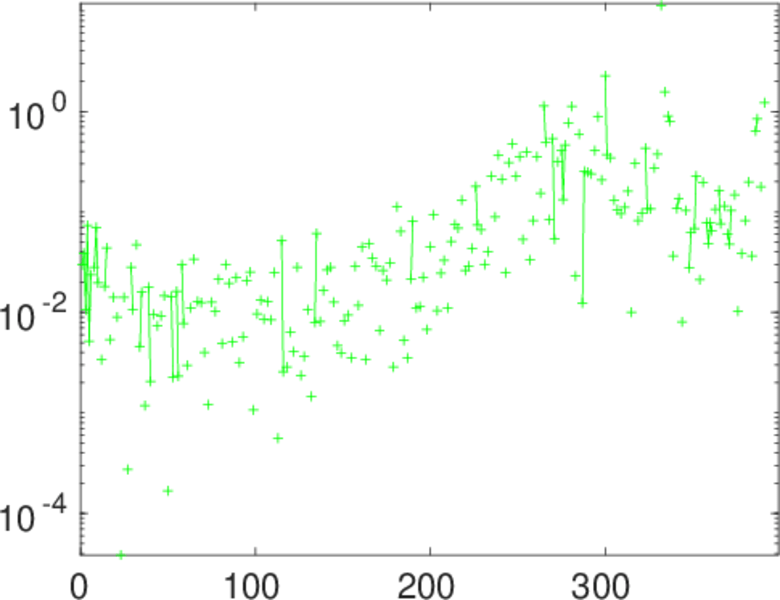
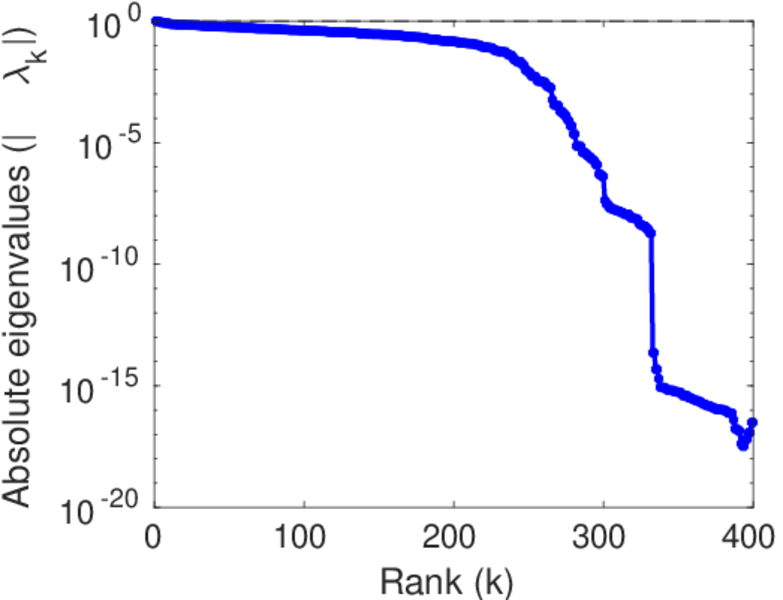
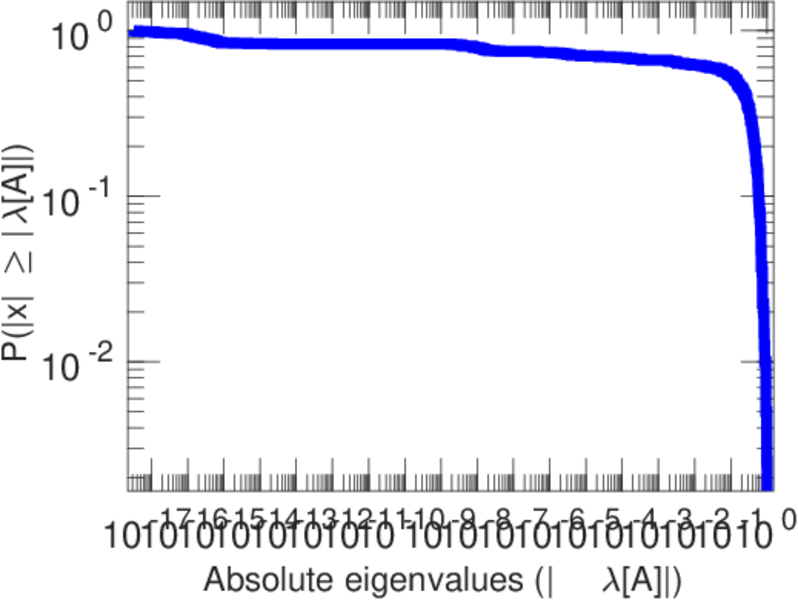
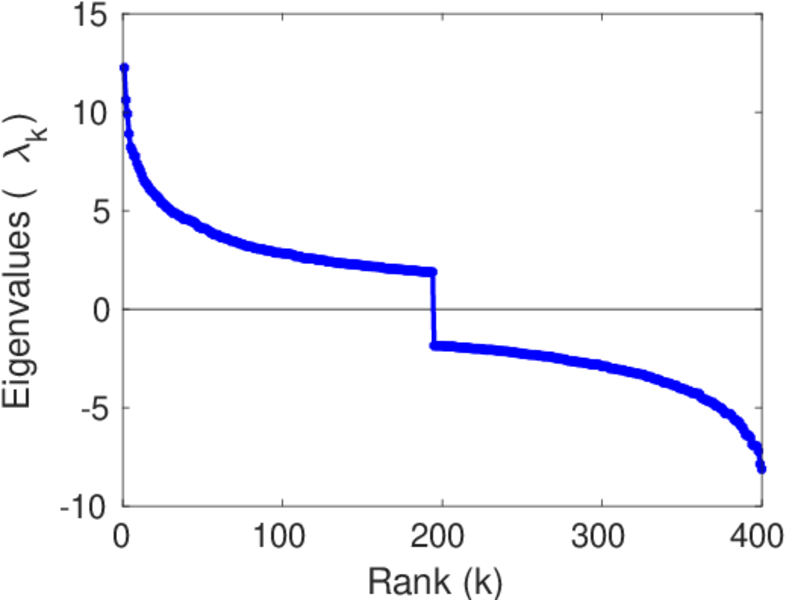
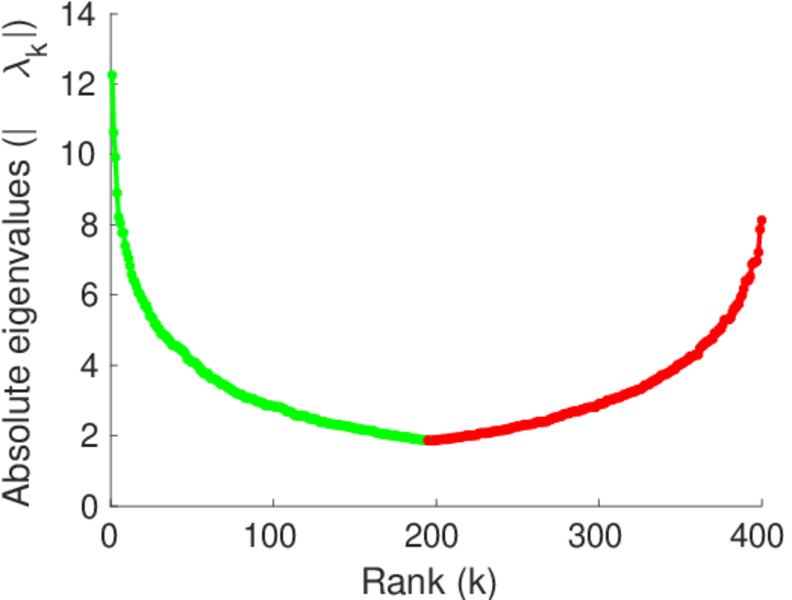
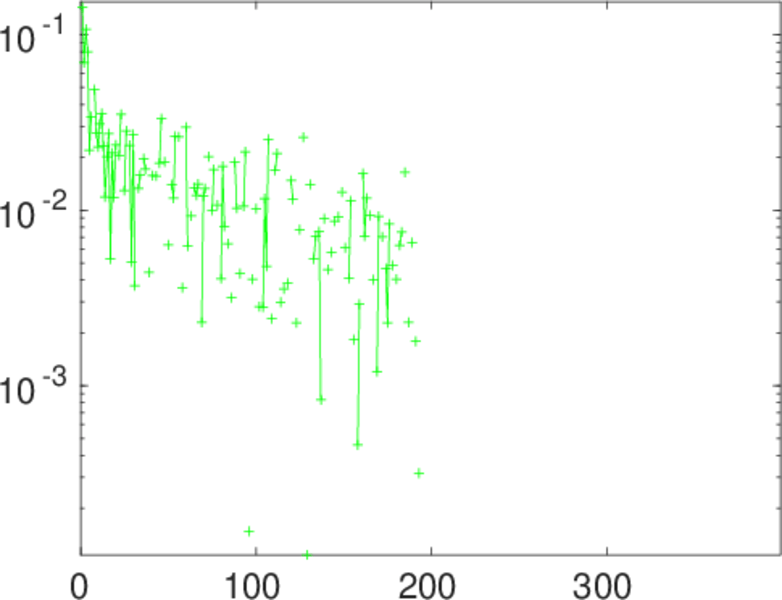
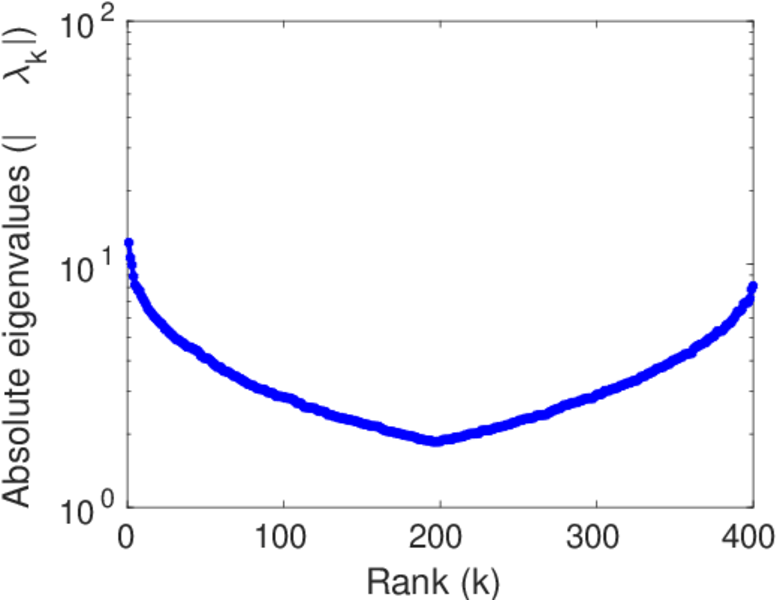
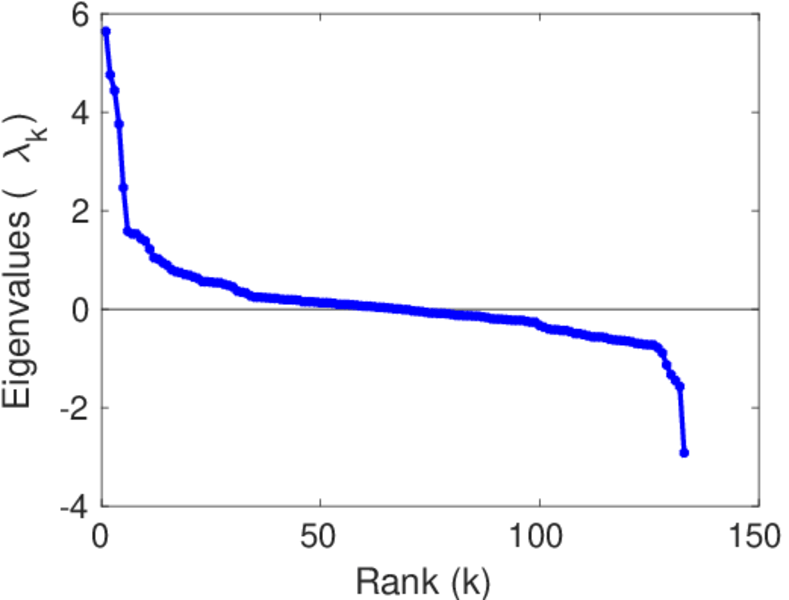
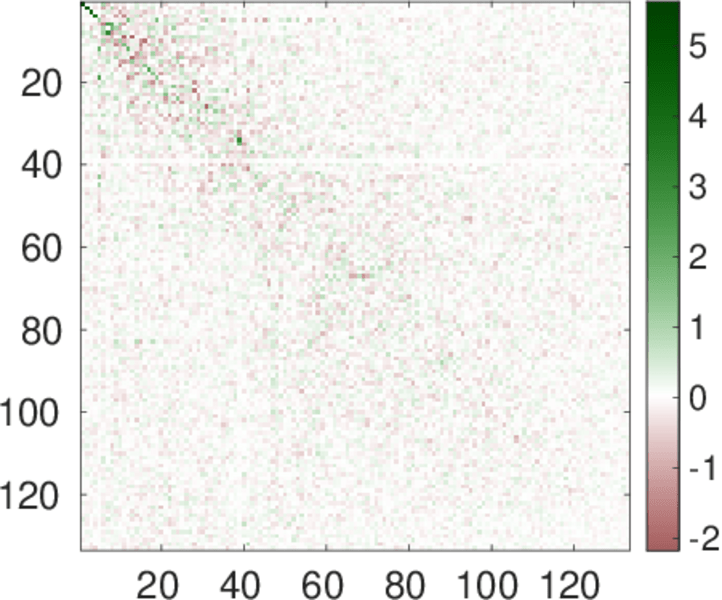
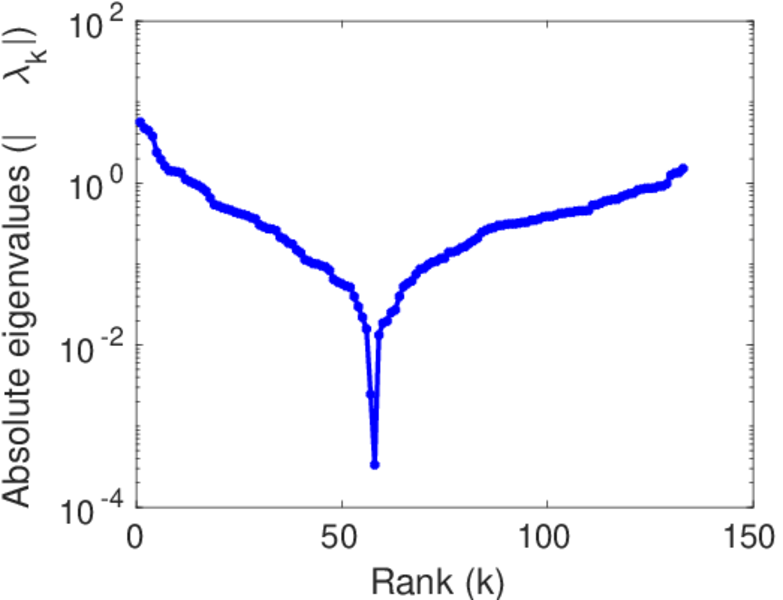
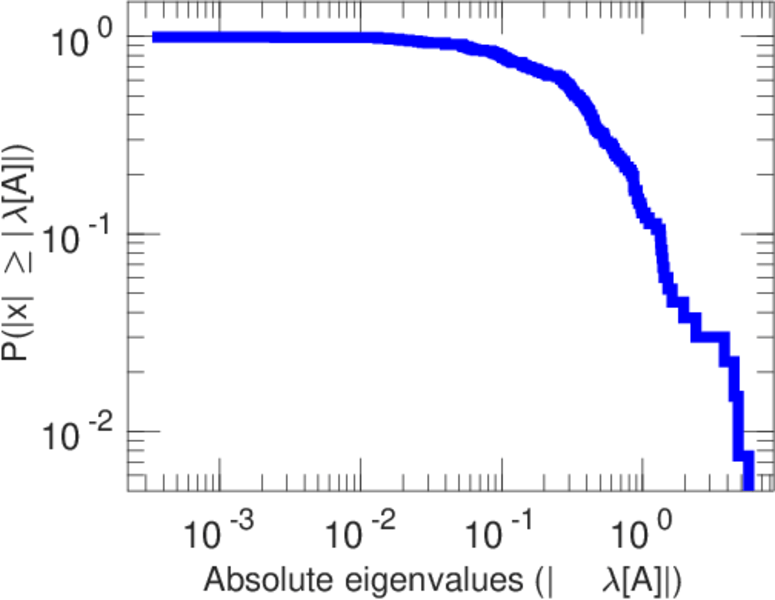
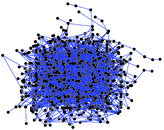
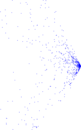
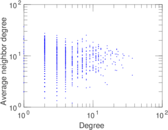
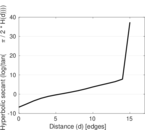
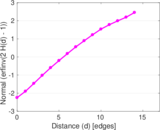
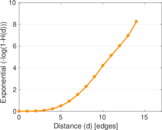
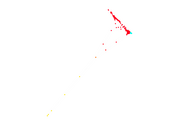
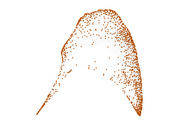
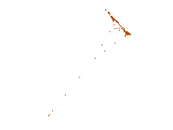
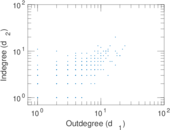
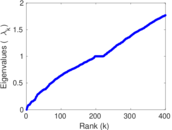
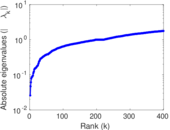
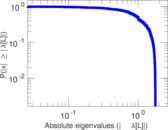
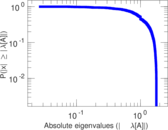
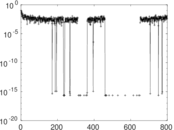
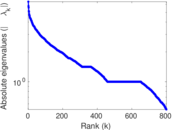
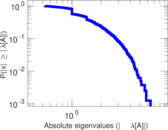
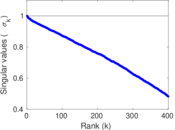
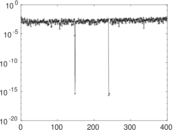
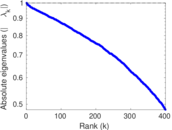
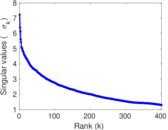
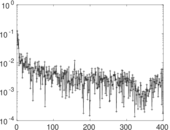
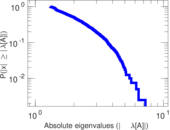
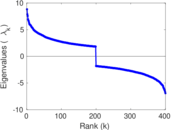
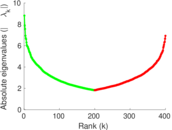
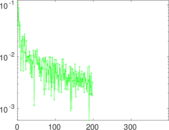
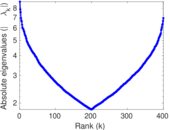
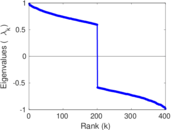
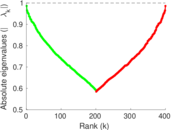
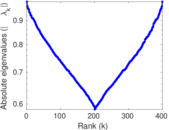
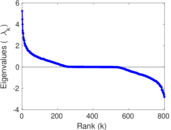
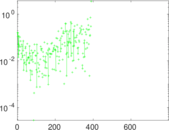
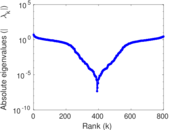
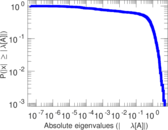
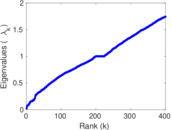
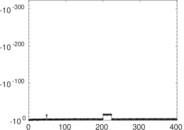
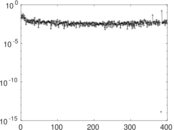
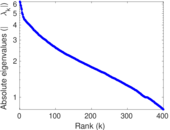
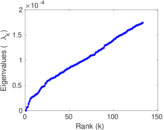
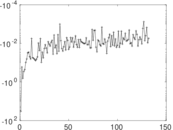
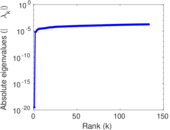
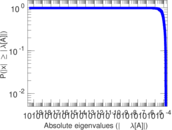
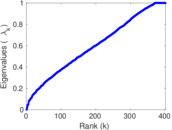
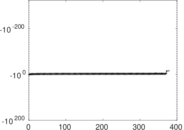
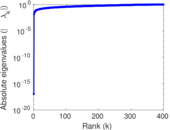
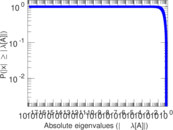
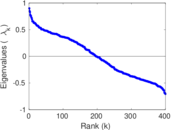
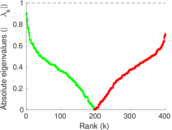
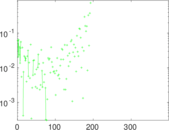
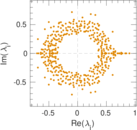
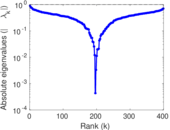
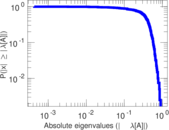
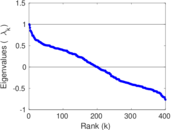
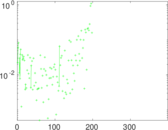
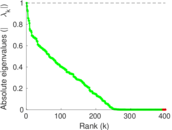
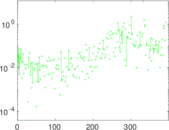
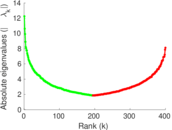
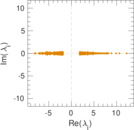
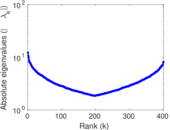
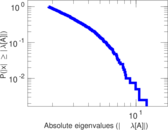
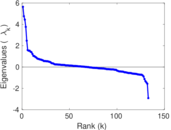
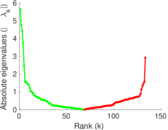
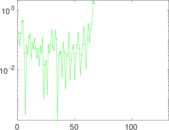
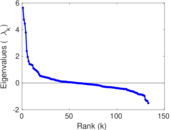
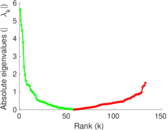
Plots


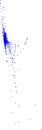
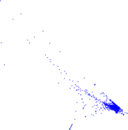


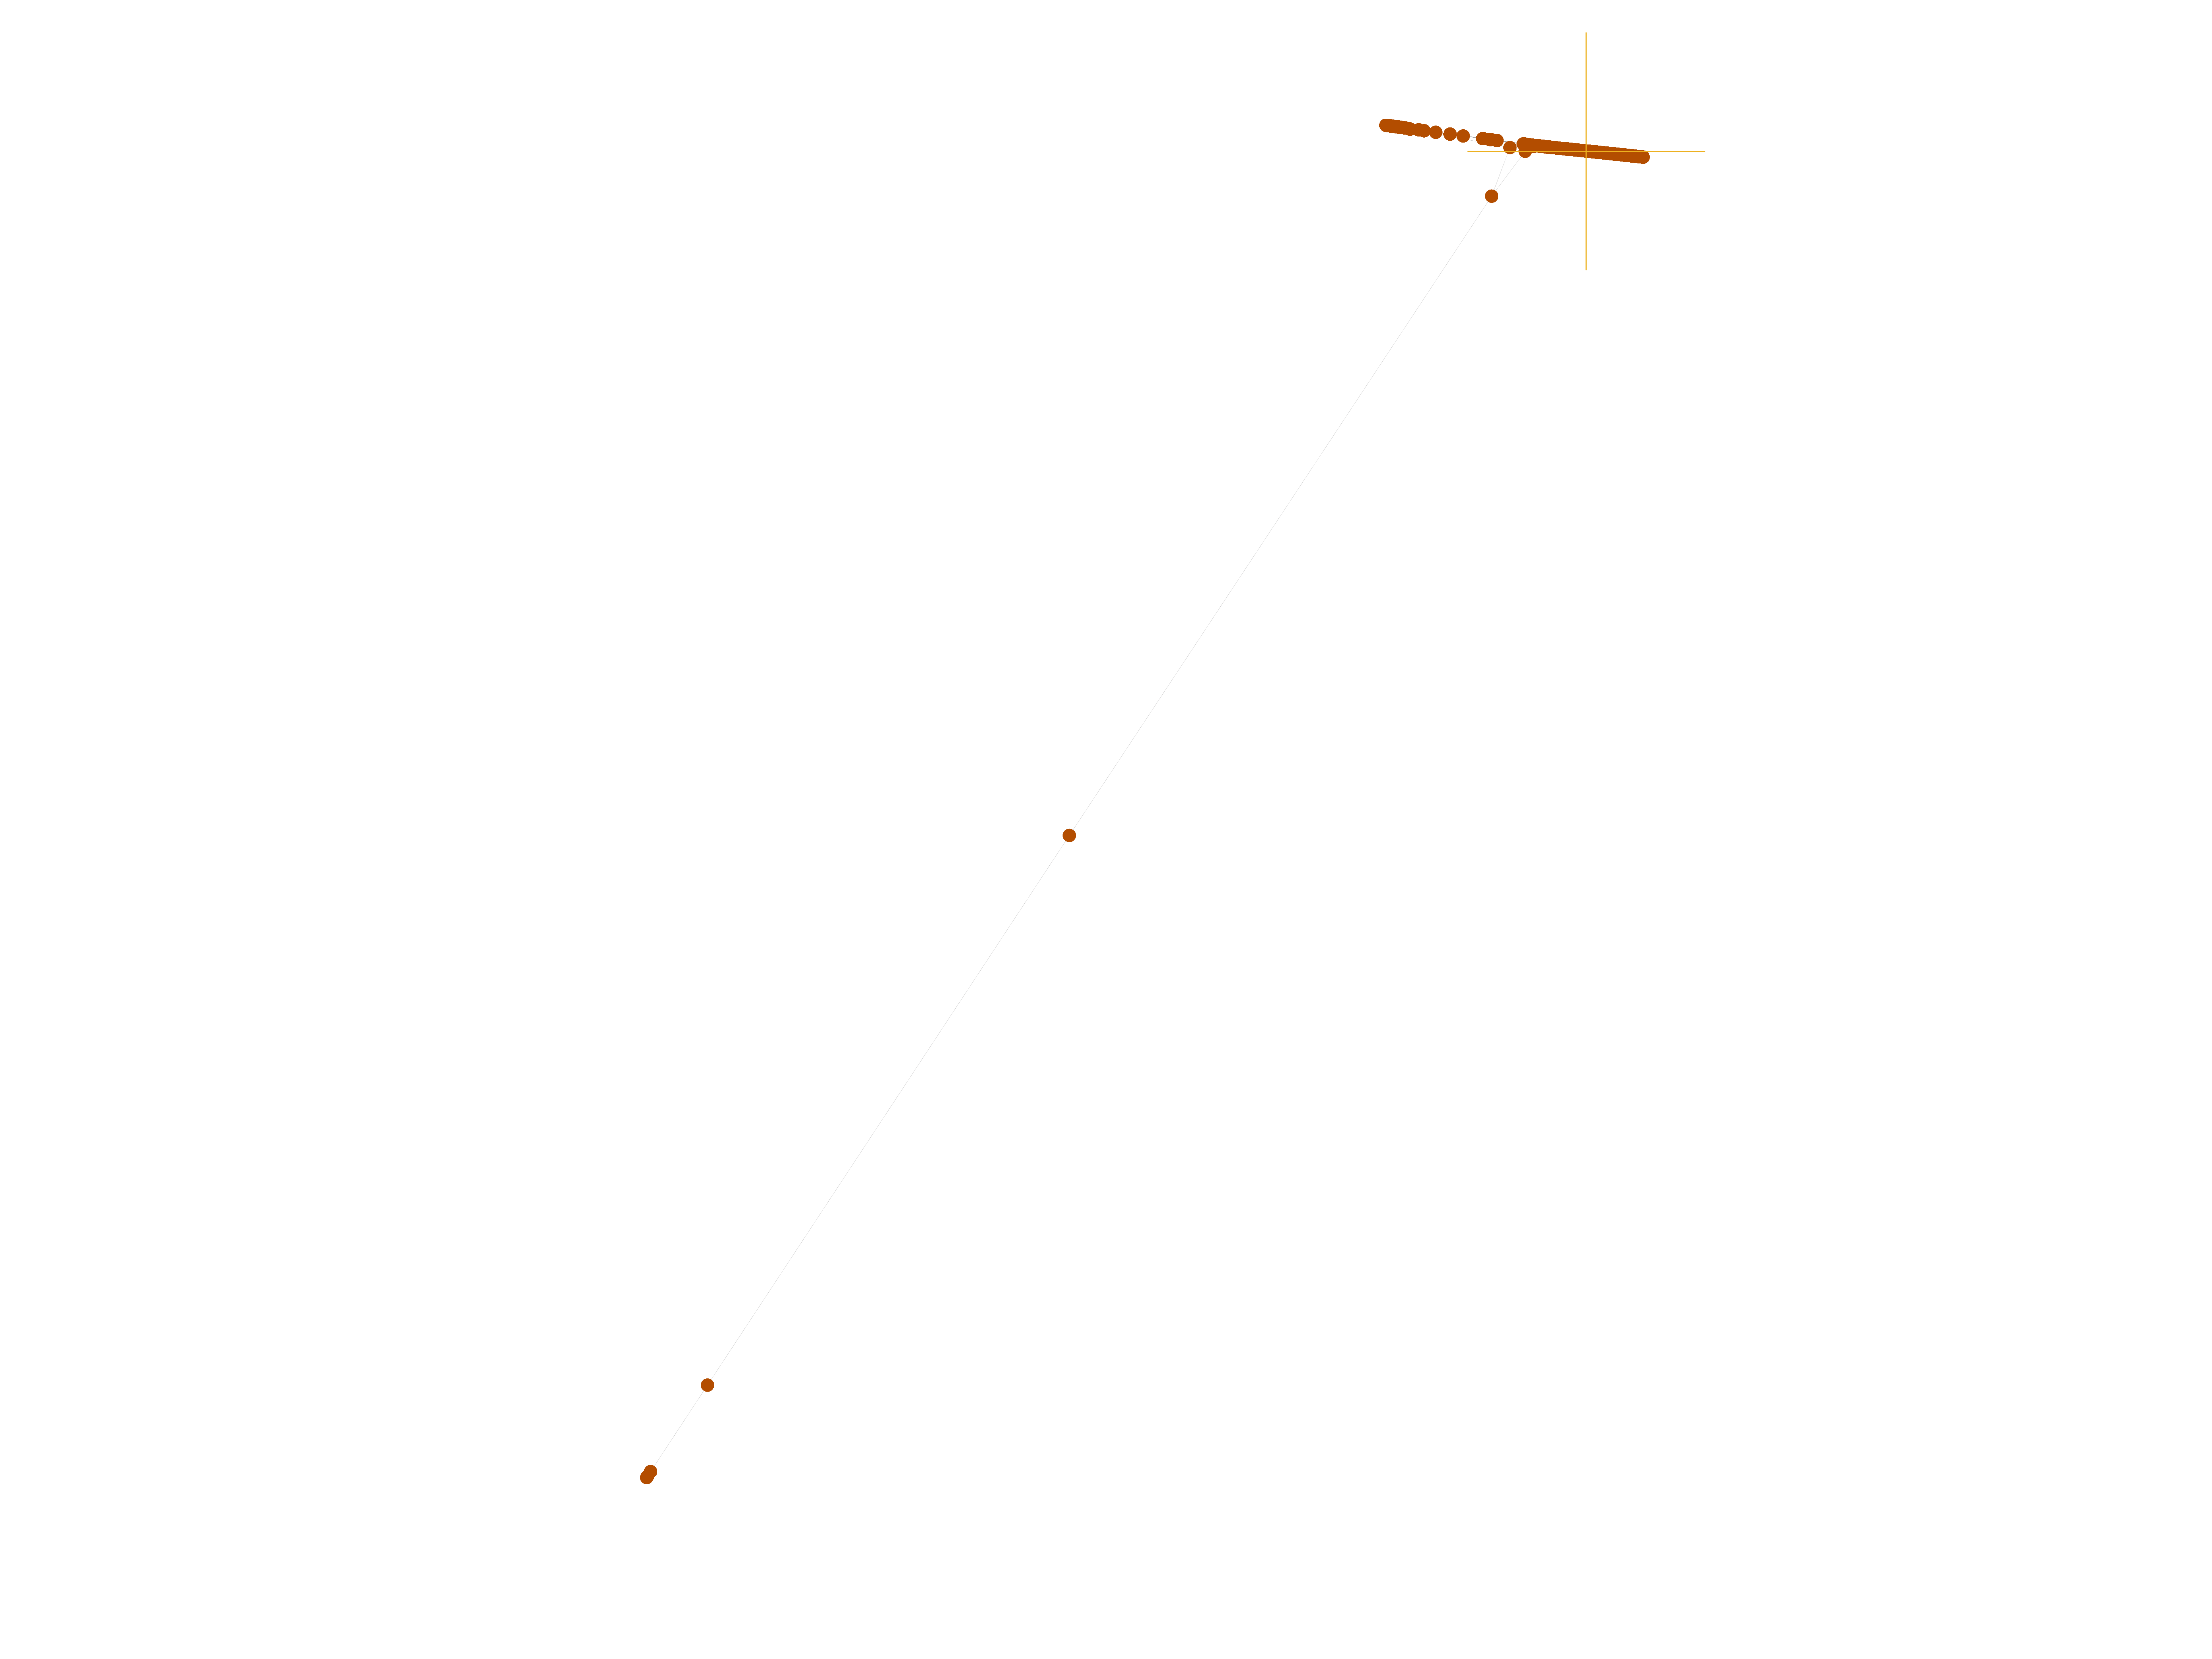
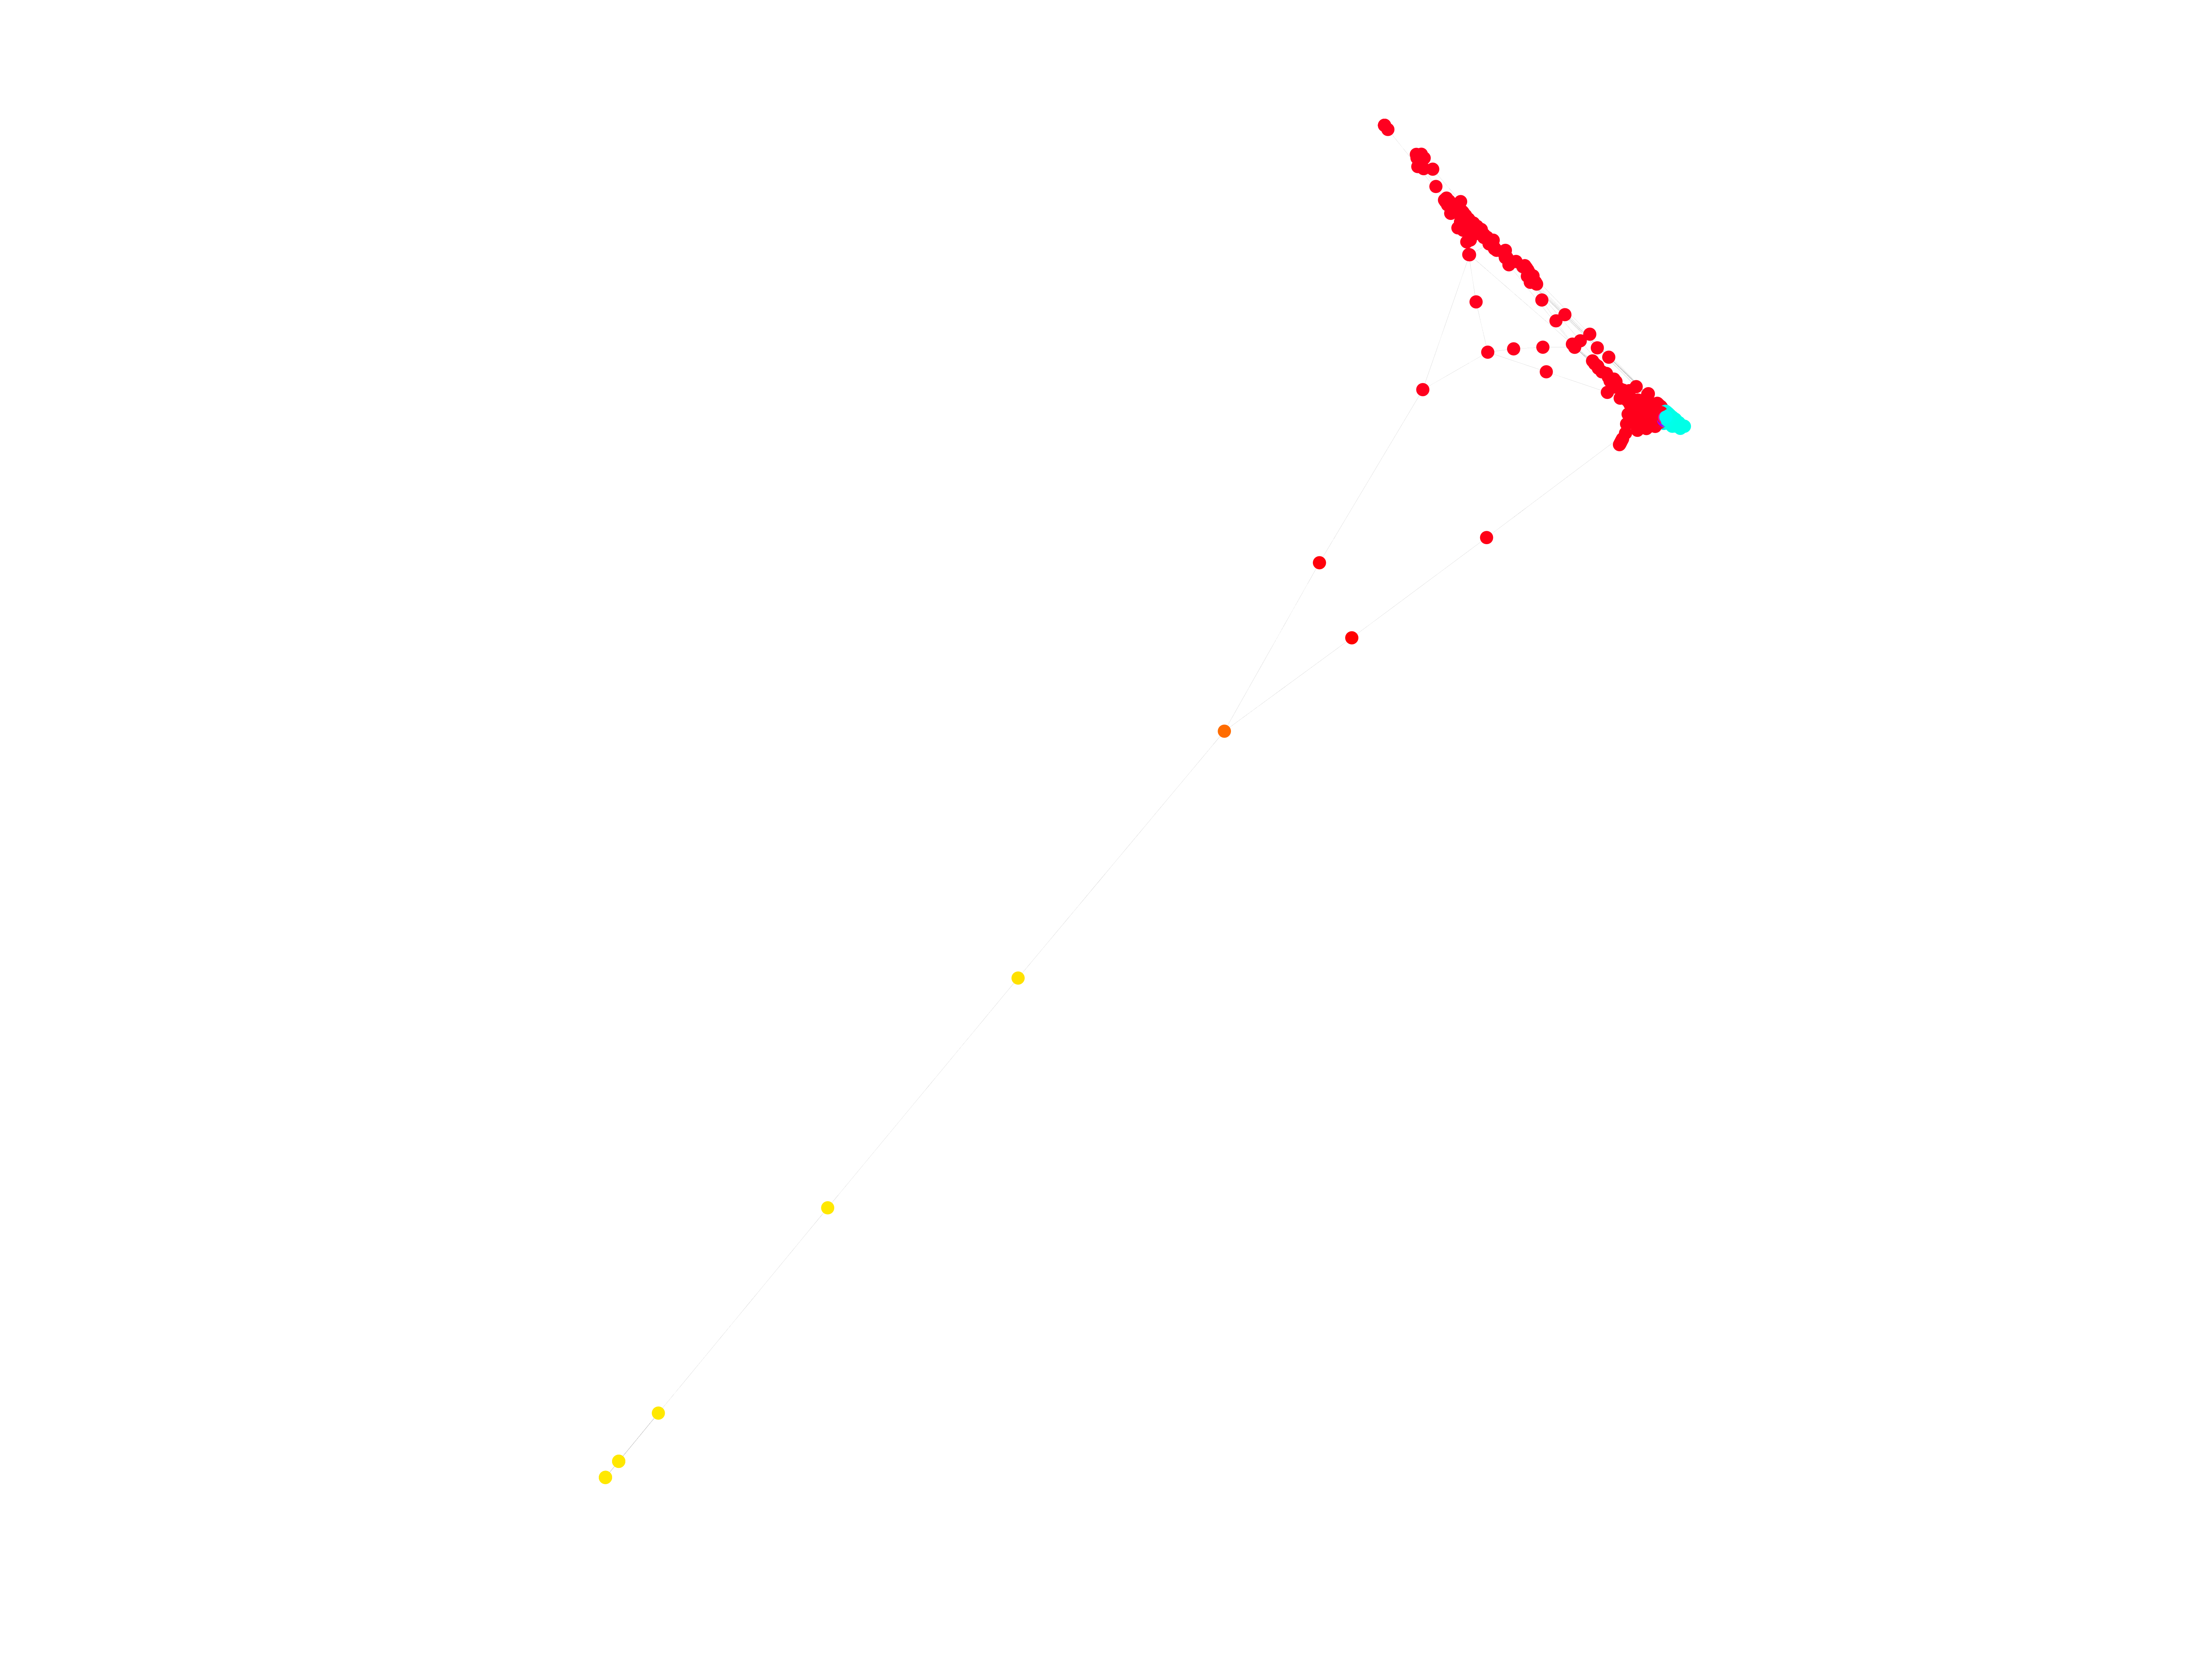
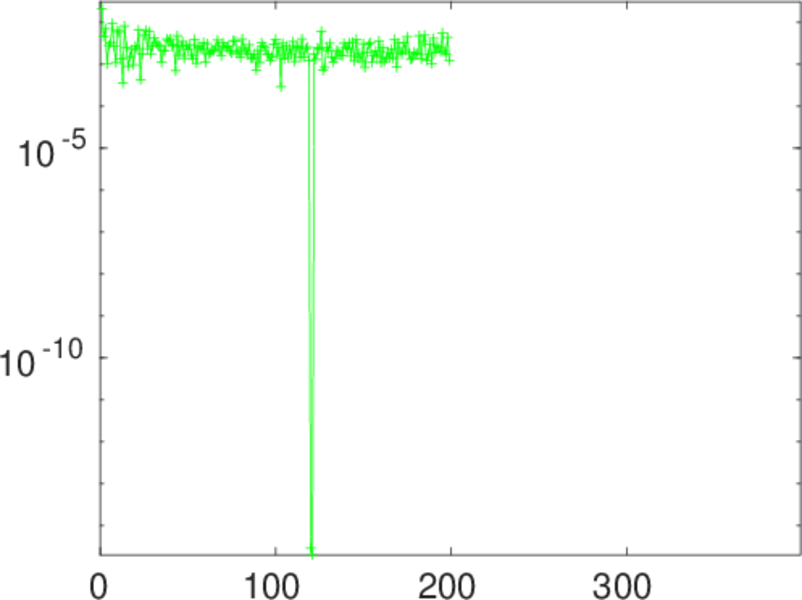
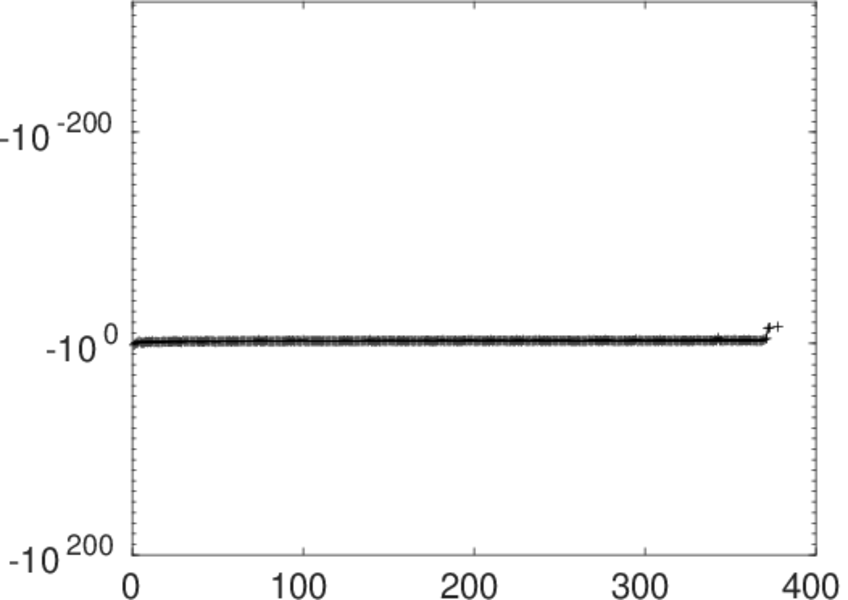
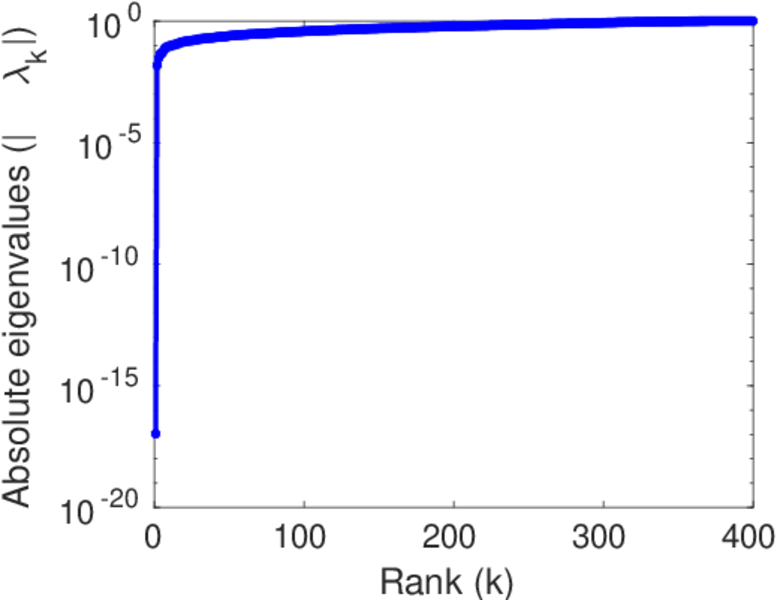
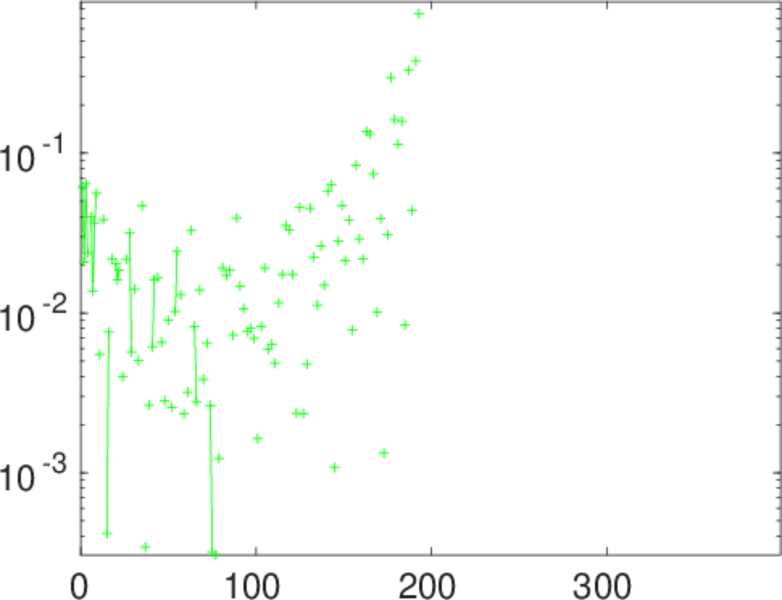
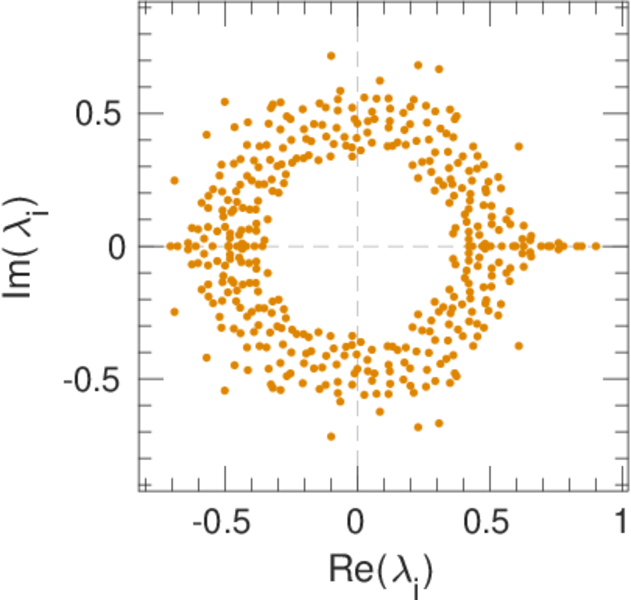
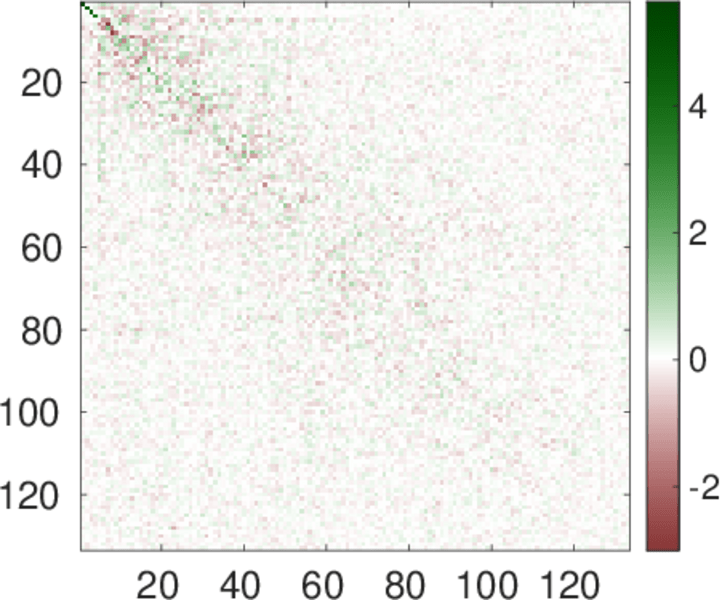
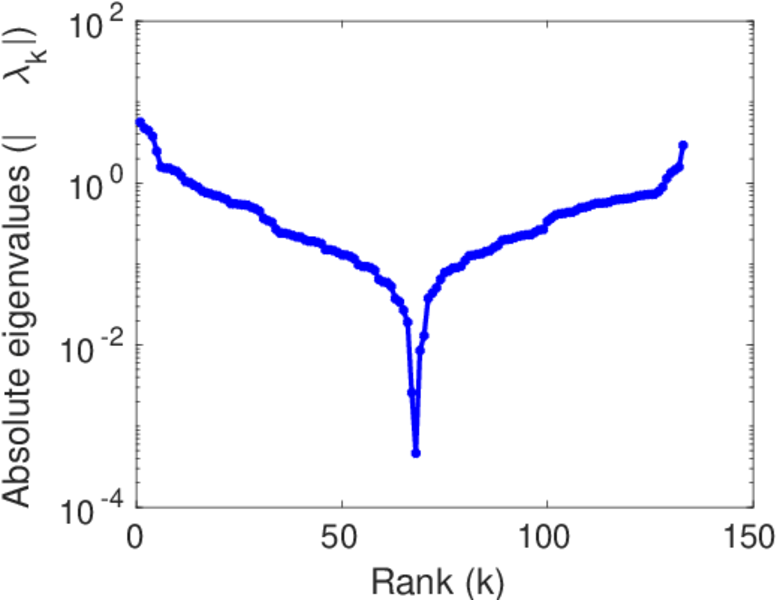
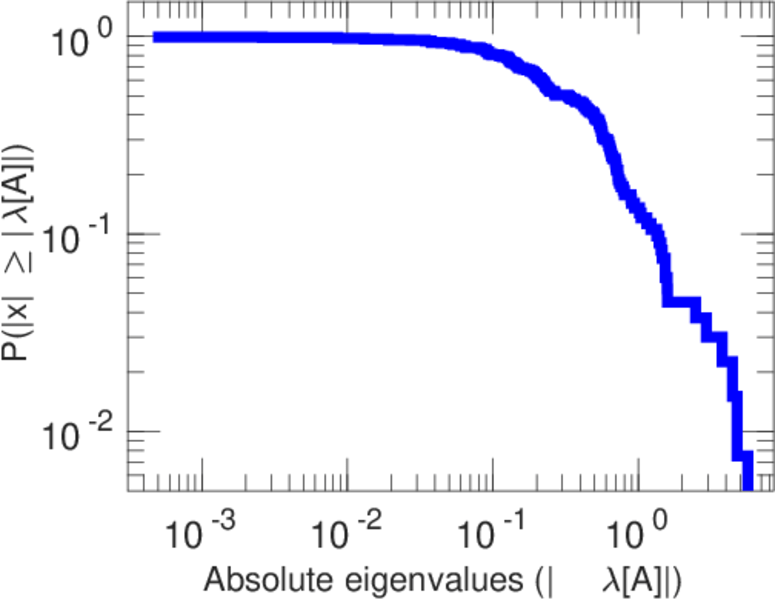
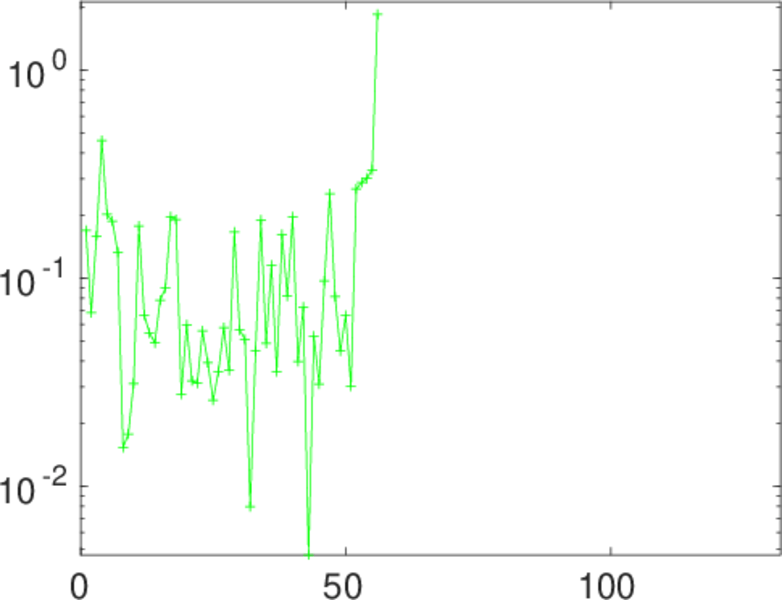
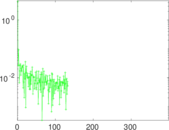
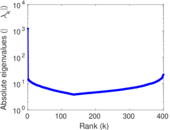
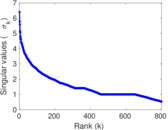
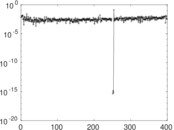
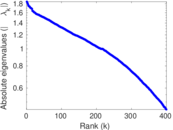
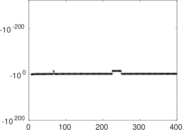
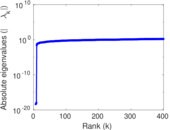
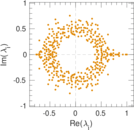
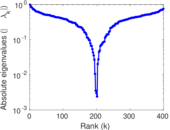
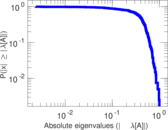
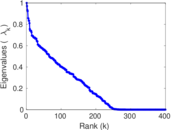
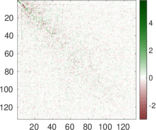
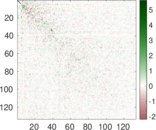
Matrix decompositions plots


Downloads
References
|
[1]
|
Jérôme Kunegis.
KONECT – The Koblenz Network Collection.
In Proc. Int. Conf. on World Wide Web Companion, pages
1343–1350, 2013.
[ http ]
|
|
[2]
|
Federal Aviation Administration.
Air traffic control system command center.
http://www.fly.faa.gov/.
|
 KONECT ‣ Networks ‣
Buy Me a Coffee
KONECT ‣ Networks ‣
Buy Me a Coffee