Human proteins (Figeys)

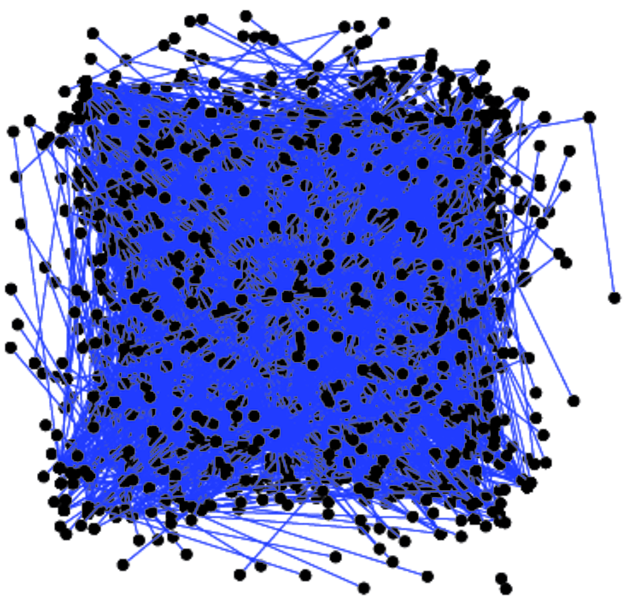
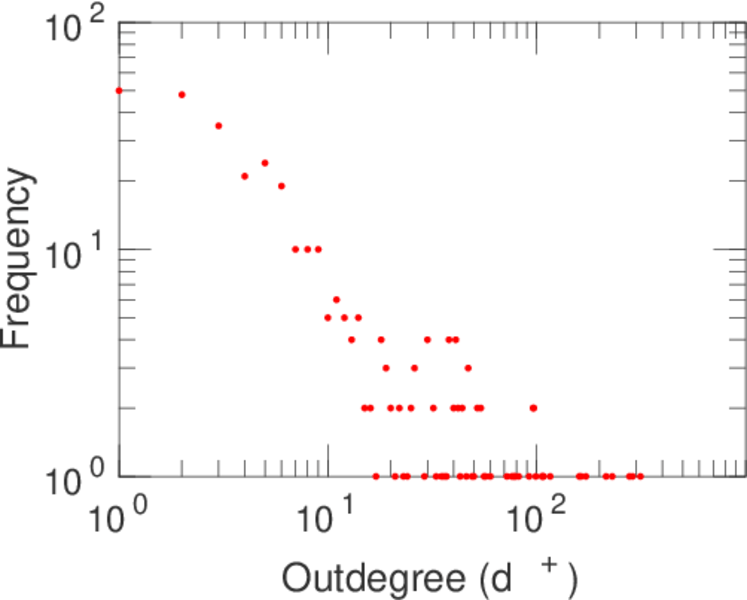
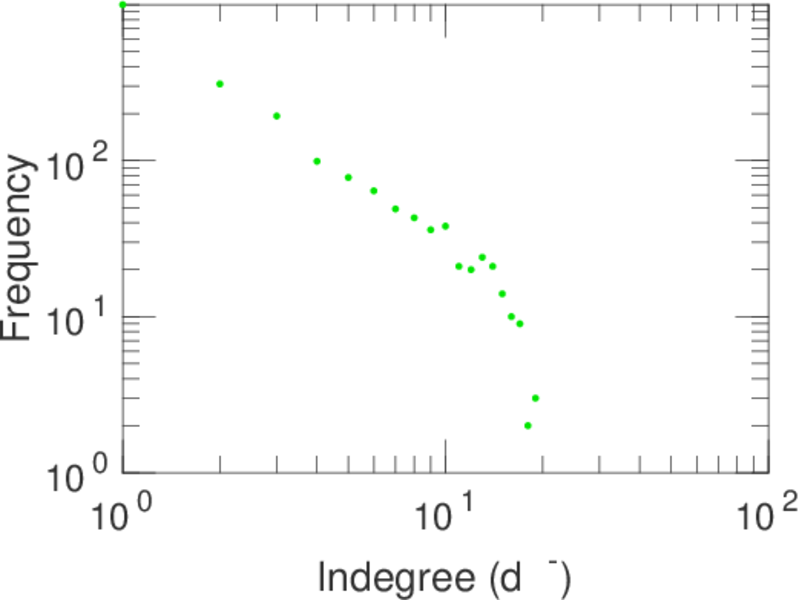
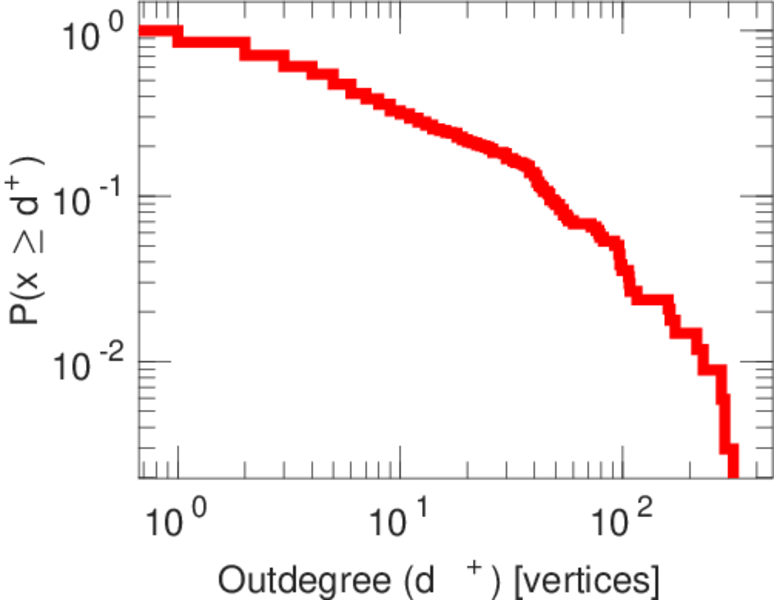
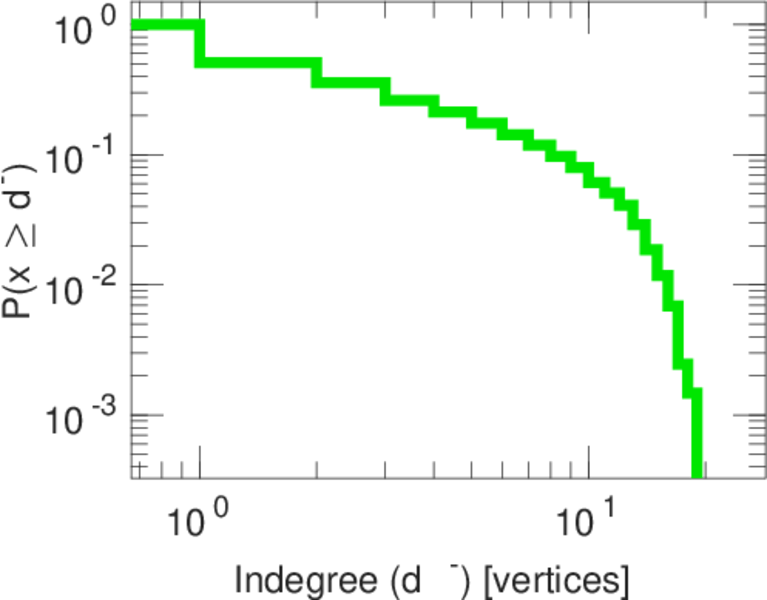
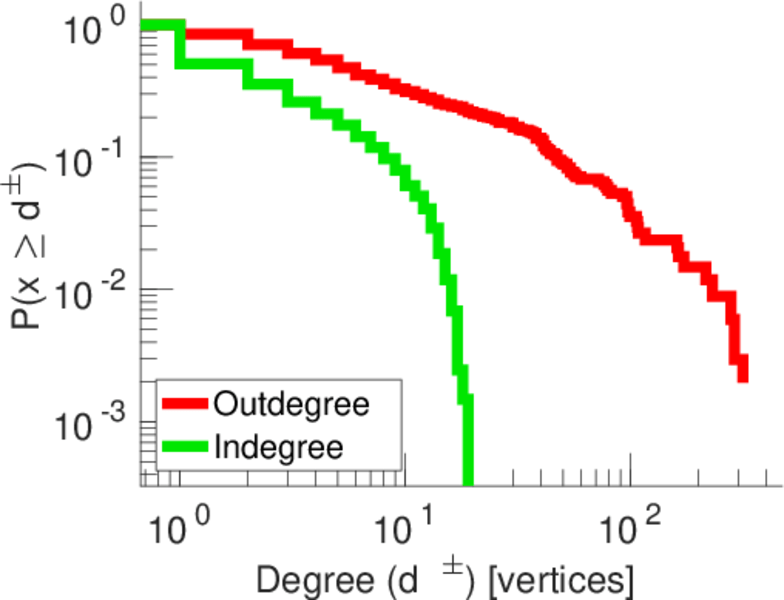
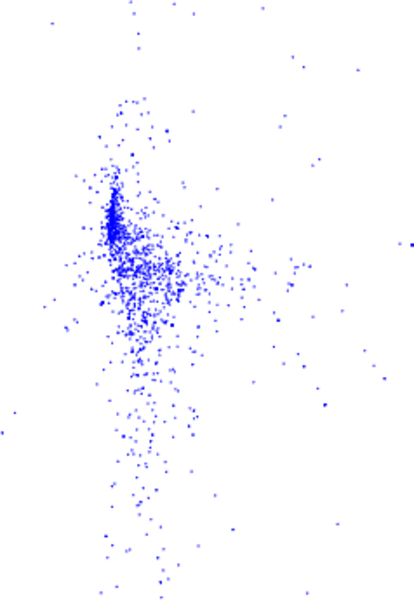
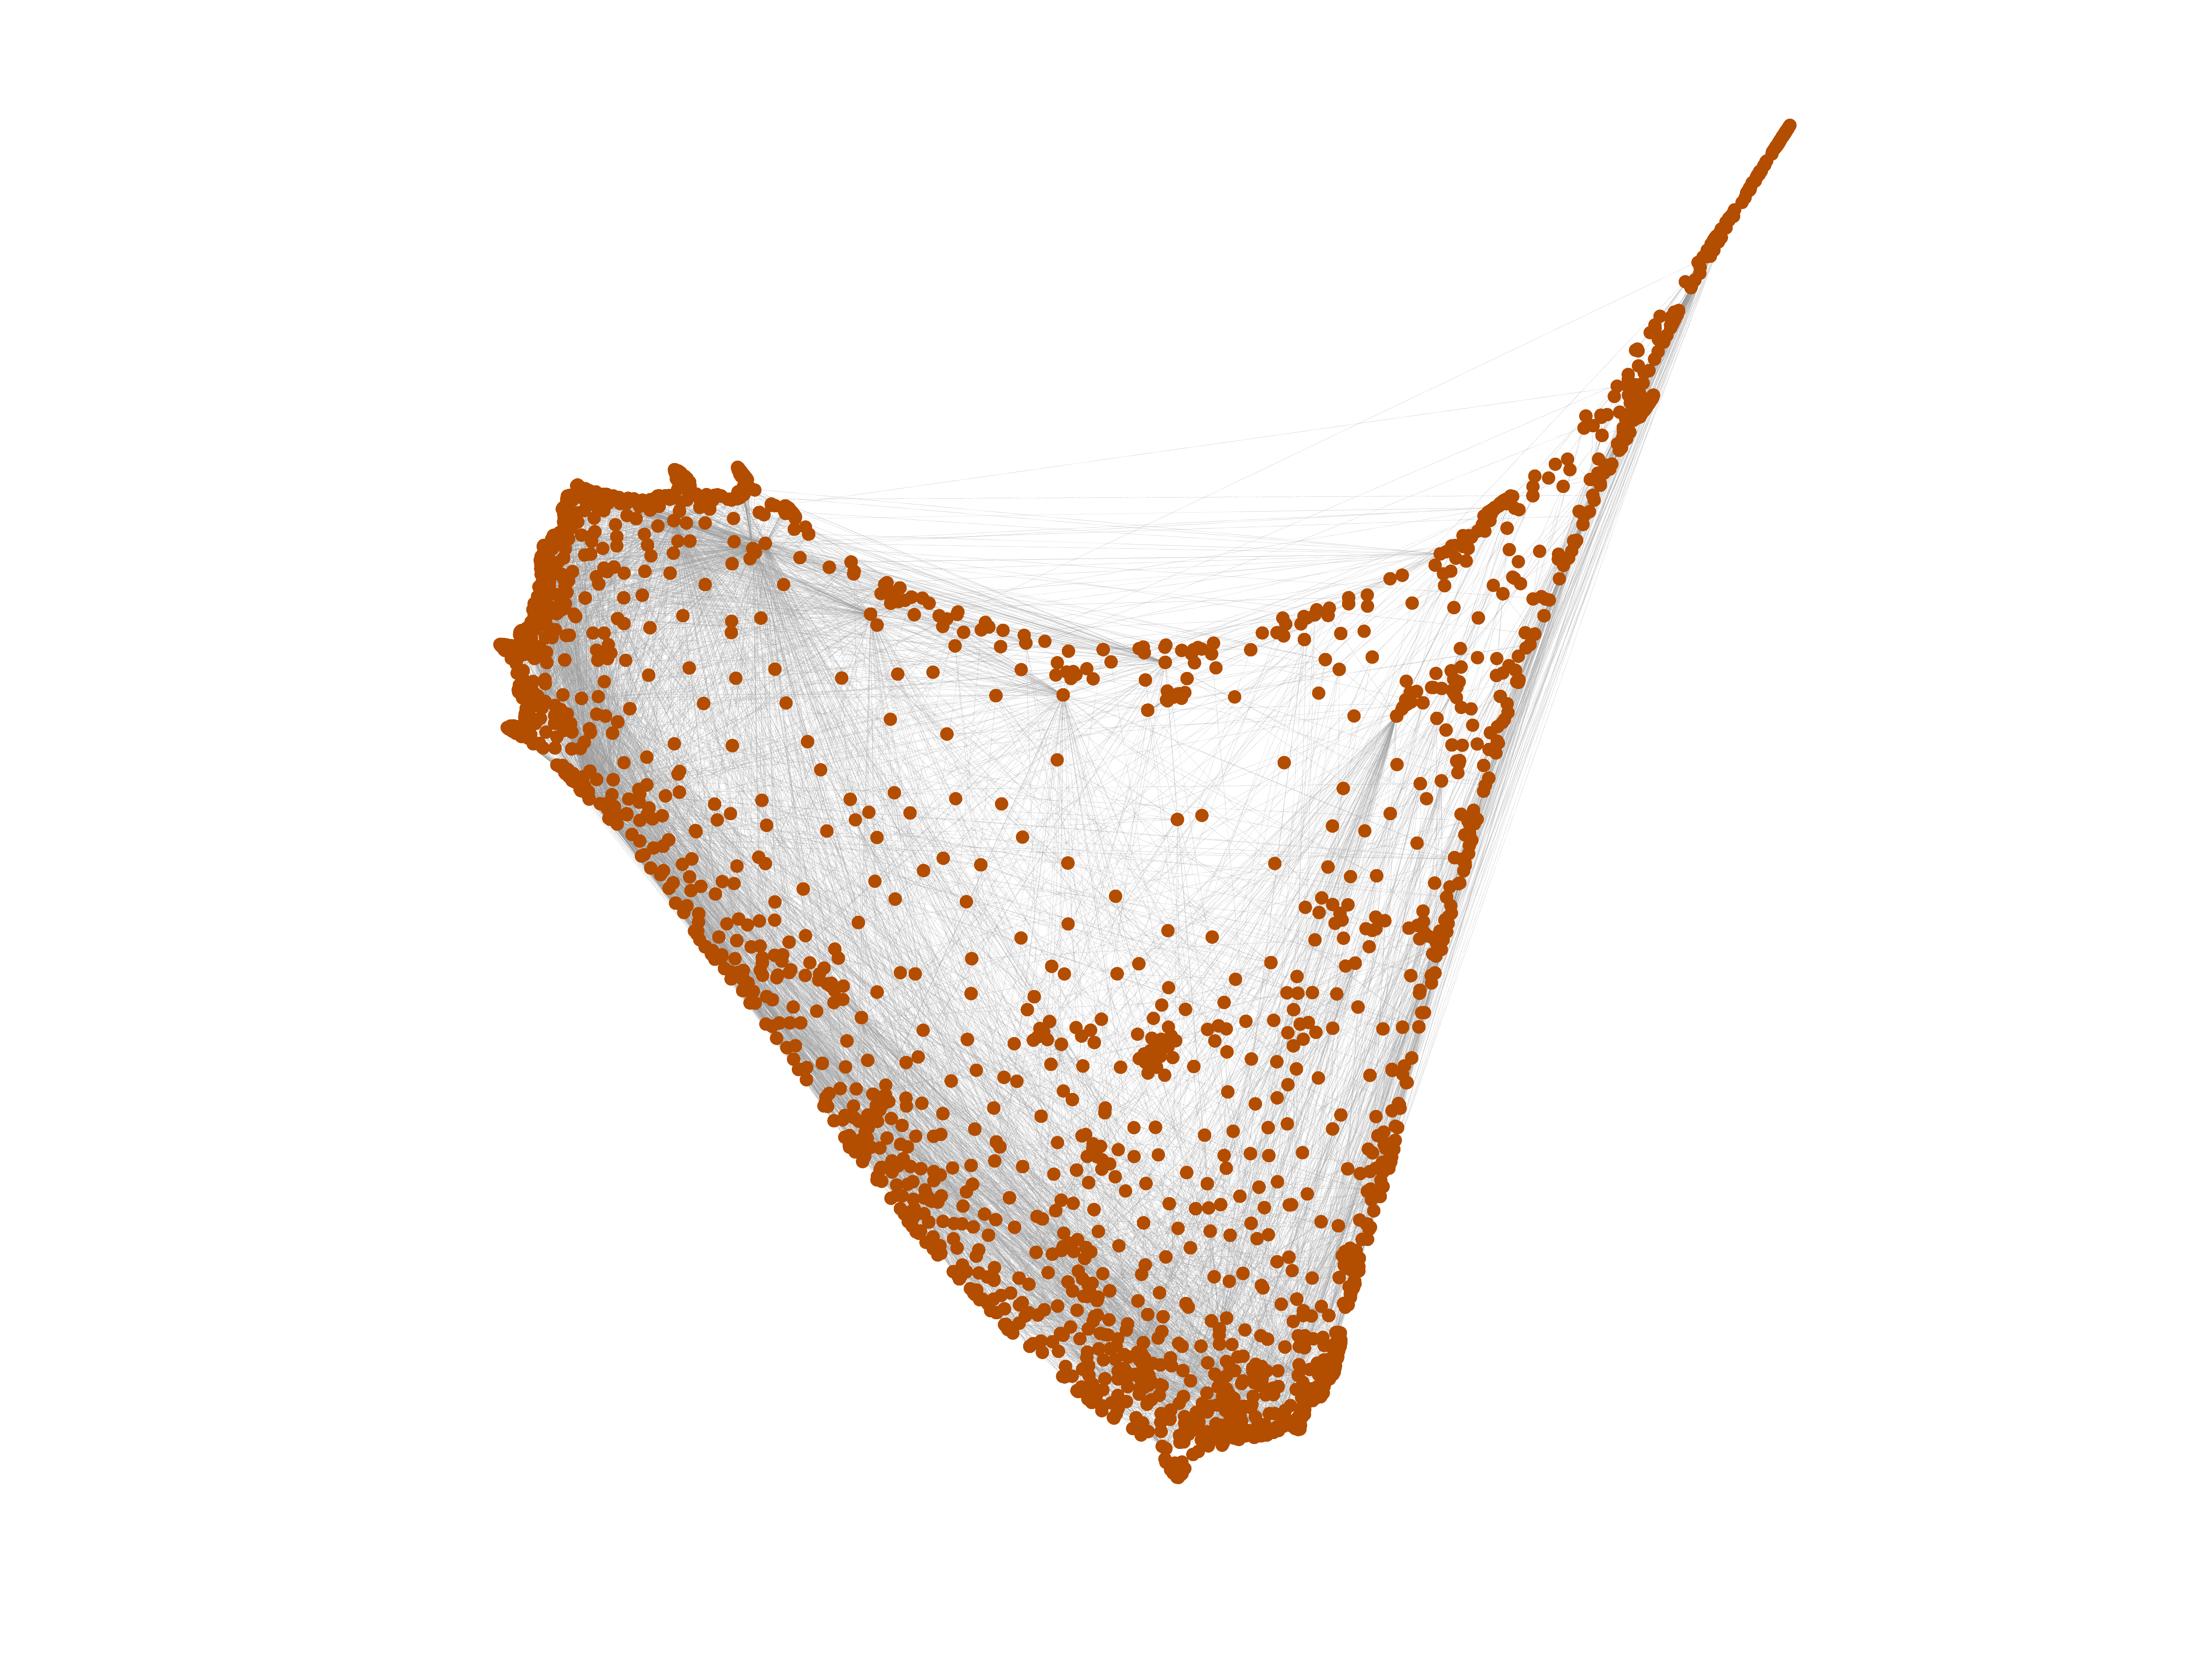
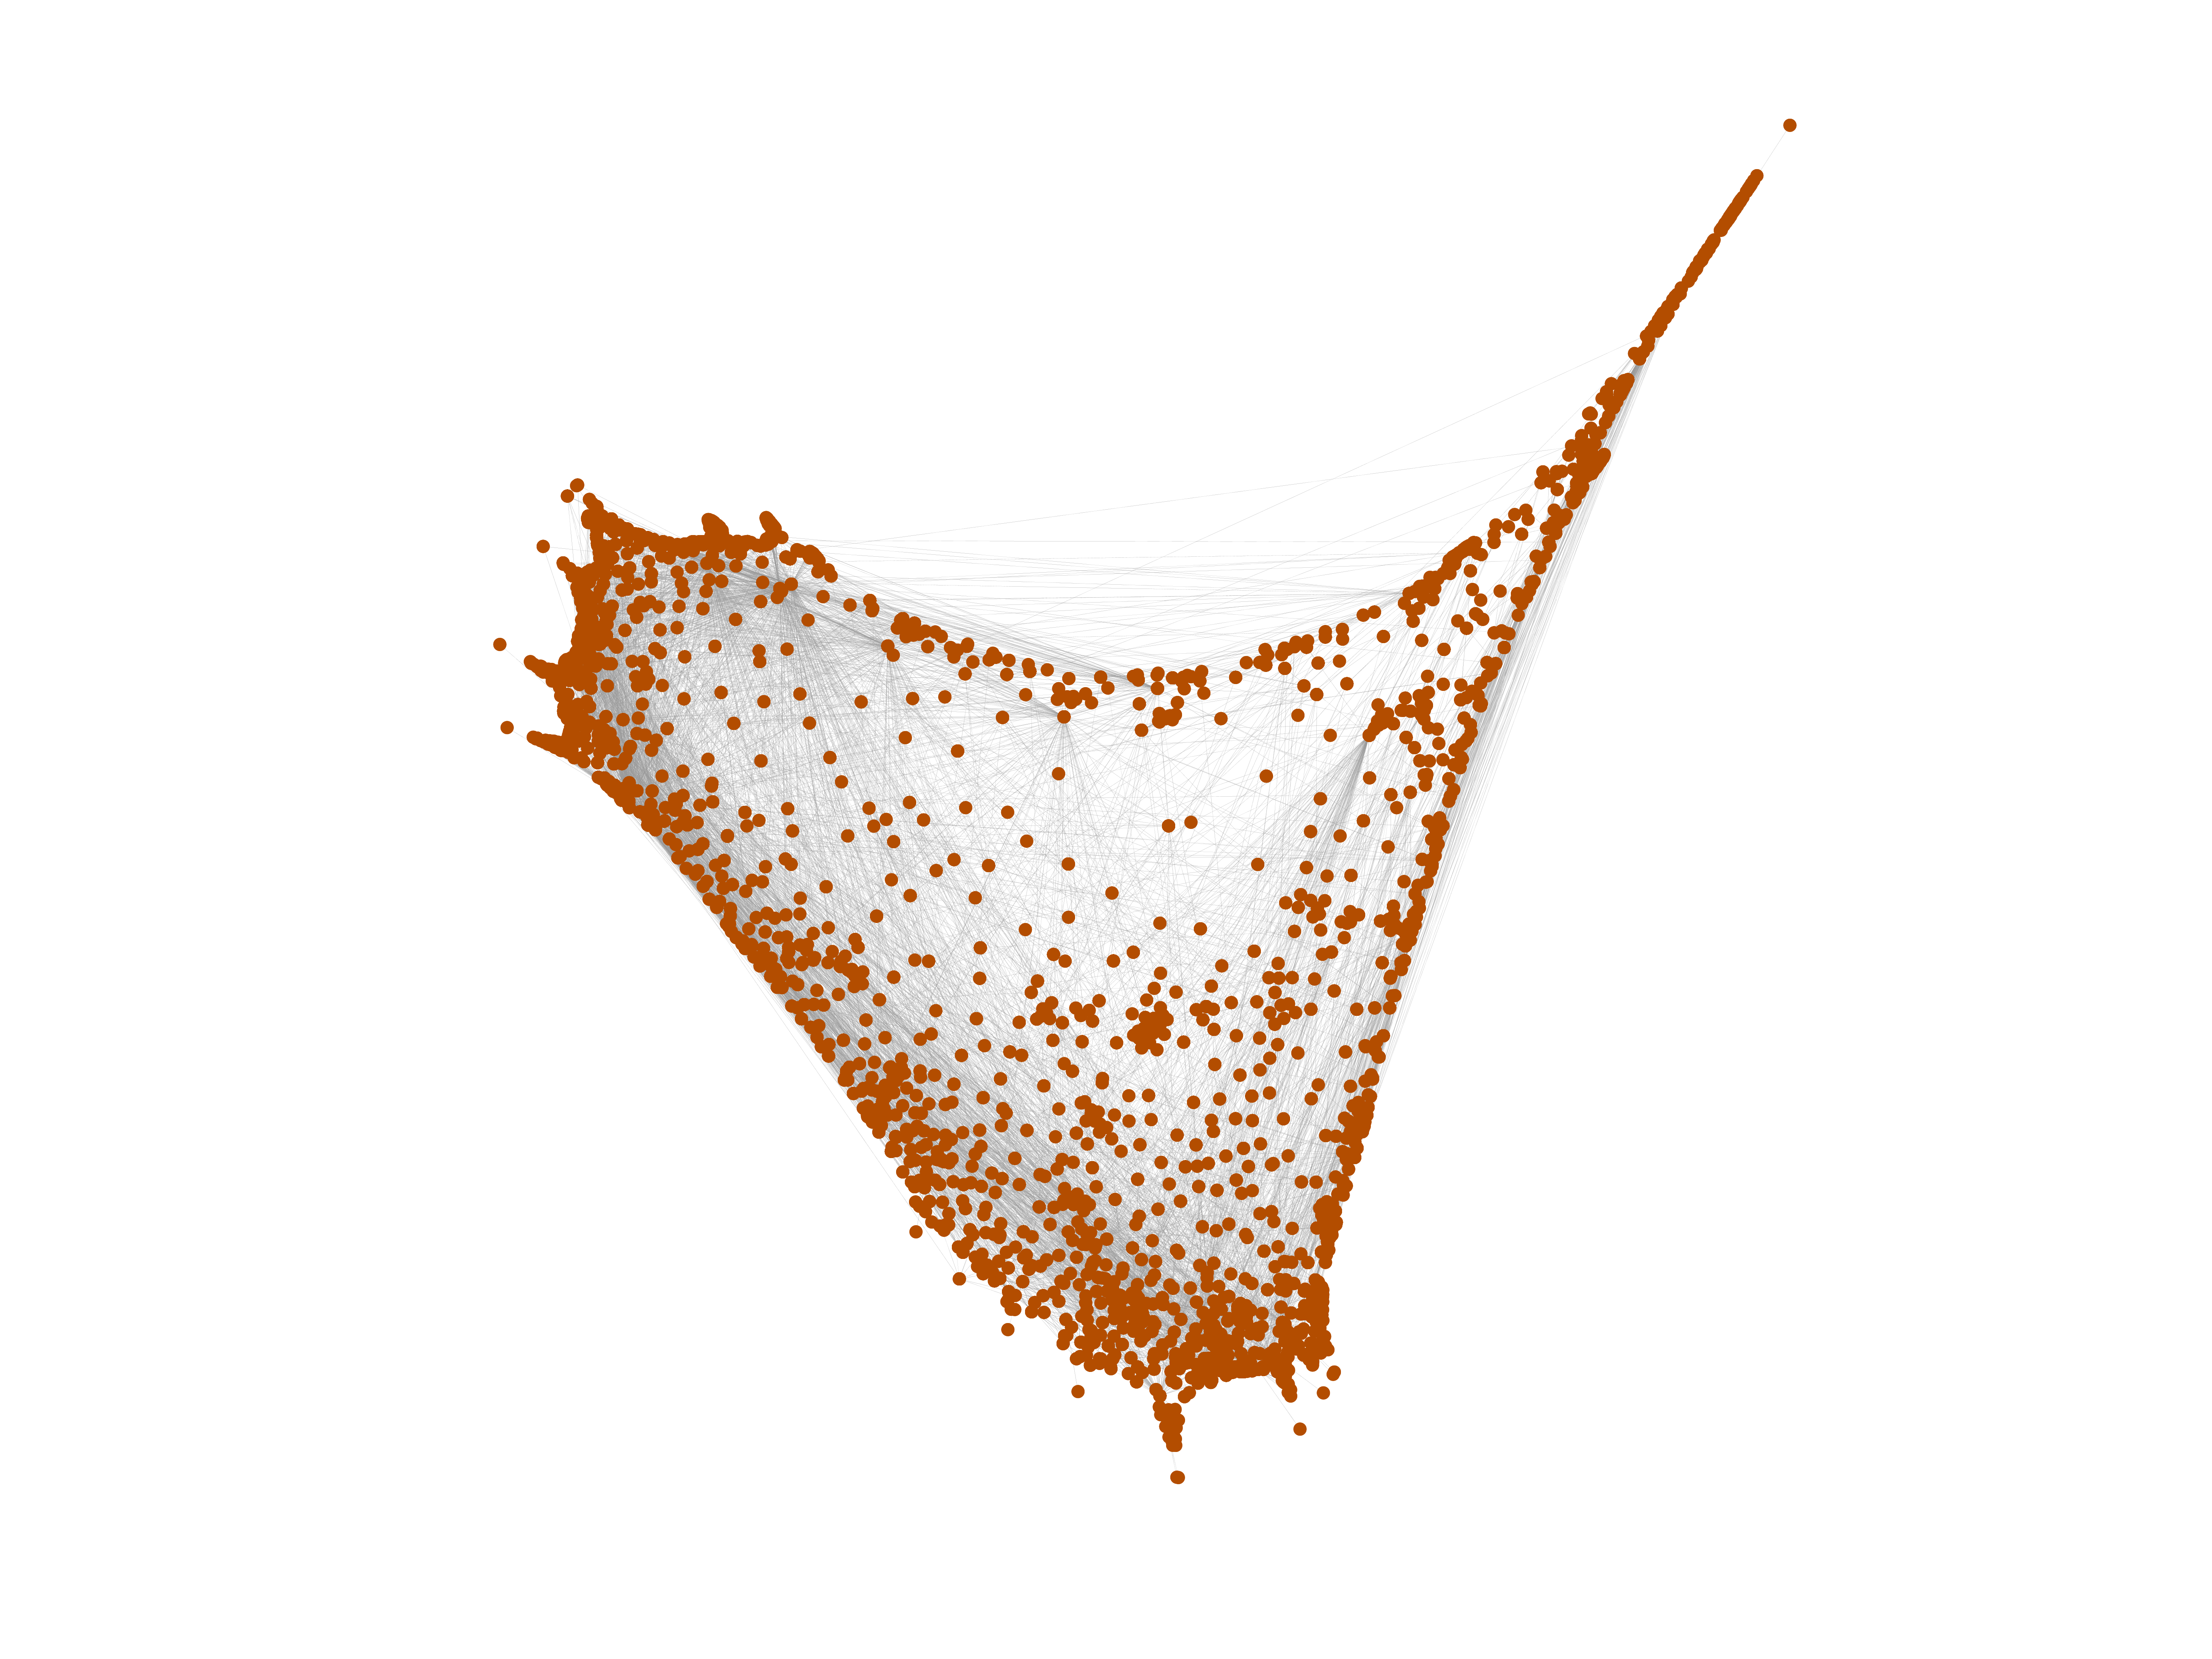
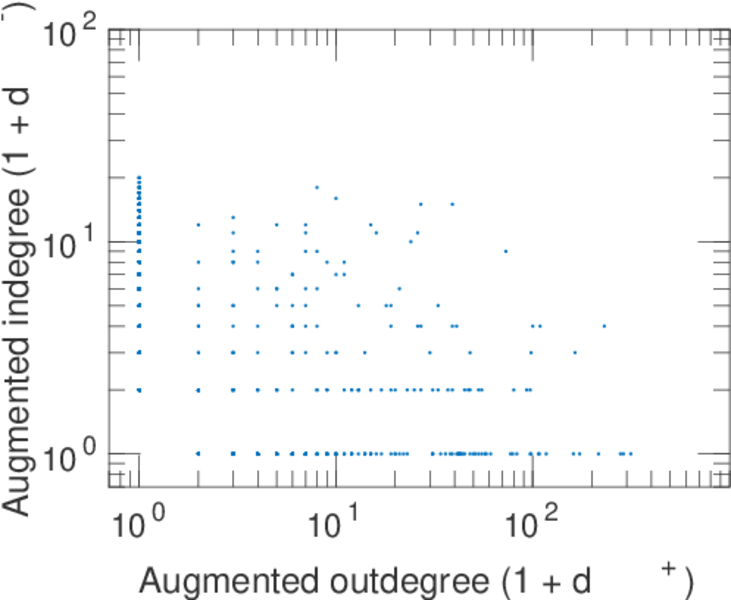
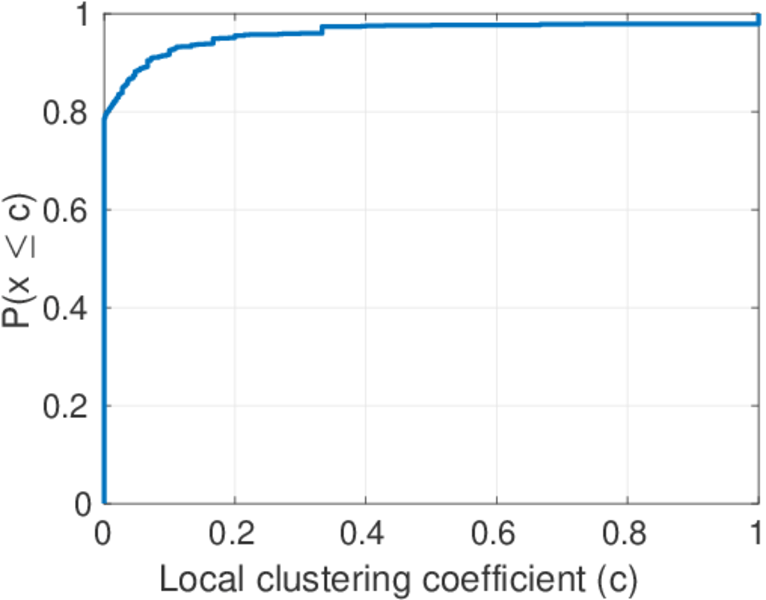
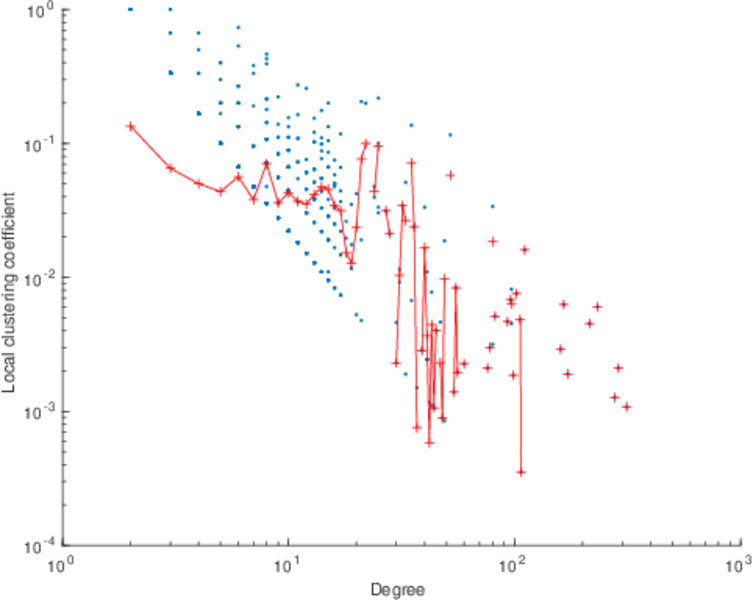
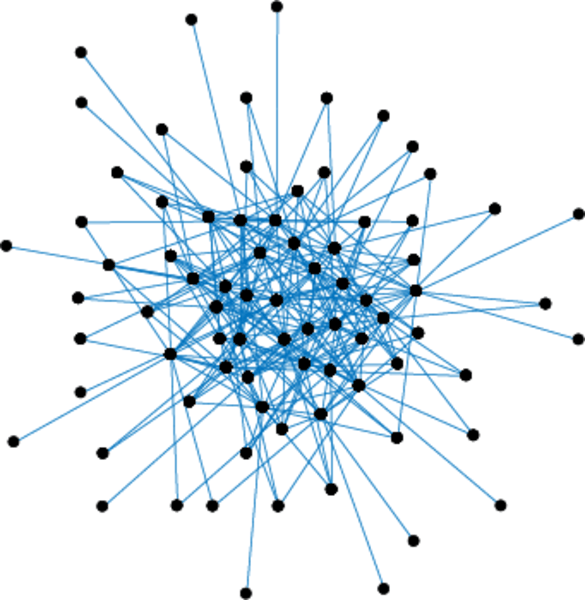
This is a network of interactions between proteins in Humans (Homo sapiens), from the first large-scale study of protein–protein interactions in Human cells using a mass spectrometry-based approach.

Metadata

CodeMF
Internal namemaayan-figeys
NameHuman proteins (Figeys)
Data sourcehttp://research.mssm.edu/maayan/datasets/qualitative_networks.shtml
AvailabilityDataset is available for download
Consistency checkDataset passed all tests
Category
Metabolic network
Node meaningProtein
Edge meaningInteraction
Network formatUnipartite, directed
Edge typeUnweighted, no multiple edges
ReciprocalContains reciprocal edges
Directed cyclesContains directed cycles
LoopsDoes not contain loops

Statistics

Size n =2,239
Volume m =6,452
Loop count l =0
Wedge count s =353,779
Claw count z =21,373,531
Cross count x =1,277,691,904
Triangle count t =897
Square count q =166,681
4-Tour count T4 =2,761,428
Maximum degree dmax =314
Maximum outdegree d+max =314
Maximum indegree dmax =19
Average degree d =5.763 29
Fill p =0.001 287 60
Size of LCC N =2,217
Size of LSCC Ns =8
Relative size of LSCC Nrs =0.003 573 02
Diameter δ =10
50-Percentile effective diameter δ0.5 =3.496 74
90-Percentile effective diameter δ0.9 =4.833 42
Median distance δM =4
Mean distance δm =3.978 68
Gini coefficient G =0.671 702
Balanced inequality ratio P =0.236 671
Outdegree balanced inequality ratio P+ =0.206 913
Indegree balanced inequality ratio P =0.298 822
Relative edge distribution entropy Her =0.854 883
Power law exponent γ =2.092 69
Tail power law exponent γt =1.721 00
Tail power law exponent with p γ3 =1.721 00
p-value p =0.000 00
Outdegree tail power law exponent with p γ3,o =1.691 00
Outdegree p-value po =0.001 000 00
Indegree tail power law exponent with p γ3,i =1.851 00
Indegree p-value pi =0.000 00
Degree assortativity ρ =−0.330 527
Degree assortativity p-value pρ =0.000 00
In/outdegree correlation ρ± =−0.286 507
Clustering coefficient c =0.007 606 44
Directed clustering coefficient c± =0.139 434
Spectral norm α =31.581 2
Operator 2-norm ν =30.777 6
Cyclic eigenvalue π =2.768 80
Algebraic connectivity a =0.102 530
Spectral separation 1[A] / λ2[A]| =1.050 19
Reciprocity y =0.006 199 63
Non-bipartivity bA =0.047 786 8
Normalized non-bipartivity bN =0.050 174 8
Algebraic non-bipartivity χ =0.104 135
Spectral bipartite frustration bK =0.004 496 47
Controllability C =1,906
Relative controllability Cr =0.851 273

Plots

Fruchterman–Reingold graph drawing

Degree distribution

Cumulative degree distribution

Lorenz curve

Spectral distribution of the adjacency matrix

Spectral distribution of the normalized adjacency matrix

Spectral distribution of the Laplacian

Spectral graph drawing based on the adjacency matrix

Spectral graph drawing based on the Laplacian

Spectral graph drawing based on the normalized adjacency matrix

Degree assortativity

Zipf plot

Hop distribution

Double Laplacian graph drawing

Delaunay graph drawing

In/outdegree scatter plot

Clustering coefficient distribution

Average neighbor degree distribution

SynGraphy

Matrix decompositions plots

Downloads

References

[1] Jérôme Kunegis. KONECT – The Koblenz Network Collection. In Proc. Int. Conf. on World Wide Web Companion, pages 1343–1350, 2013. [ http ]
[2] Rob M. Ewing, Peter Chu, Fred Elisma, Hongyan Li, Paul Taylor, Shane Climie, Linda McBroom-Cerajewski, Mark D. Robinson, Liam O'Connor, Michael Li, Rod Taylor, Moyez Dharsee, Yuen Ho, Adrian Heilbut, Lynda Moore, Shudong Zhang, Olga Ornatsky, Yury V. Bukhman, Martin Ethier, Yinglun Sheng, Julian Vasilescu, Mohamed Abu-Farha, Jean-Philippe P. Lambert, Henry S. Duewel, Ian I. Stewart, Bonnie Kuehl, Kelly Hogue, Karen Colwill, Katharine Gladwish, Brenda Muskat, Robert Kinach, Sally-Lin L. Adams, Michael F. Moran, Gregg B. Morin, Thodoros Topaloglou, and Daniel Figeys. Large-scale mapping of human protein–protein interactions by mass spectrometry. Molecular Systems Biol., 3, 2007.