PDZBase

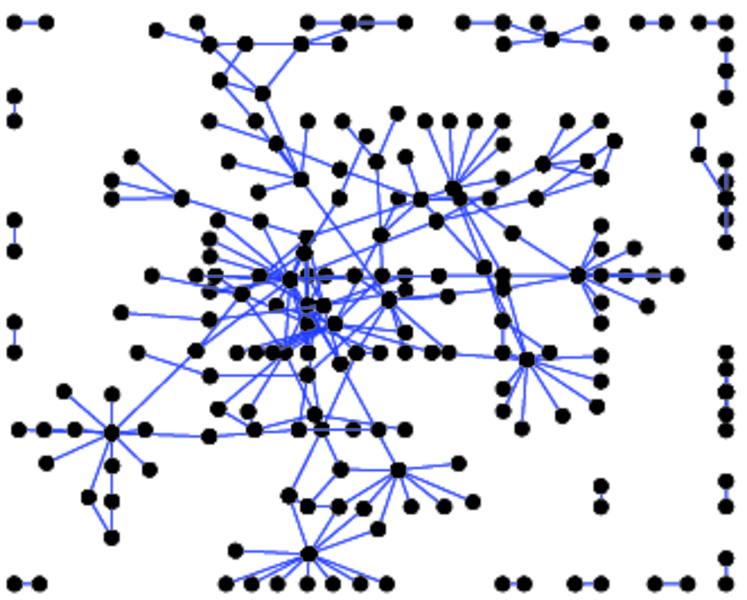
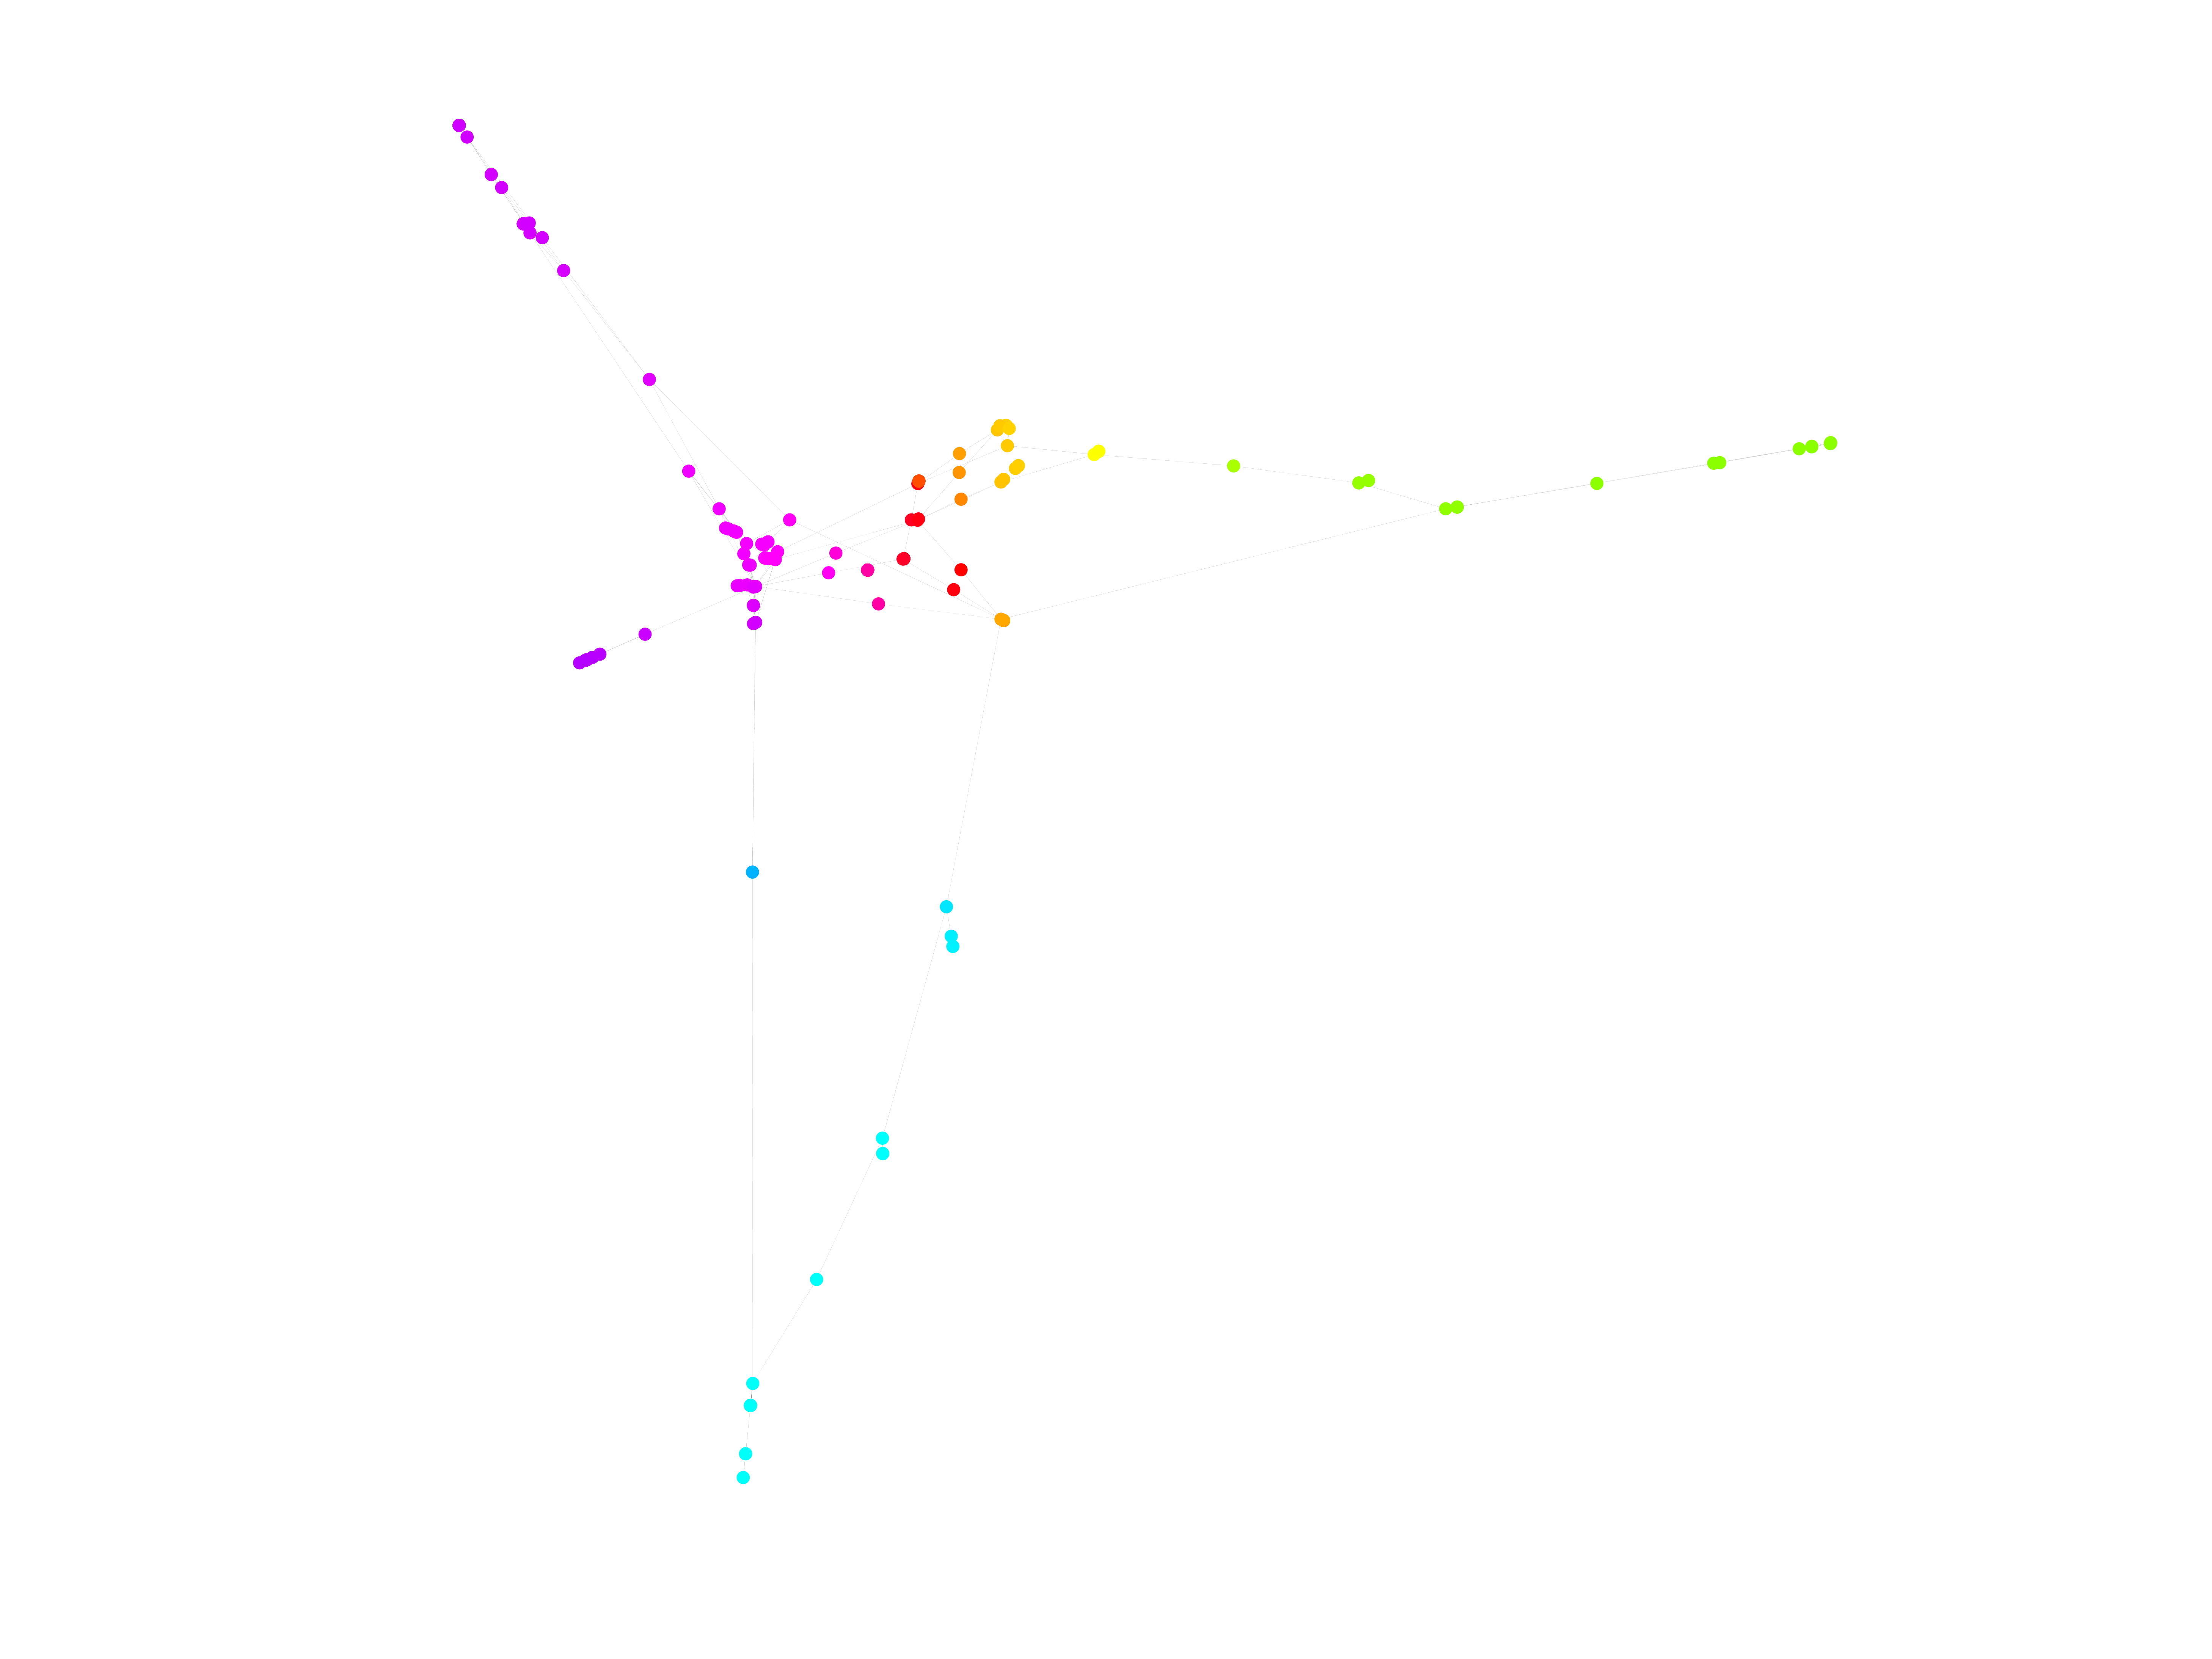
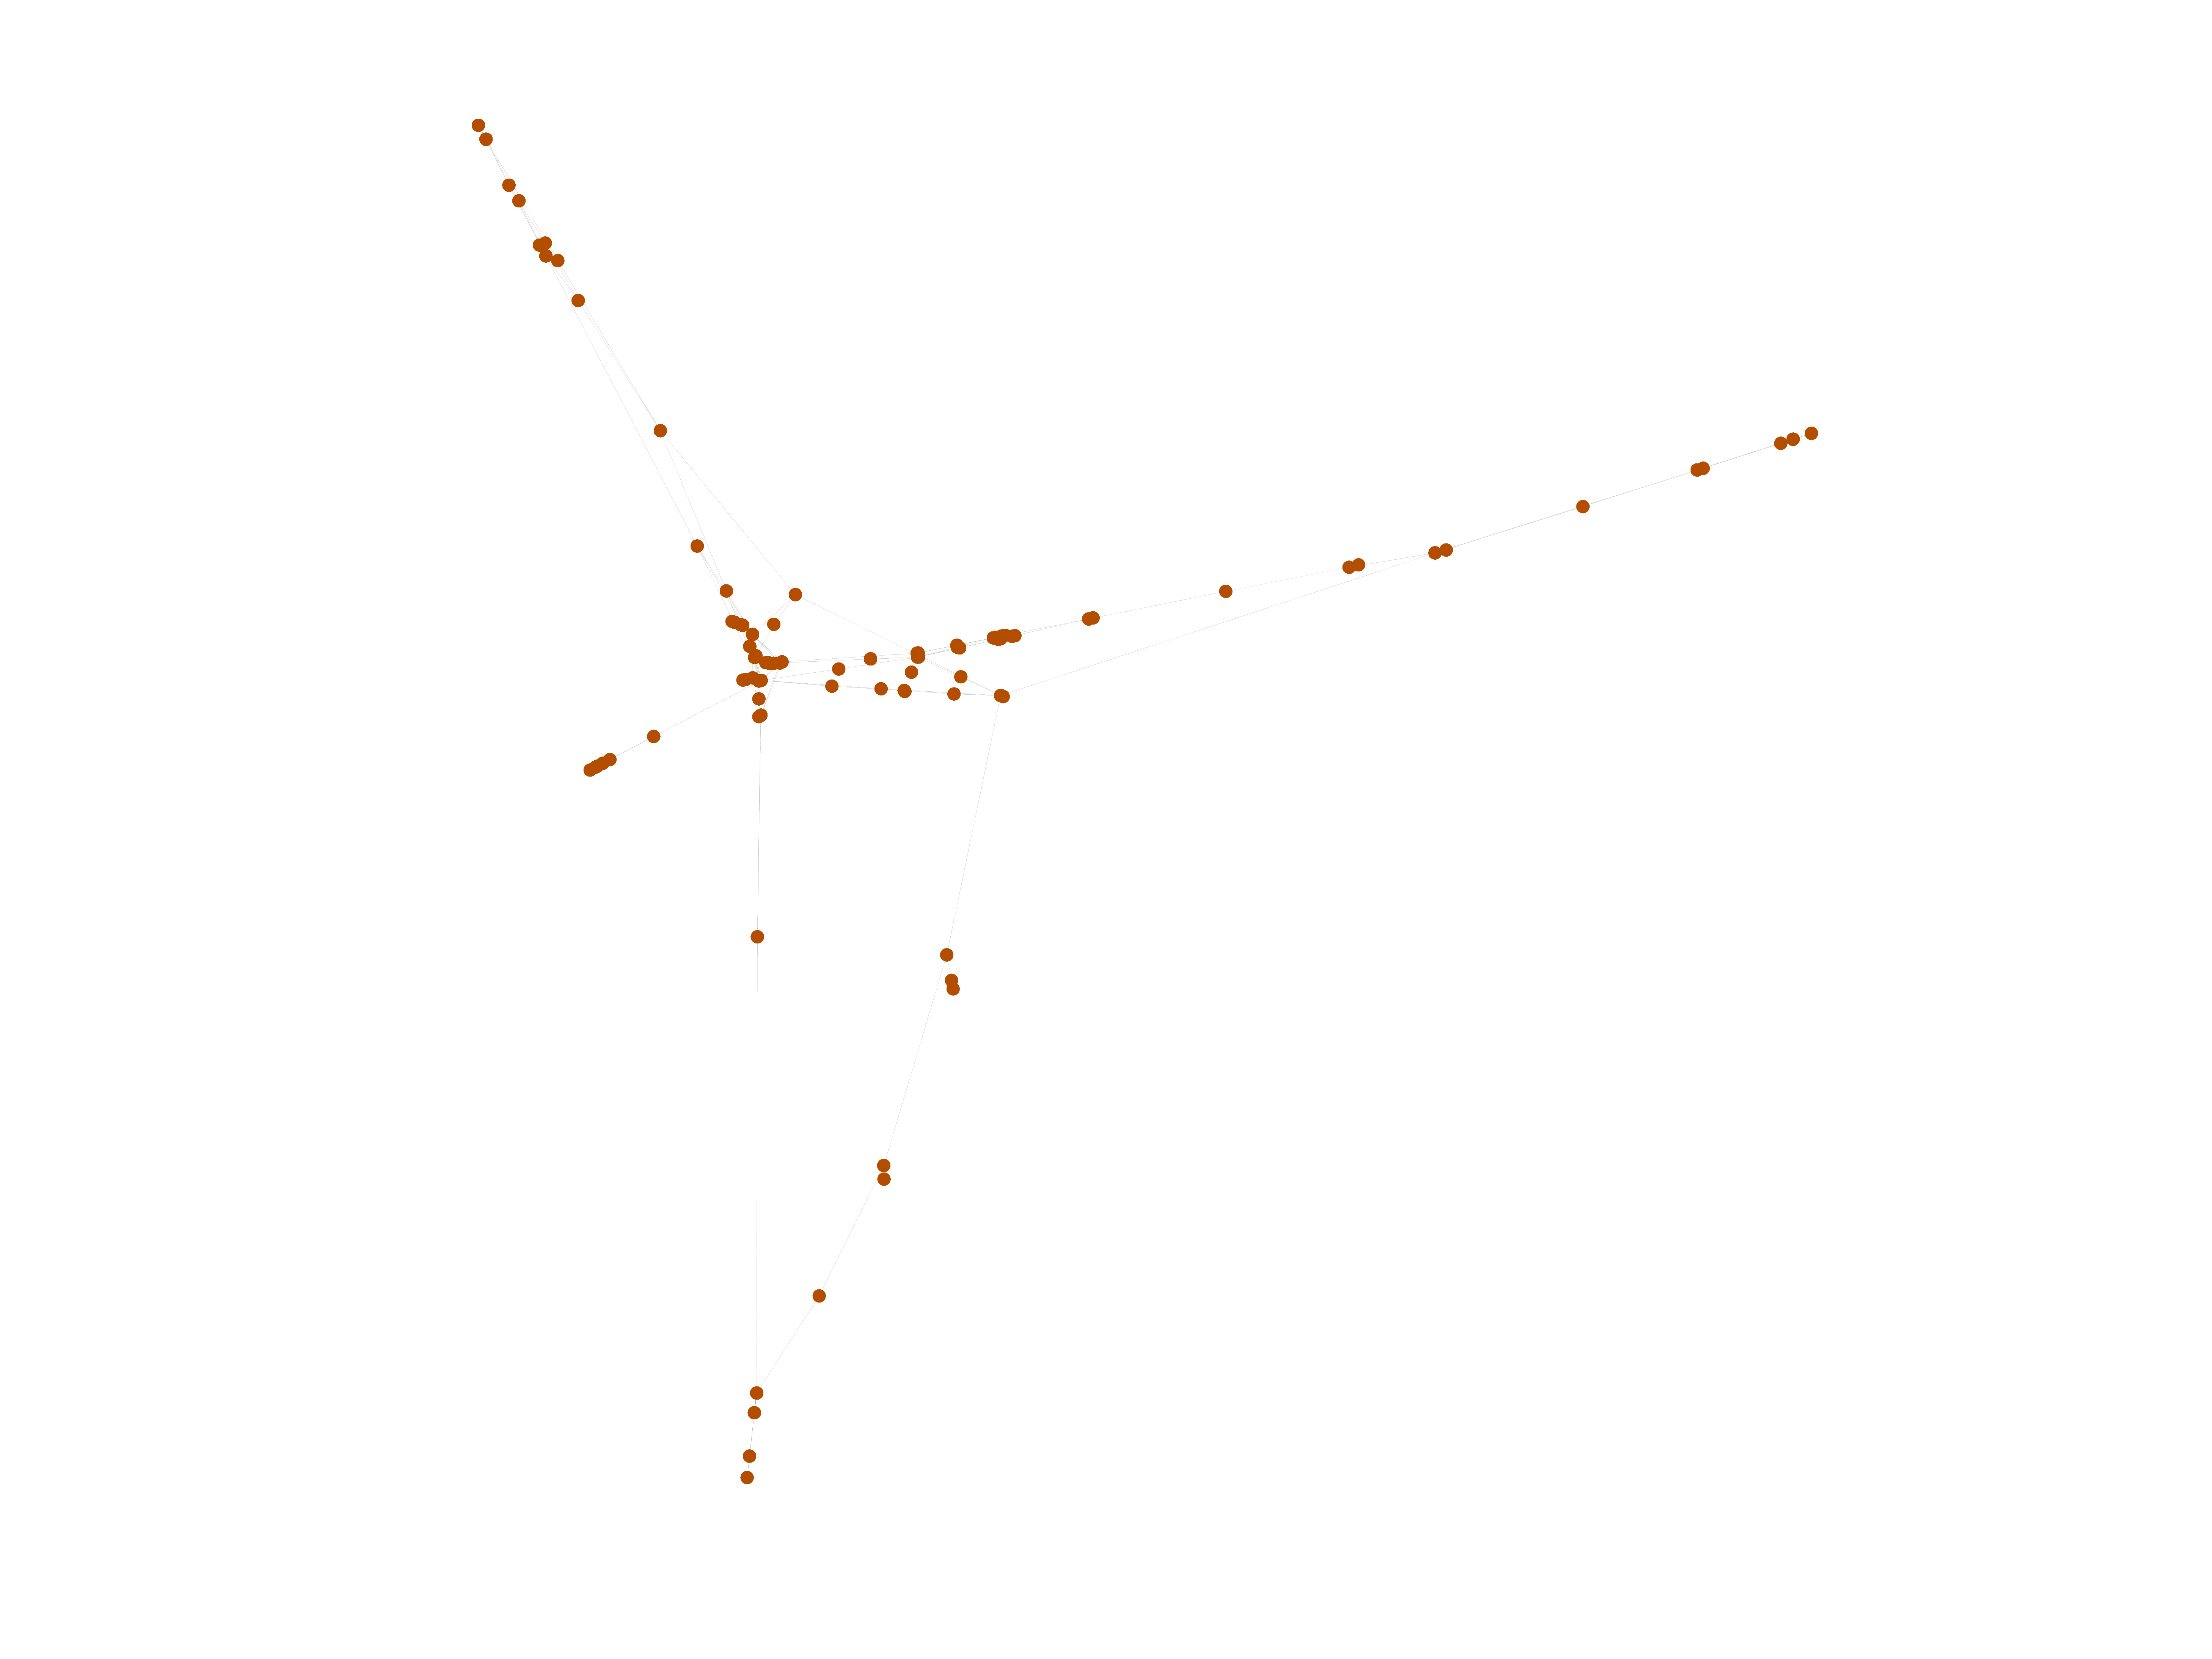
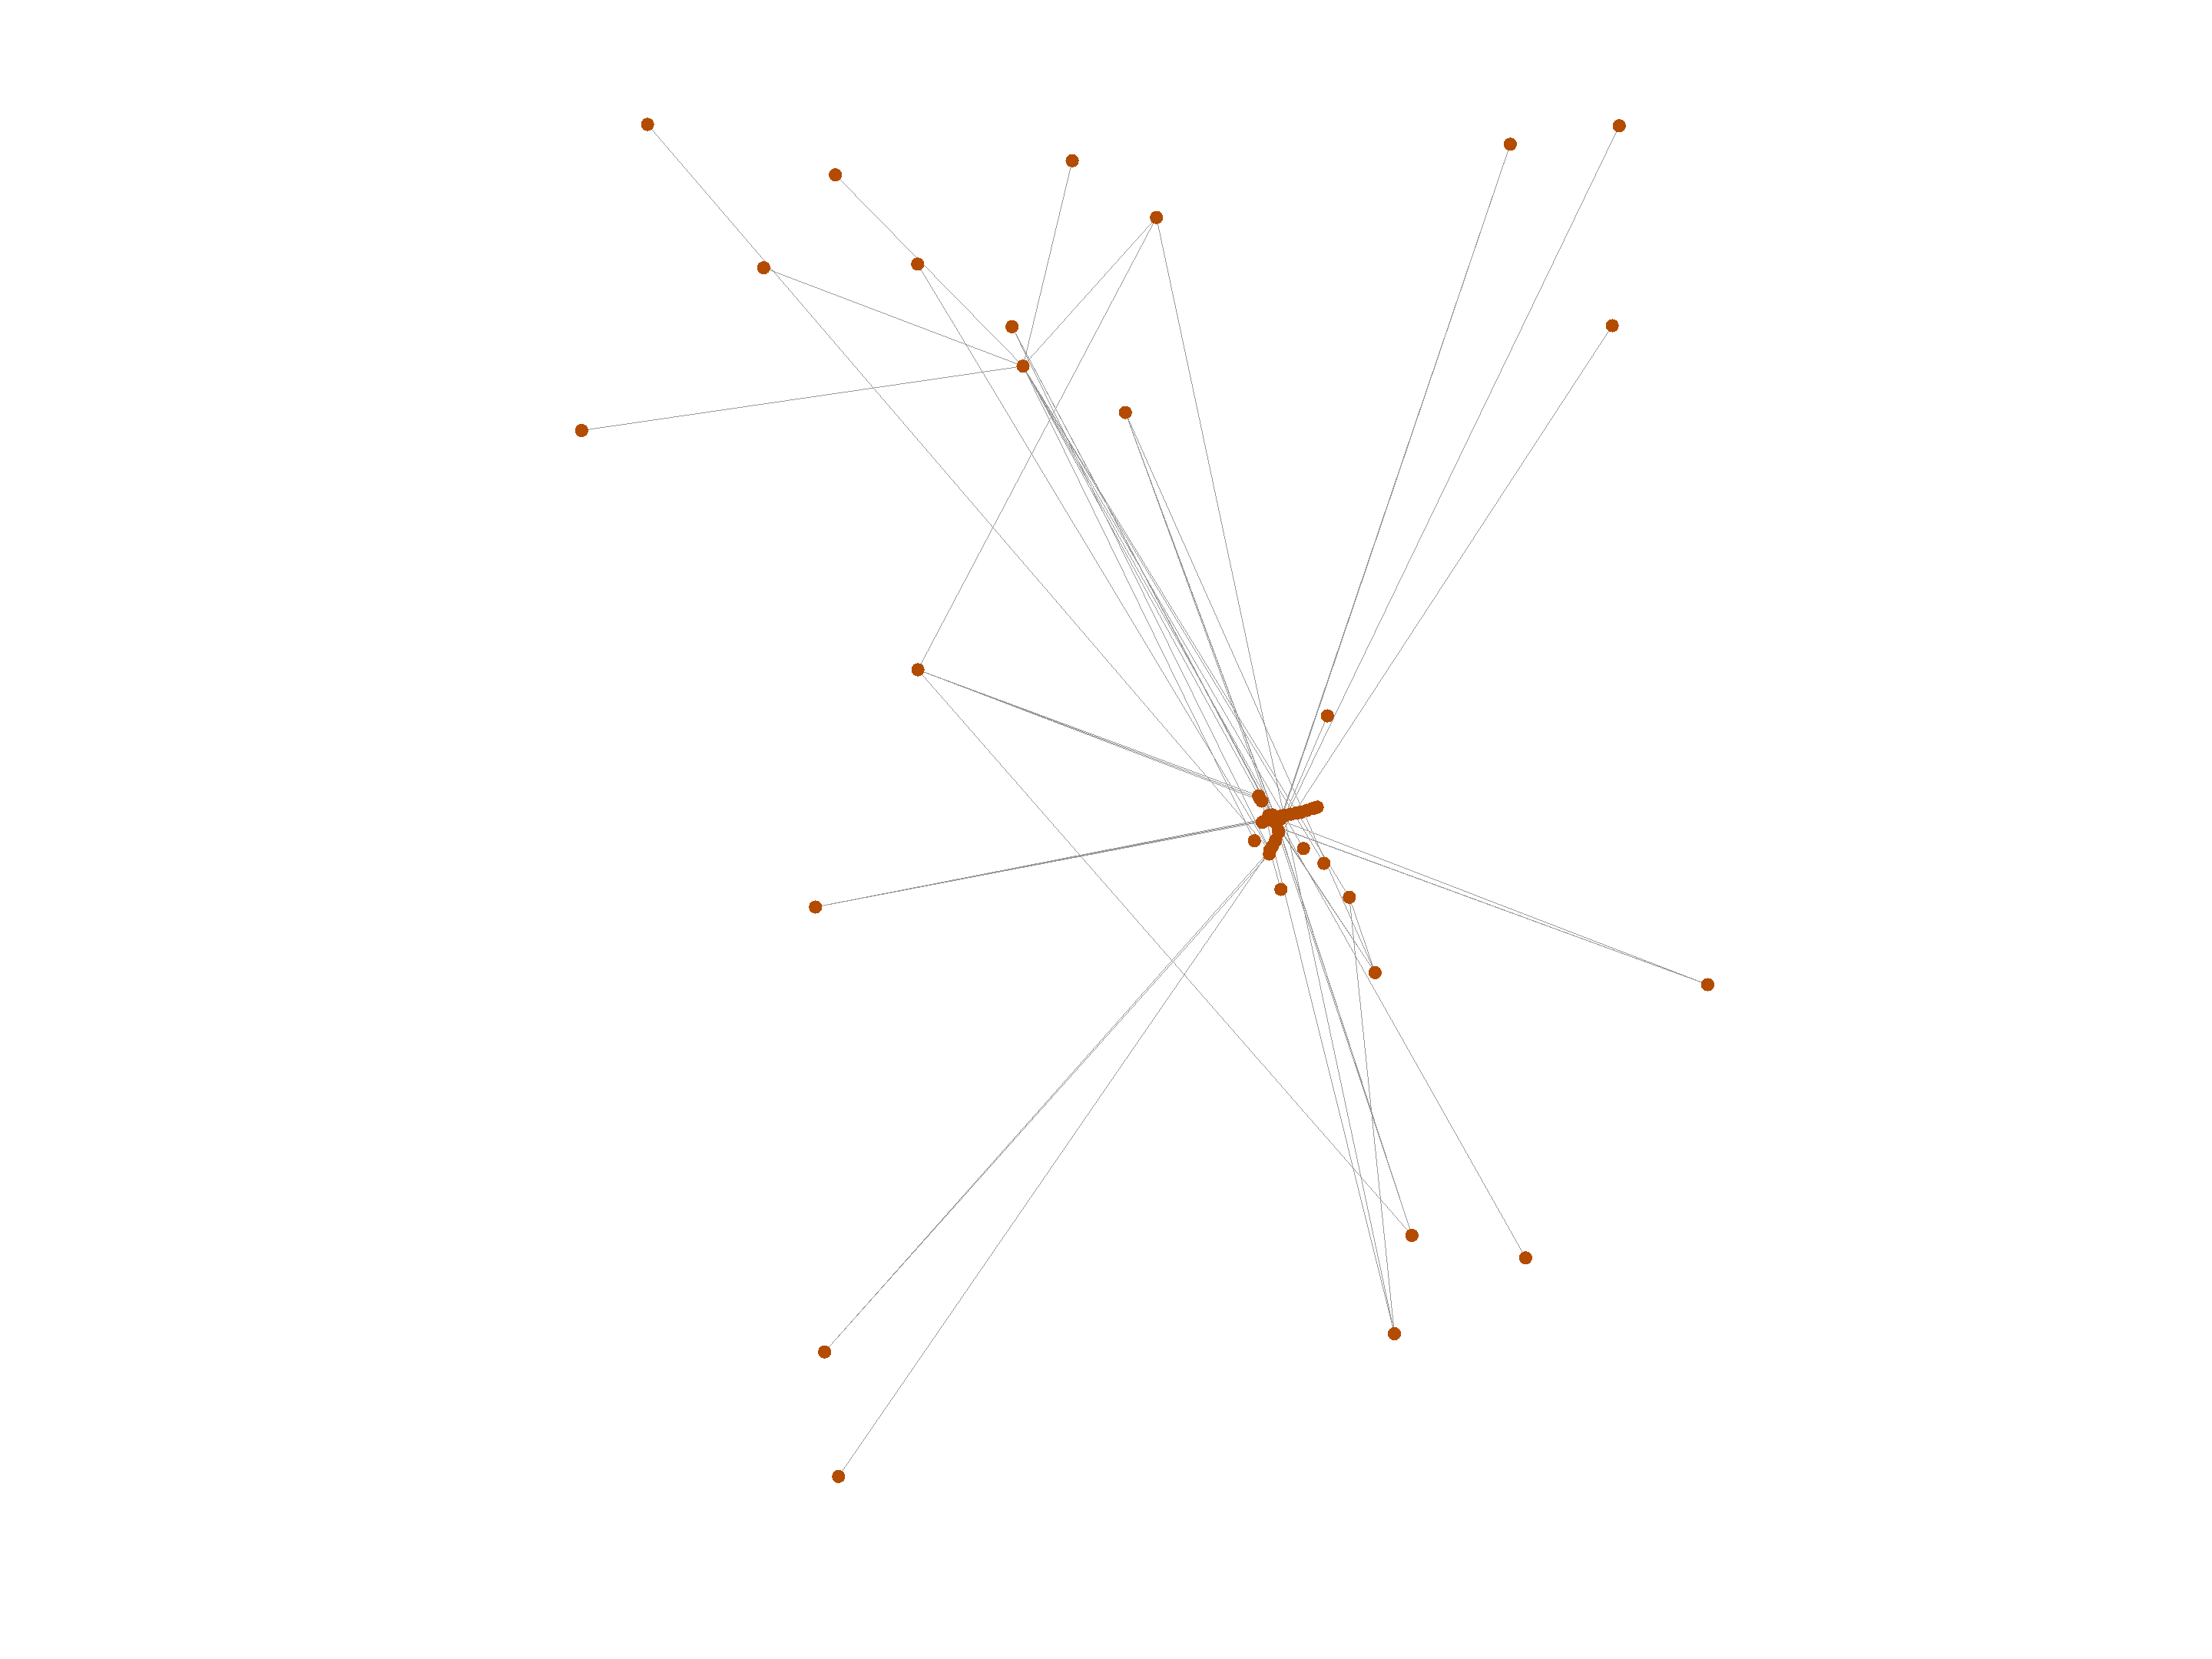
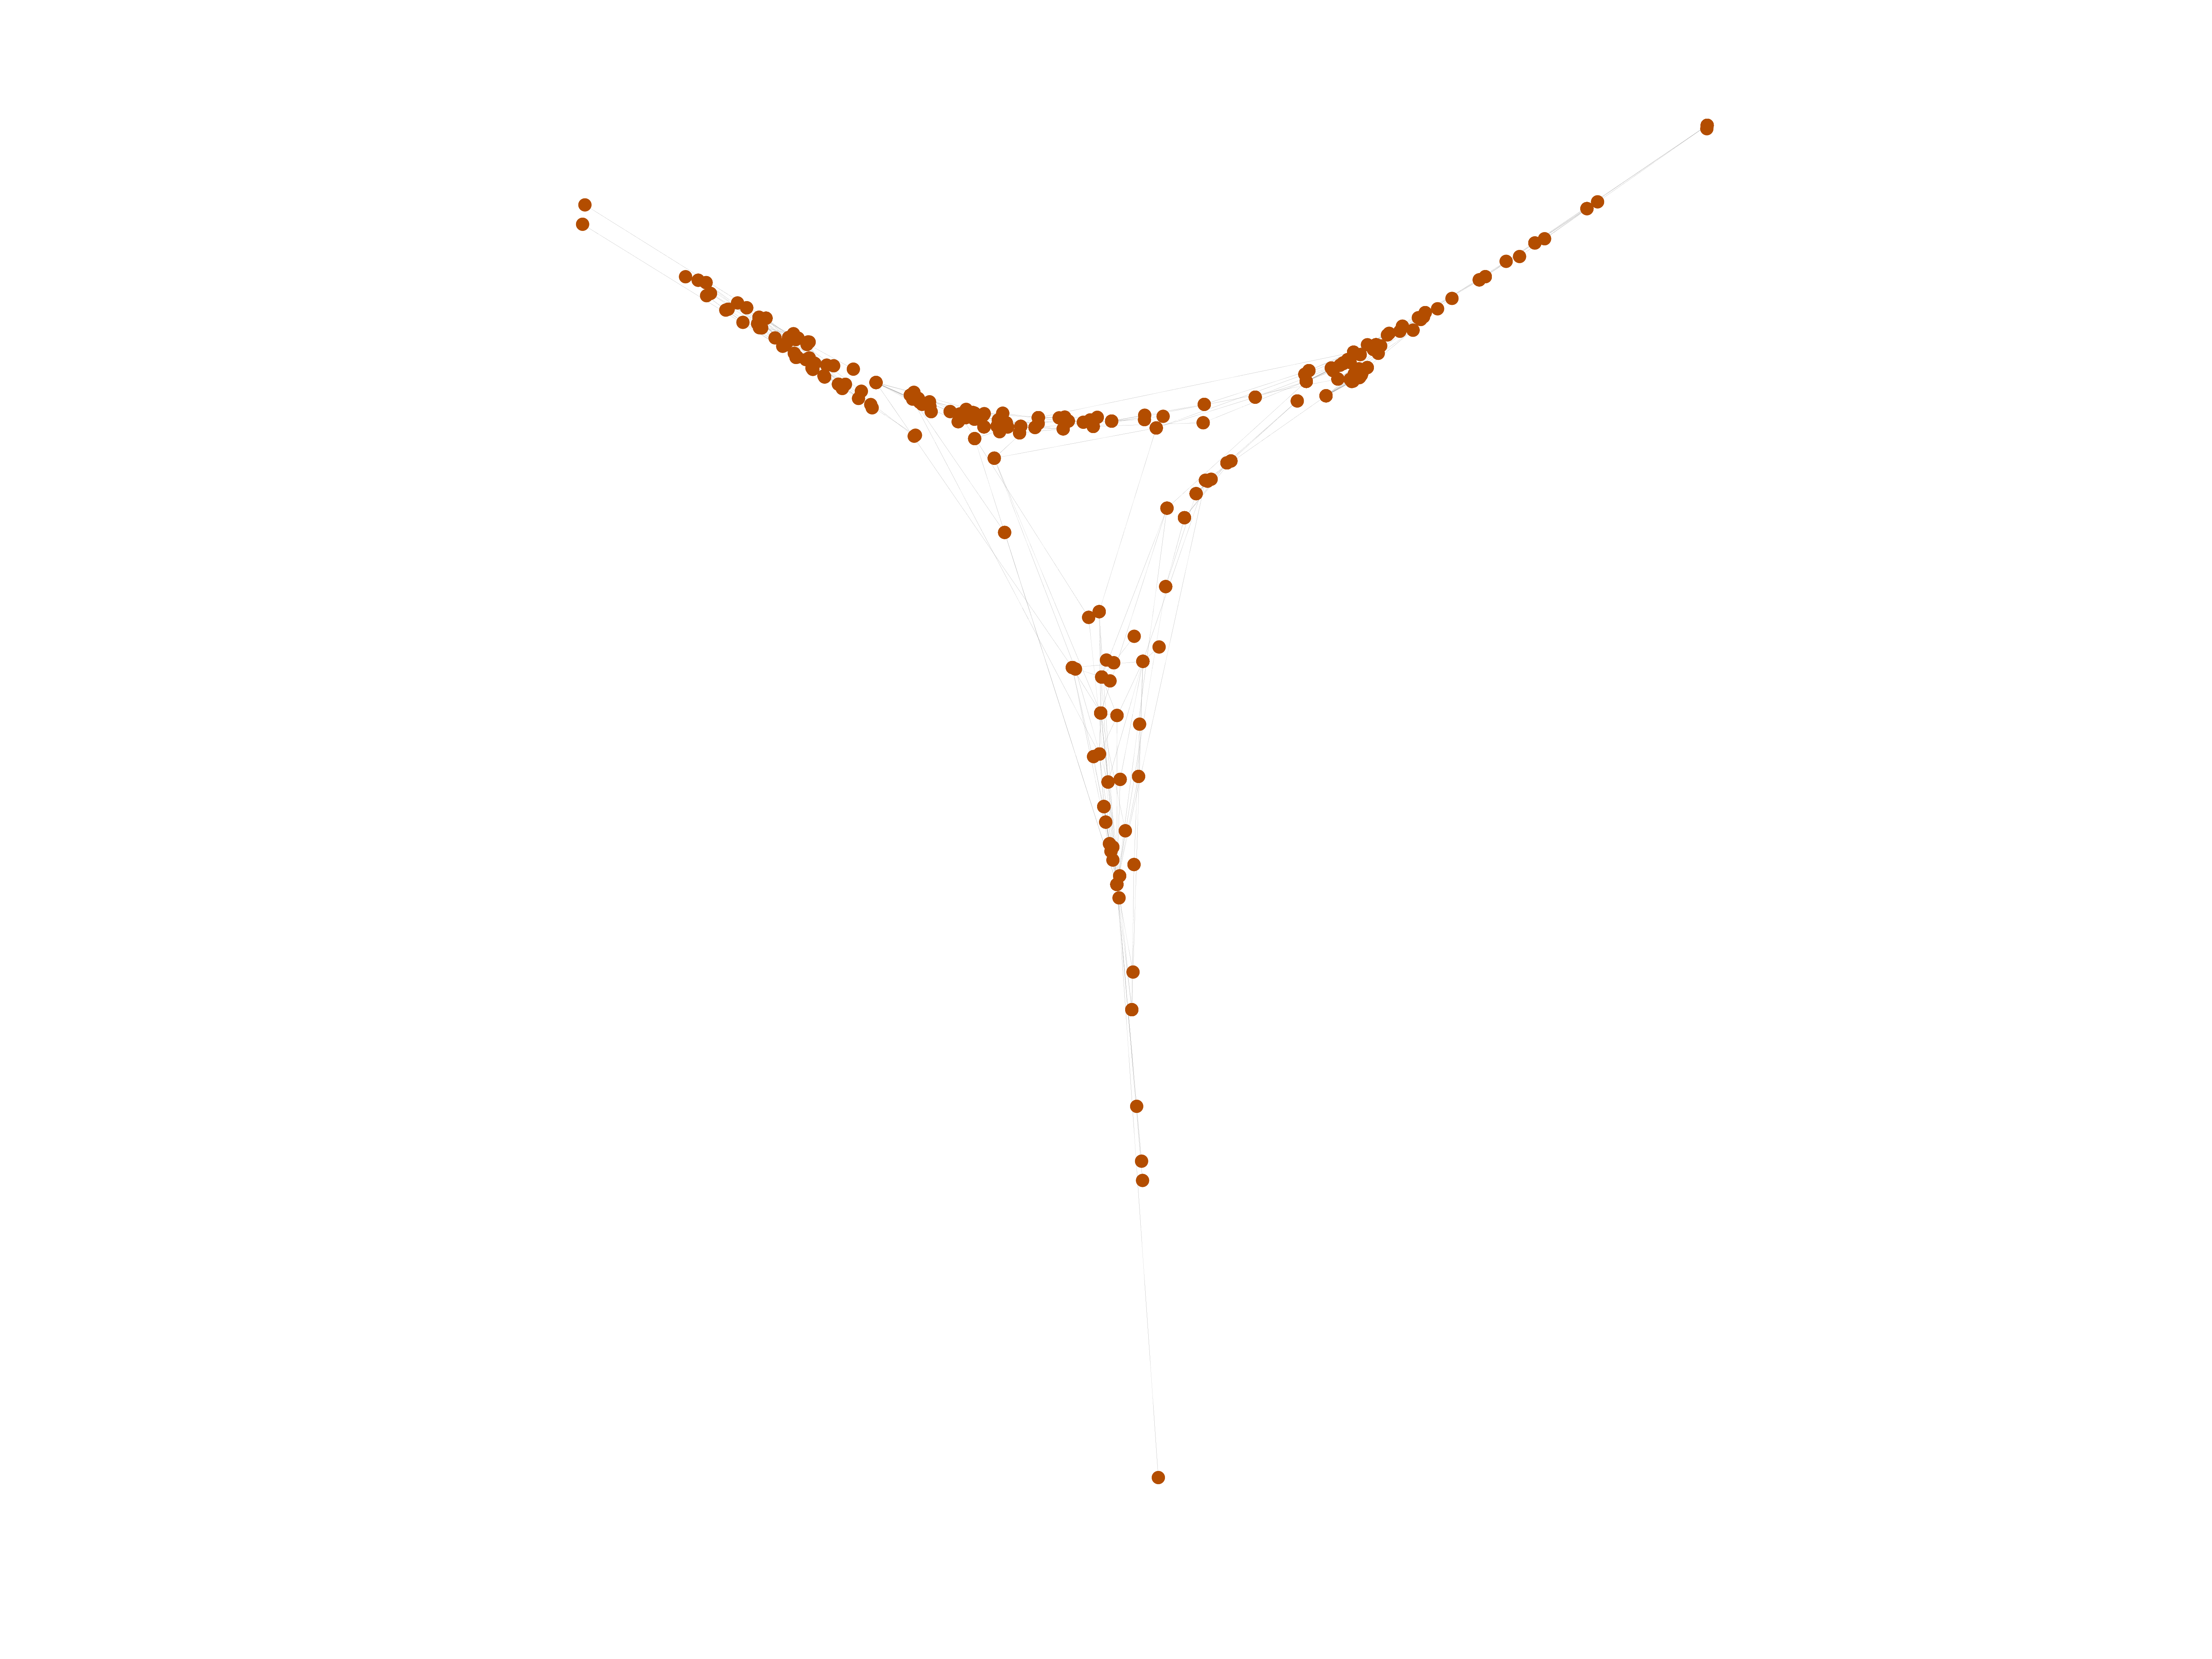
This is a network of protein–protein interactions from PDZBase.

Metadata

CodeMP
Internal namemaayan-pdzbase
NamePDZBase
Data sourcehttp://research.mssm.edu/maayan/datasets/qualitative_networks.shtml
AvailabilityDataset is available for download
Consistency checkDataset passed all tests
Category
Metabolic network
Node meaningProtein
Edge meaningInteraction
Network formatUnipartite, undirected
Edge typeUnweighted, no multiple edges
LoopsContains loops

Statistics

Size n =212
Volume m =244
Loop count l =2
Wedge count s =1,049
Claw count z =3,221
Cross count x =9,571
Triangle count t =1
Square count q =122
4-Tour count T4 =5,656
Maximum degree dmax =21
Average degree d =2.301 89
Fill p =0.010 807 0
Size of LCC N =161
Diameter δ =10
50-Percentile effective diameter δ0.5 =4.718 88
90-Percentile effective diameter δ0.9 =7.206 09
Median distance δM =5
Mean distance δm =5.114 56
Gini coefficient G =0.442 178
Balanced inequality ratio P =0.317 623
Relative edge distribution entropy Her =0.924 723
Power law exponent γ =3.006 86
Tail power law exponent γt =2.091 00
Tail power law exponent with p γ3 =2.091 00
p-value p =0.009 000 00
Degree assortativity ρ =−0.356 716
Degree assortativity p-value pρ =5.712 88 × 10−16
Clustering coefficient c =0.002 859 87
Spectral norm α =5.840 66
Algebraic connectivity a =0.045 973 0
Spectral separation 1[A] / λ2[A]| =1.000 15
Non-bipartivity bA =0.000 152 507
Normalized non-bipartivity bN =0.002 569 68
Algebraic non-bipartivity χ =0.006 661 35
Spectral bipartite frustration bK =0.000 641 433
Controllability C =100
Relative controllability Cr =0.471 698

Plots

Fruchterman–Reingold graph drawing

Degree distribution

Cumulative degree distribution

Lorenz curve

Spectral distribution of the adjacency matrix

Spectral distribution of the normalized adjacency matrix

Spectral distribution of the Laplacian

Spectral graph drawing based on the adjacency matrix

Spectral graph drawing based on the Laplacian

Spectral graph drawing based on the normalized adjacency matrix

Degree assortativity

Zipf plot

Hop distribution

Double Laplacian graph drawing

Delaunay graph drawing

Clustering coefficient distribution

Average neighbor degree distribution

SynGraphy

Matrix decompositions plots

Downloads

References

[1] Jérôme Kunegis. KONECT – The Koblenz Network Collection. In Proc. Int. Conf. on World Wide Web Companion, pages 1343–1350, 2013. [ http ]
[2] Thijs Beuming, Lucy Skrabanek, Masha Y. Niv, Piali Mukherjee, and Harel Weinstein. PDZBase: A protein–protein interaction database for PDZ-domains. Bioinformatics, 21(6):827–828, 2005.