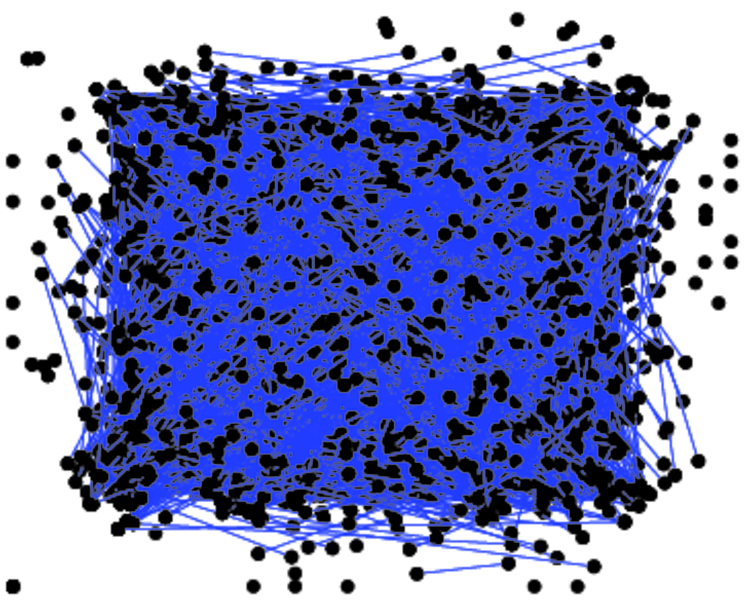
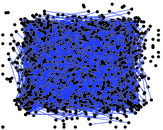
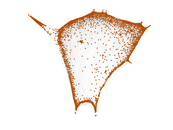
Human proteins (Vidal)
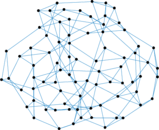
This network represens an initial version of a proteome-scale map of Human
binary protein–protein interactions
Metadata
Statistics
| Size | n = | 3,133
|
| Volume | m = | 6,726
|
| Loop count | l = | 577
|
| Wedge count | s = | 88,809
|
| Claw count | z = | 1,399,841
|
| Cross count | x = | 27,308,384
|
| Triangle count | t = | 1,047
|
| Square count | q = | 10,216
|
| 4-Tour count | T4 = | 449,262
|
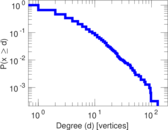
| Maximum degree | dmax = | 129
|
| Average degree | d = | 4.293 65
|
| Fill | p = | 0.001 370 02
|
| Size of LCC | N = | 2,783
|
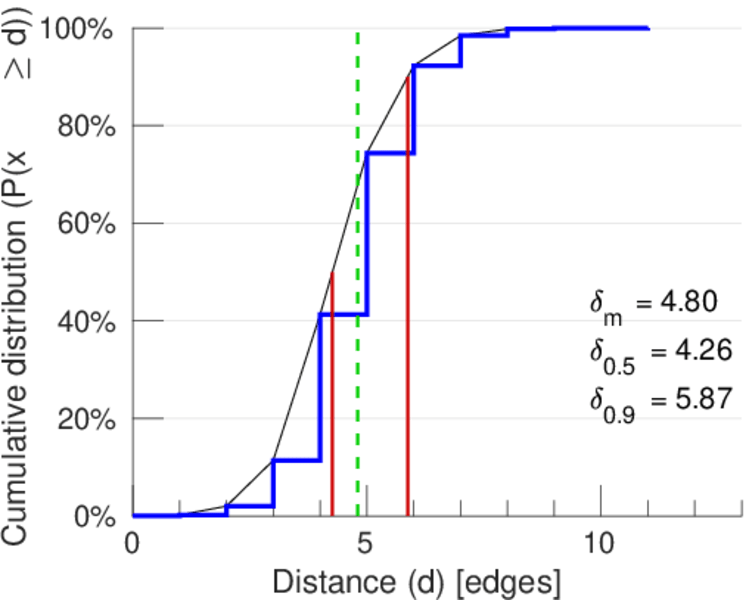
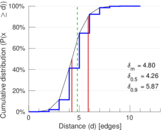
| Diameter | δ = | 13
|
| 50-Percentile effective diameter | δ0.5 = | 4.264 35
|
| 90-Percentile effective diameter | δ0.9 = | 5.872 22
|
| Median distance | δM = | 5
|
| Mean distance | δm = | 4.803 13
|
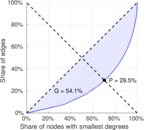
| Gini coefficient | G = | 0.540 534
|
| Balanced inequality ratio | P = | 0.294 826
|
| Relative edge distribution entropy | Her = | 0.926 225
|
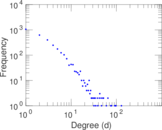
| Power law exponent | γ = | 2.114 32
|
| Tail power law exponent | γt = | 3.031 00
|
| Tail power law exponent with p | γ3 = | 3.031 00
|
| p-value | p = | 0.882 000
|
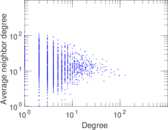
| Degree assortativity | ρ = | −0.125 658
|
| Degree assortativity p-value | pρ = | 1.817 28 × 10−44
|
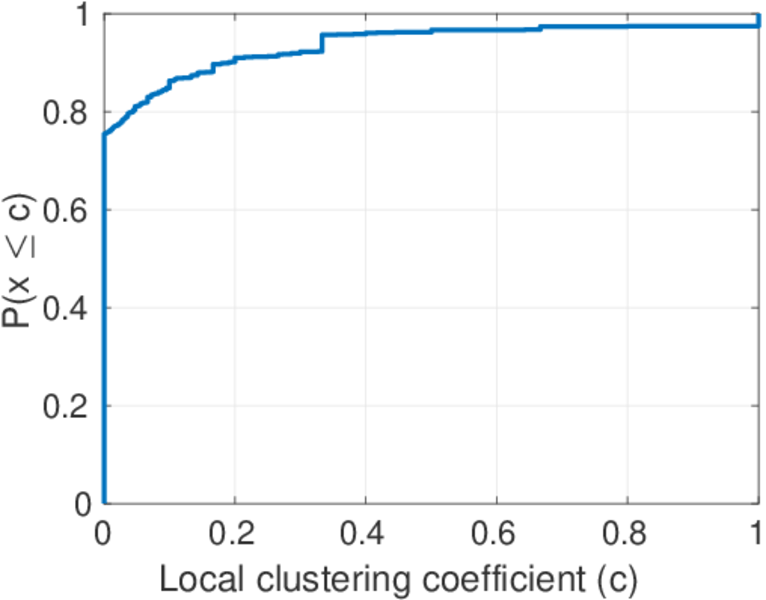
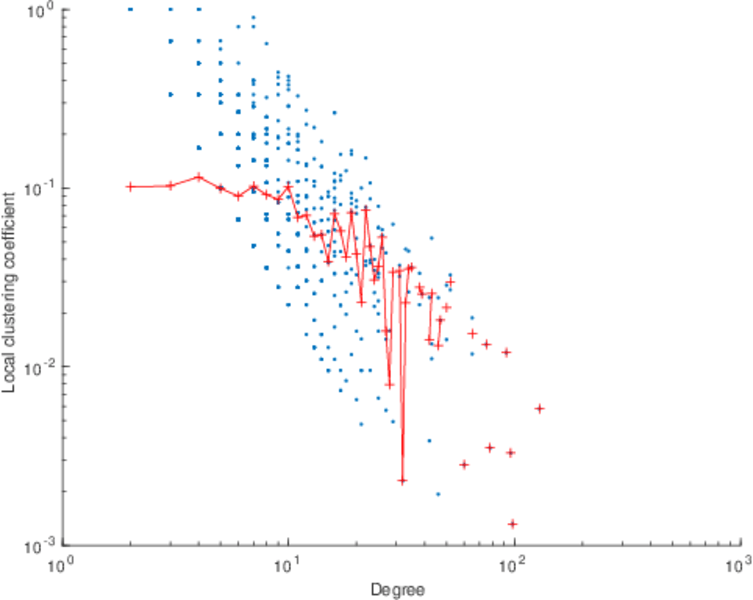
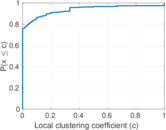
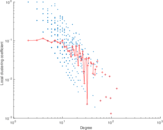
| Clustering coefficient | c = | 0.035 368 0
|
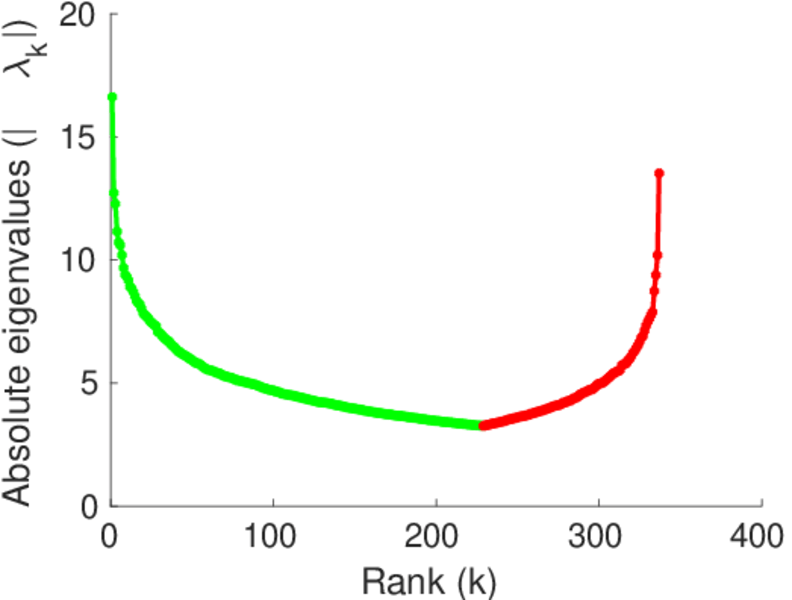
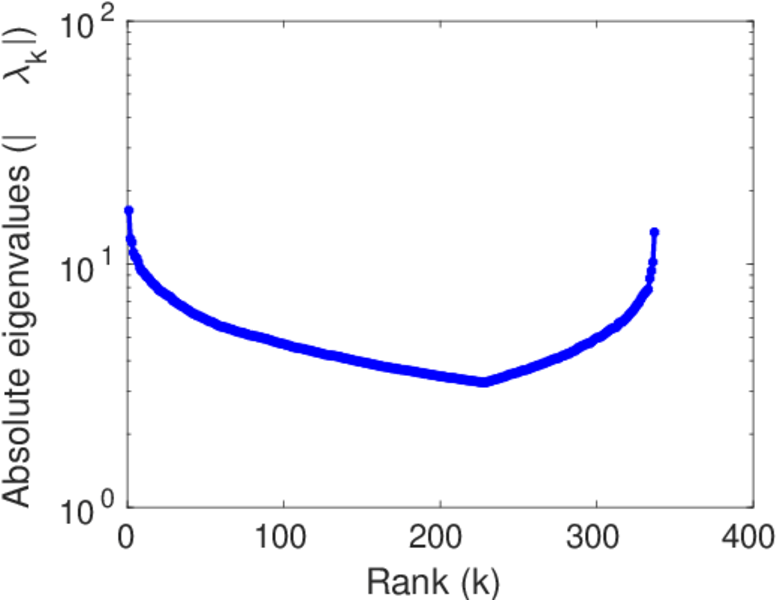
| Spectral norm | α = | 16.614 4
|
| Algebraic connectivity | a = | 0.069 808 5
|
| Spectral separation | |λ1[A] / λ2[A]| = | 1.229 05
|
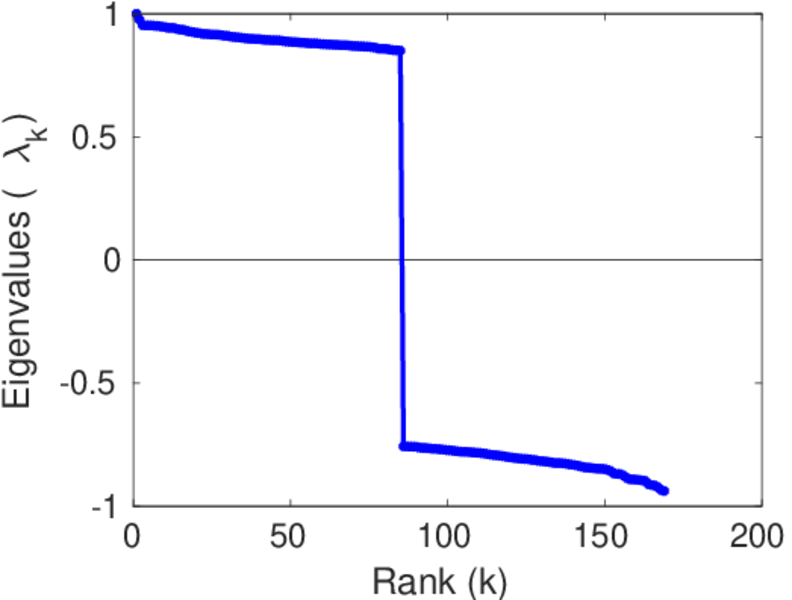
| Non-bipartivity | bA = | 0.186 364
|
| Normalized non-bipartivity | bN = | 0.060 887 7
|
| Algebraic non-bipartivity | χ = | 0.107 163
|
| Spectral bipartite frustration | bK = | 0.005 790 50
|
| Controllability | C = | 820
|
| Relative controllability | Cr = | 0.261 730
|
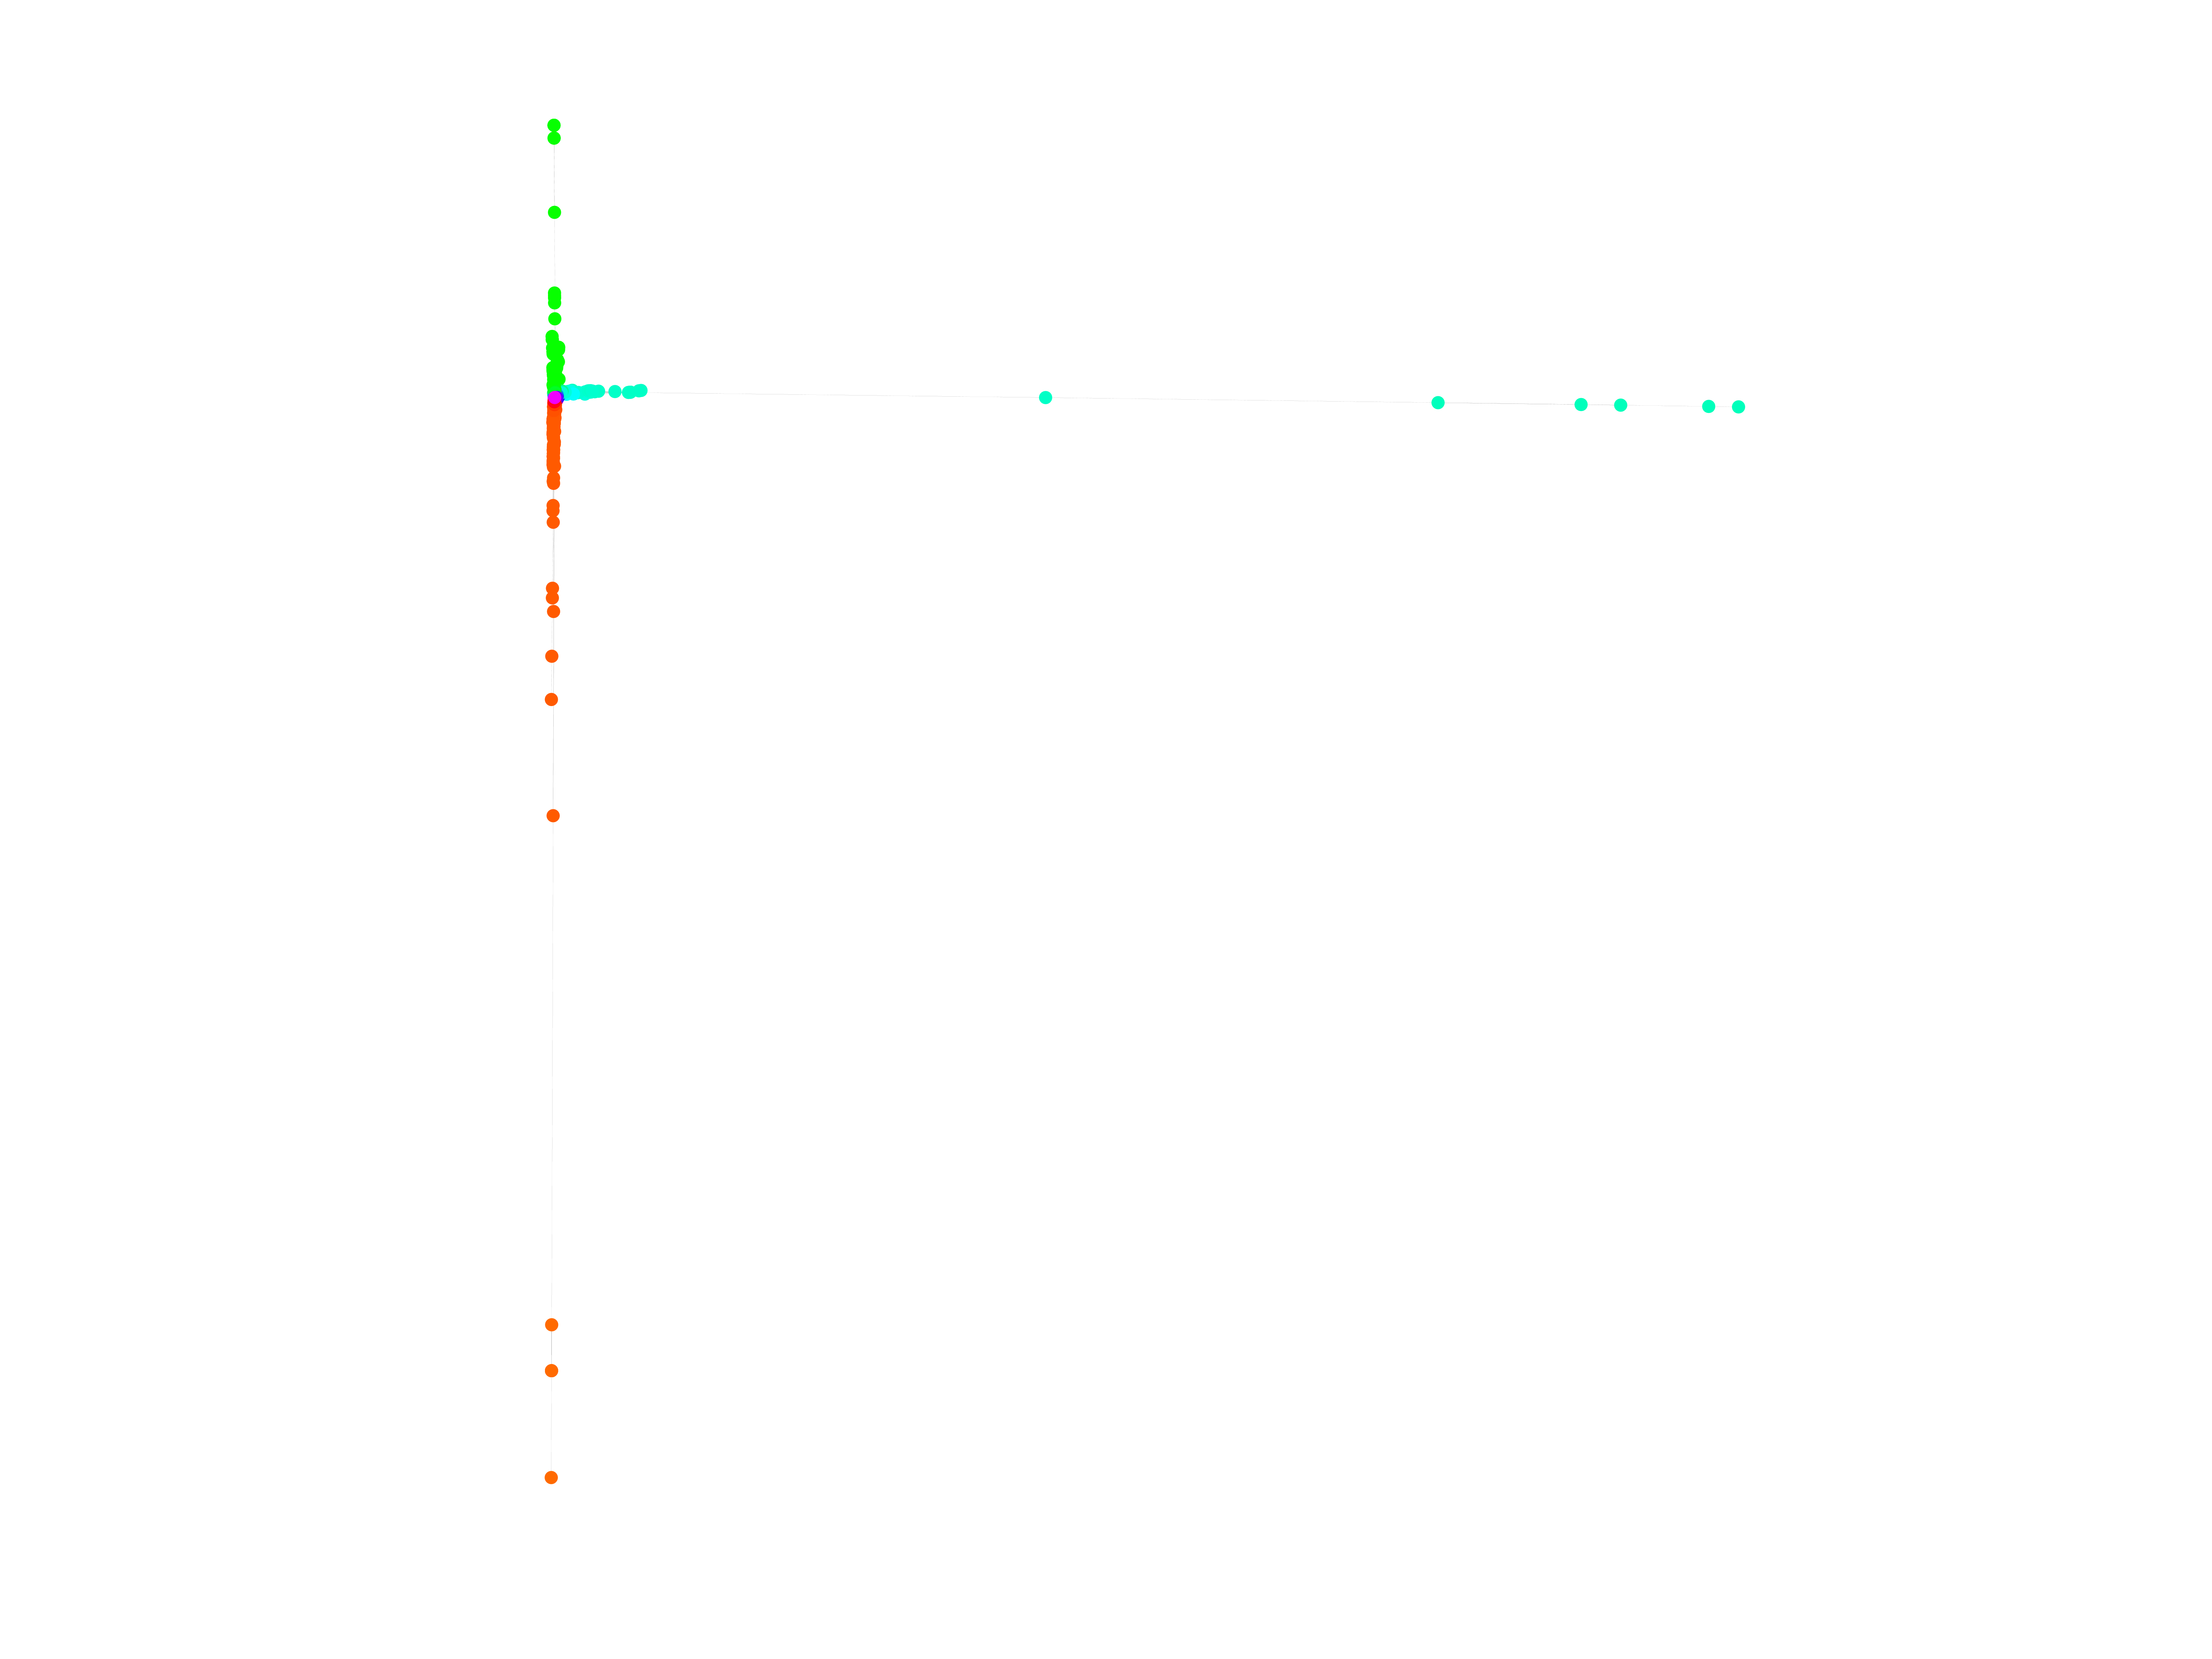
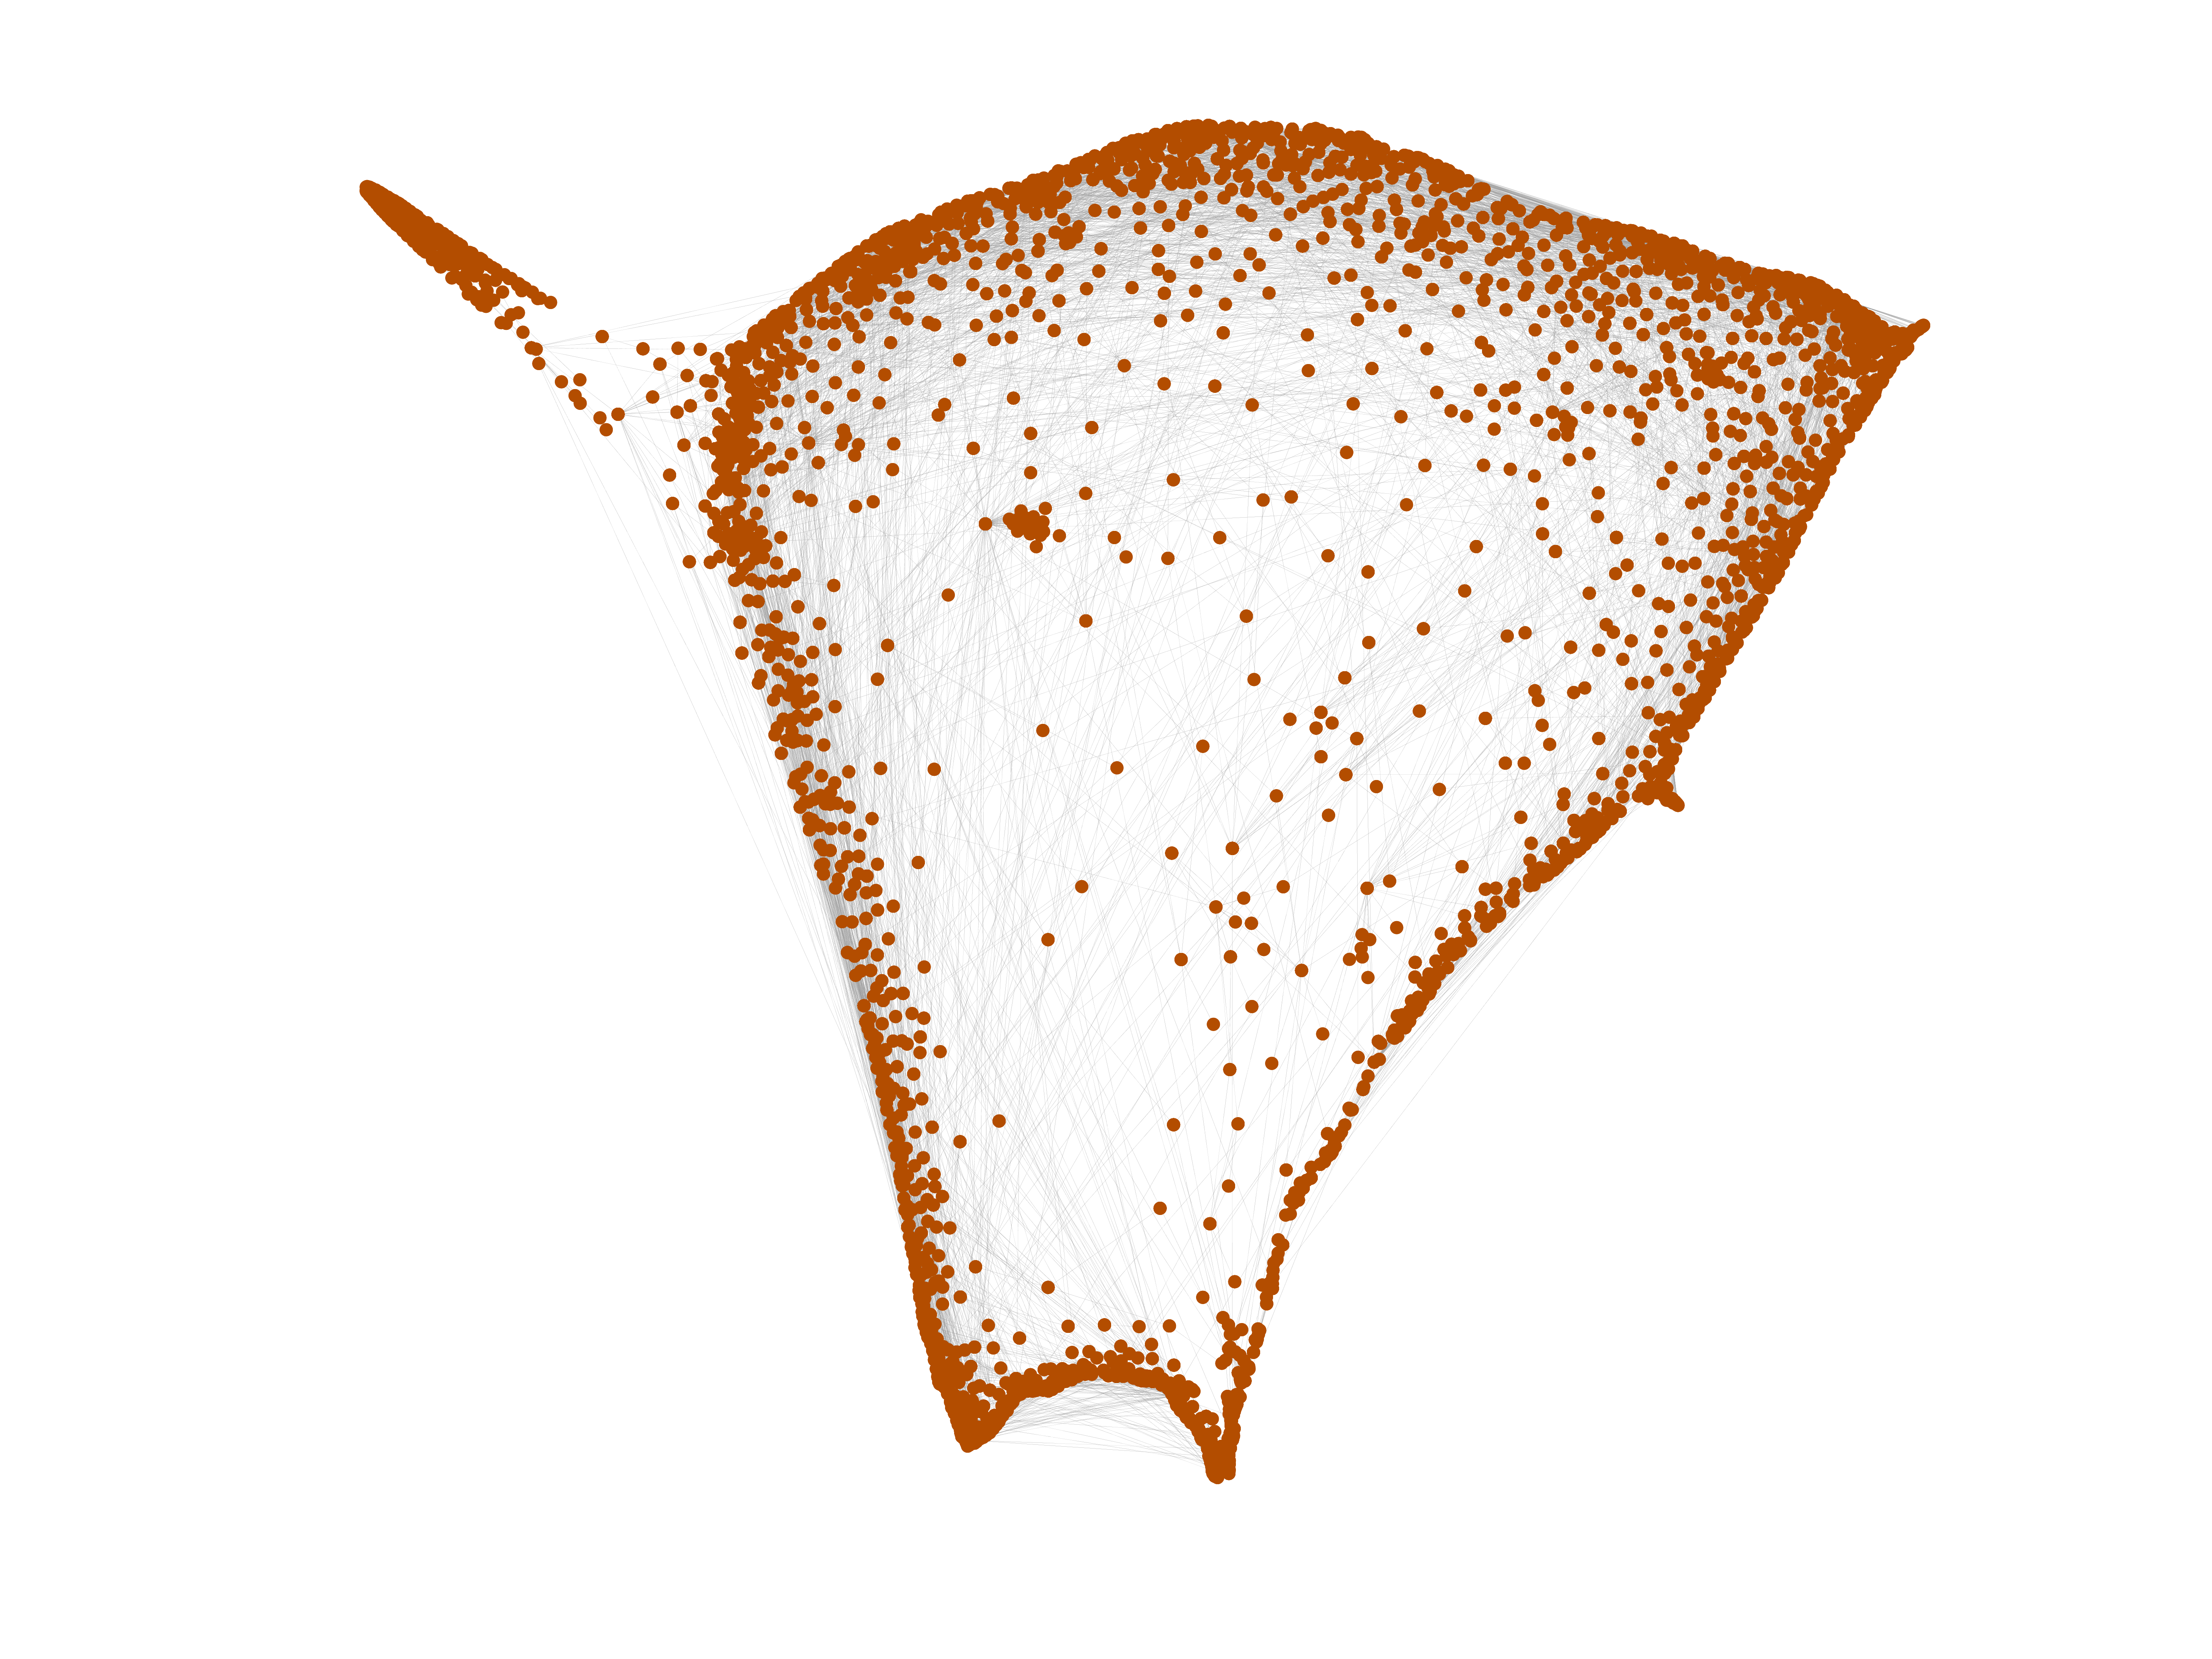
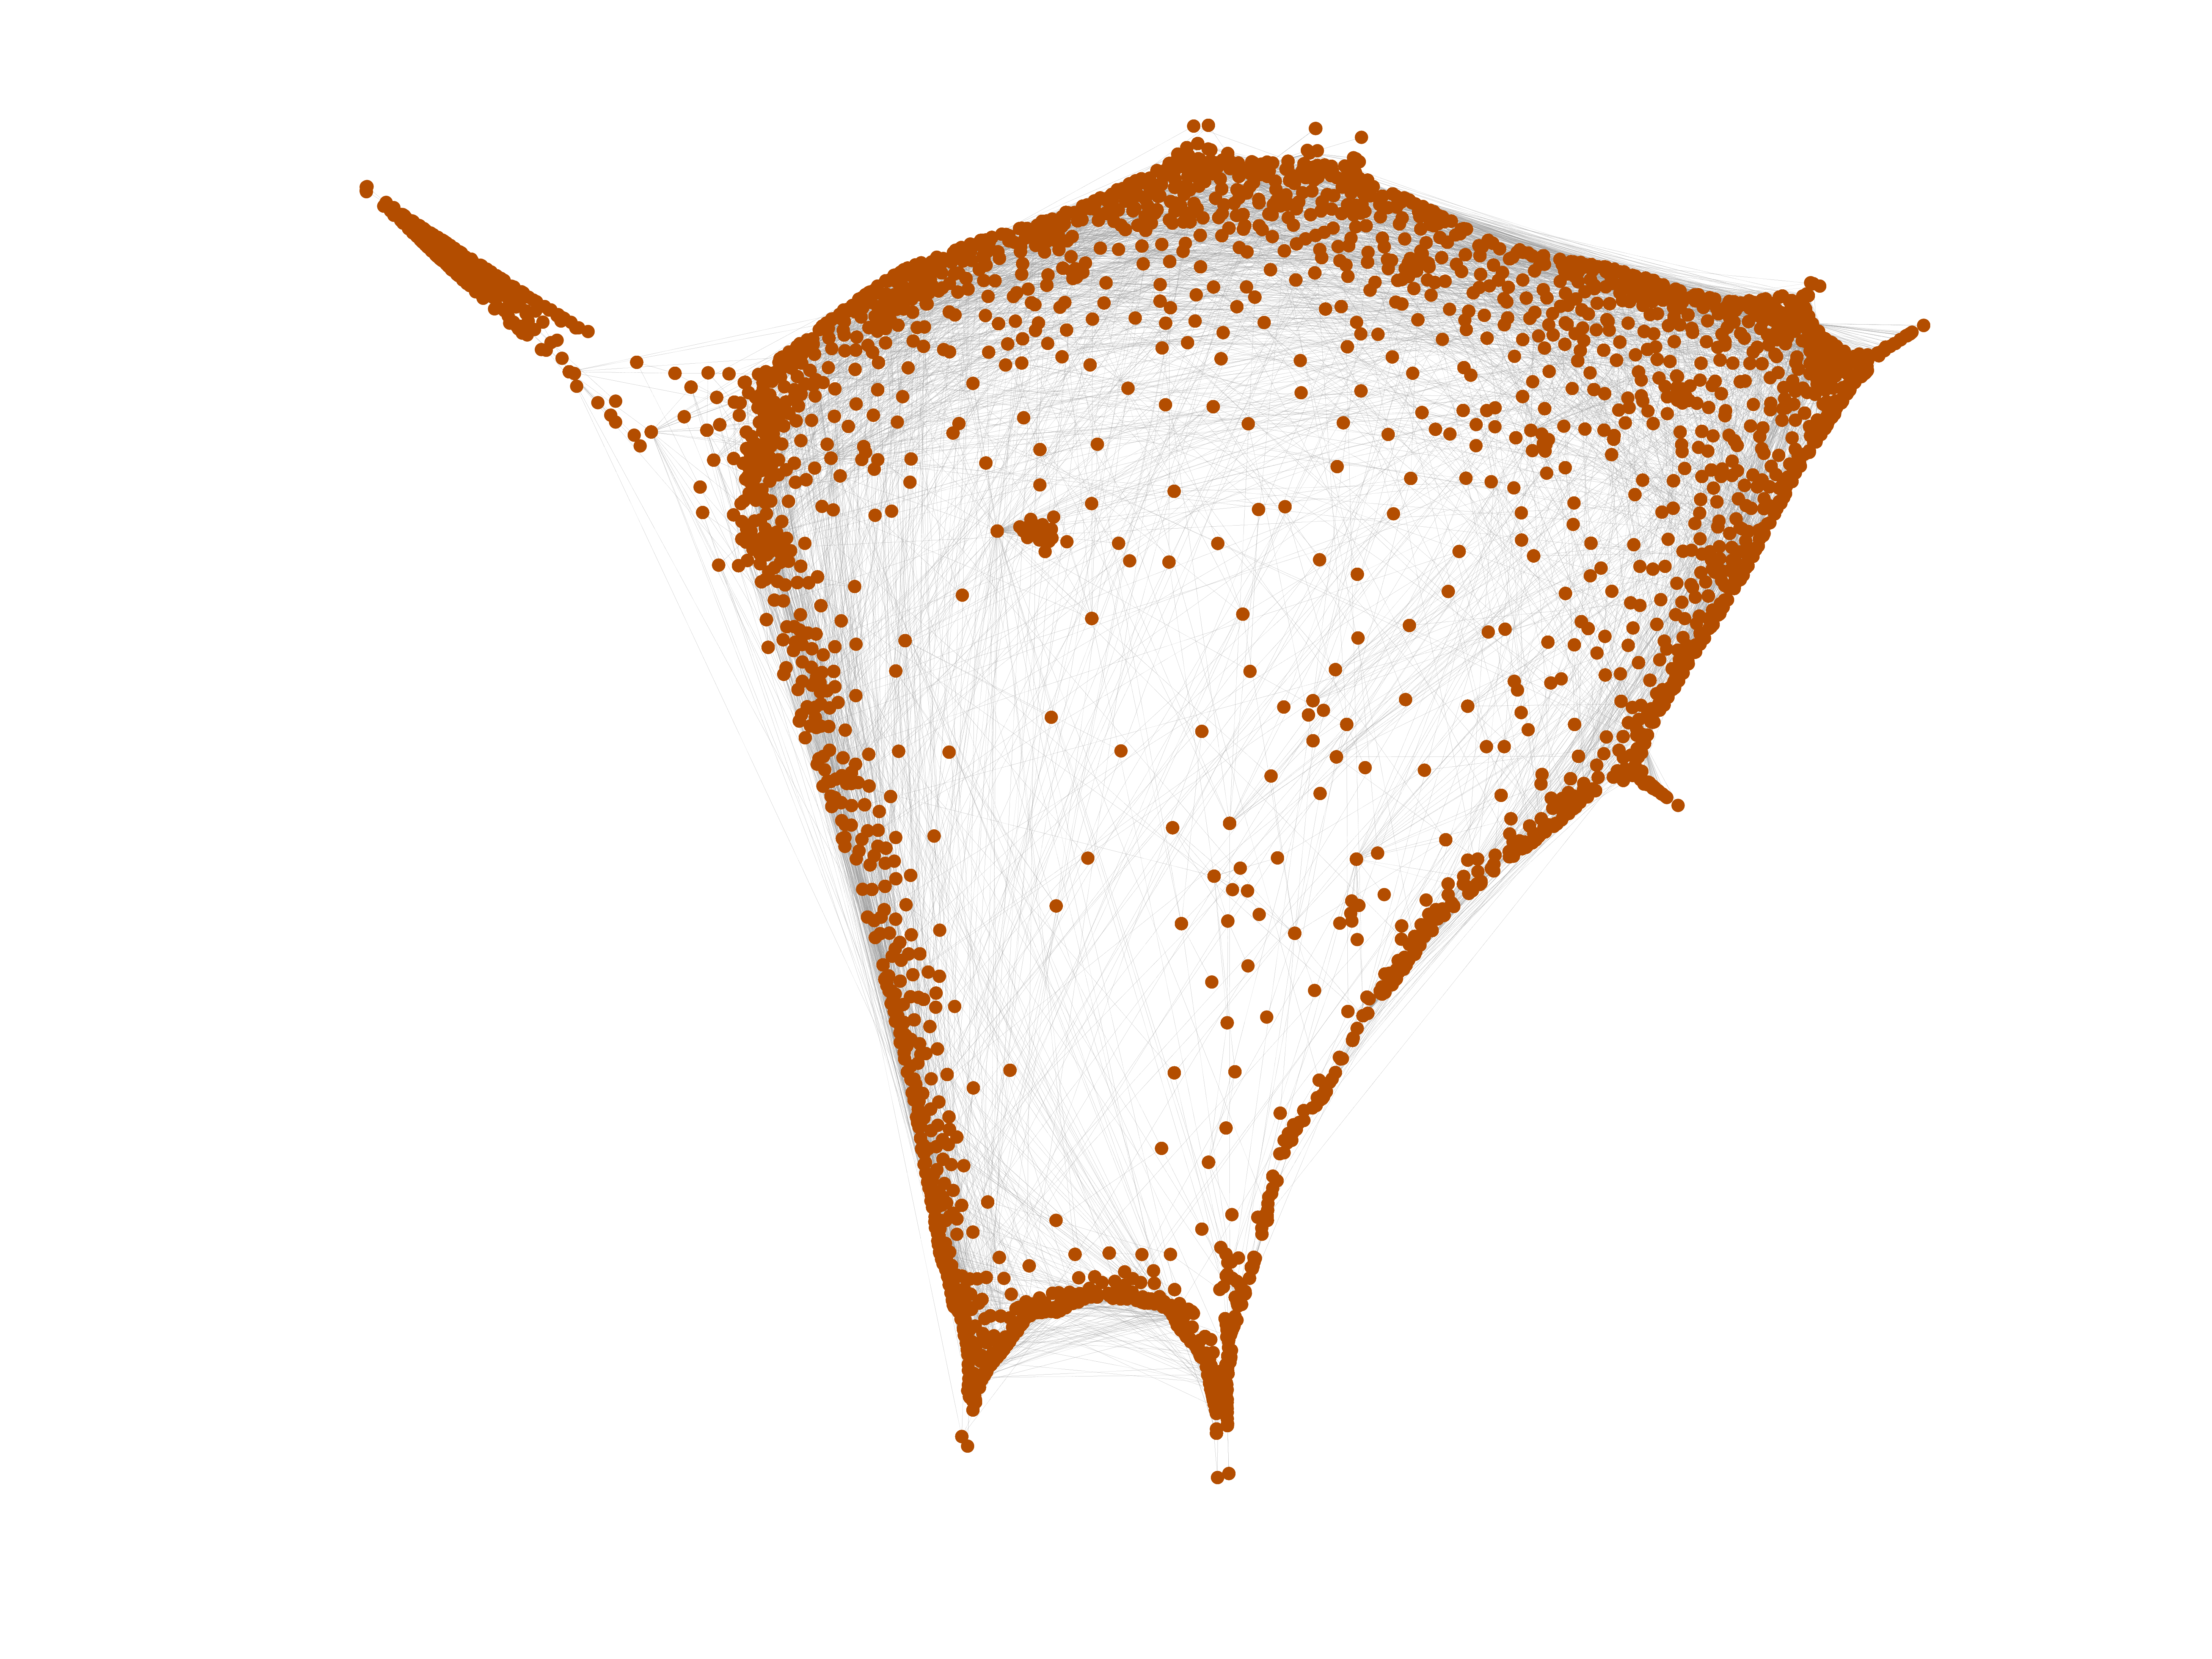
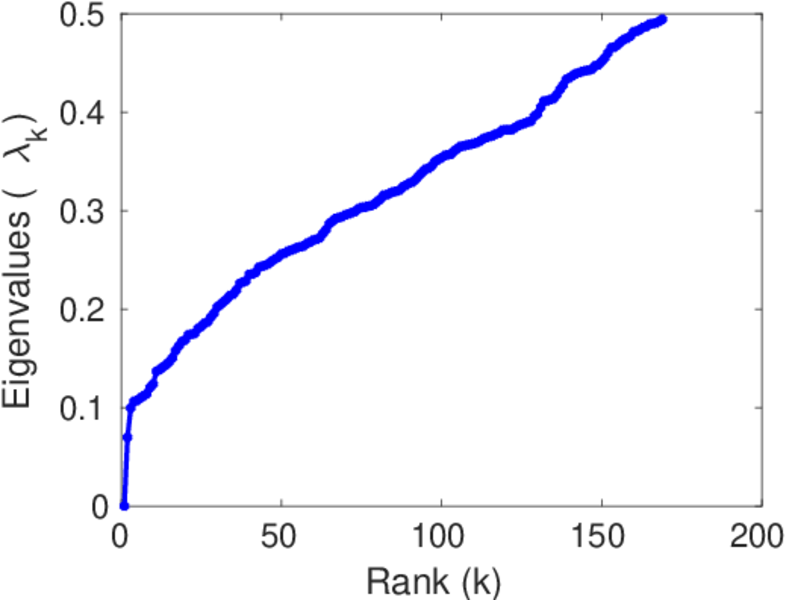
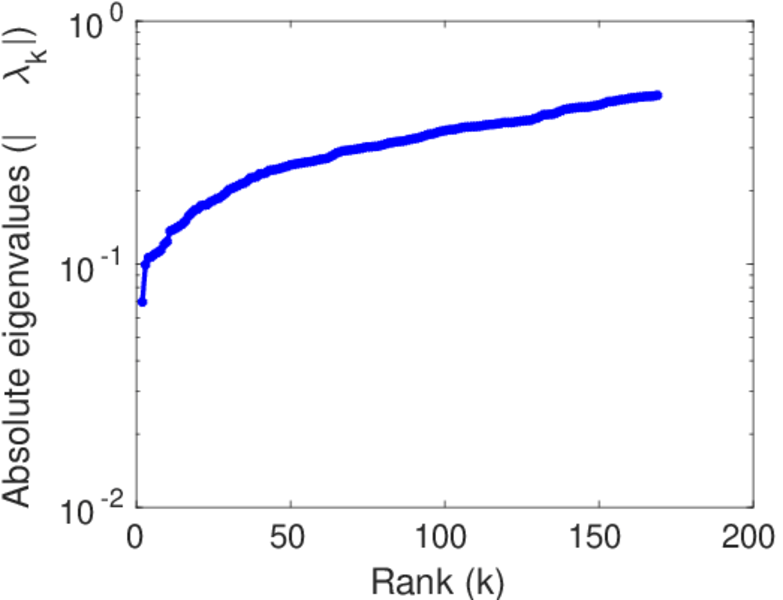
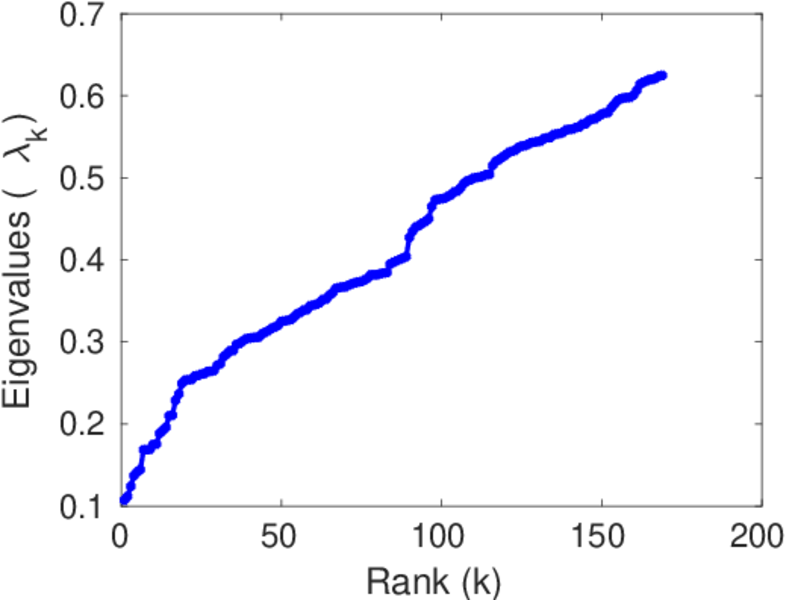
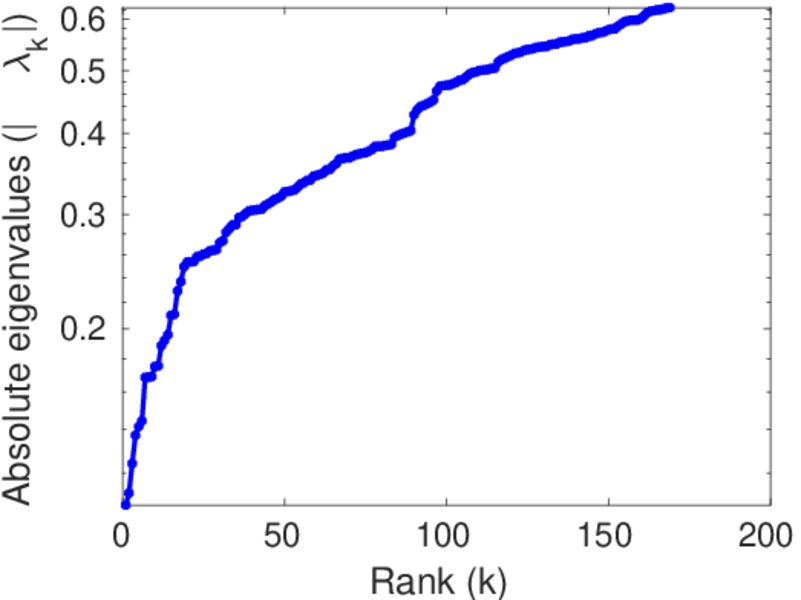
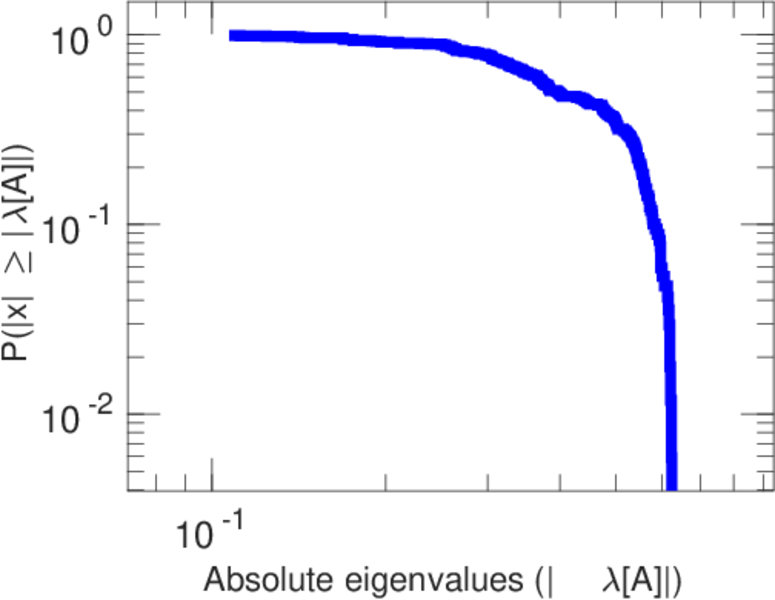
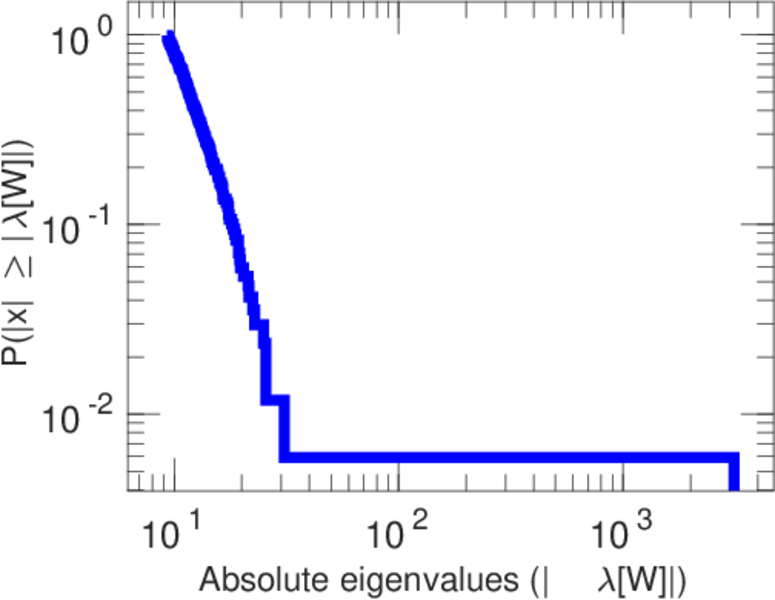
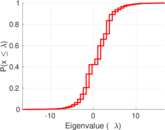
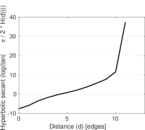
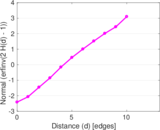
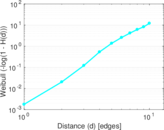
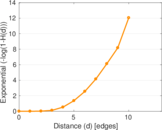
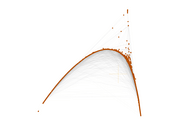
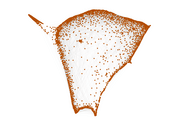
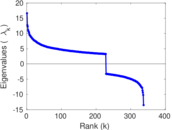
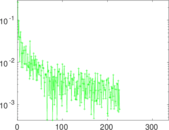
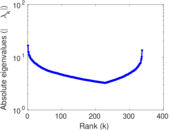
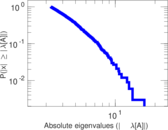
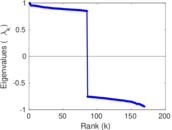
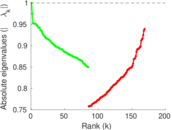
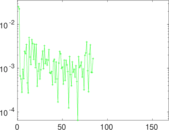
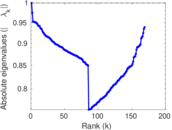
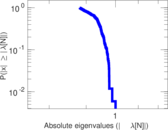
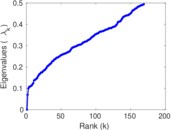
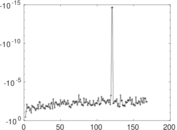
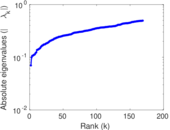
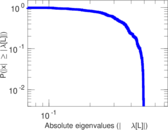
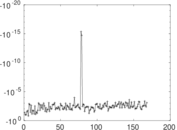
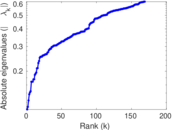
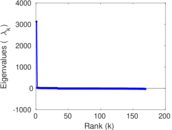
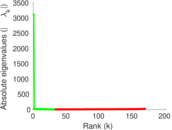
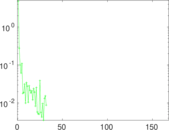
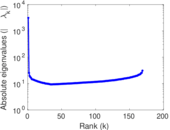
Plots

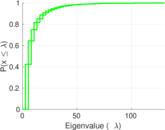
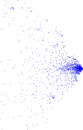
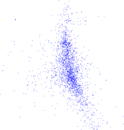


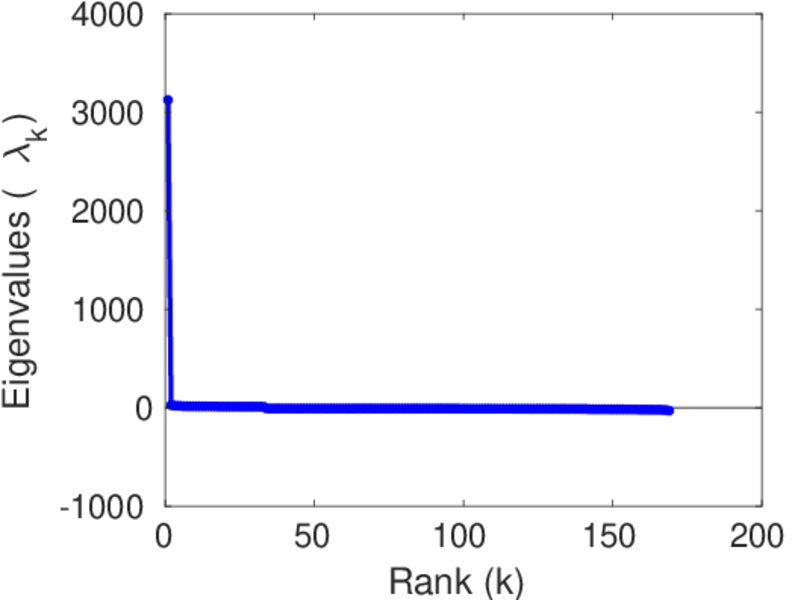
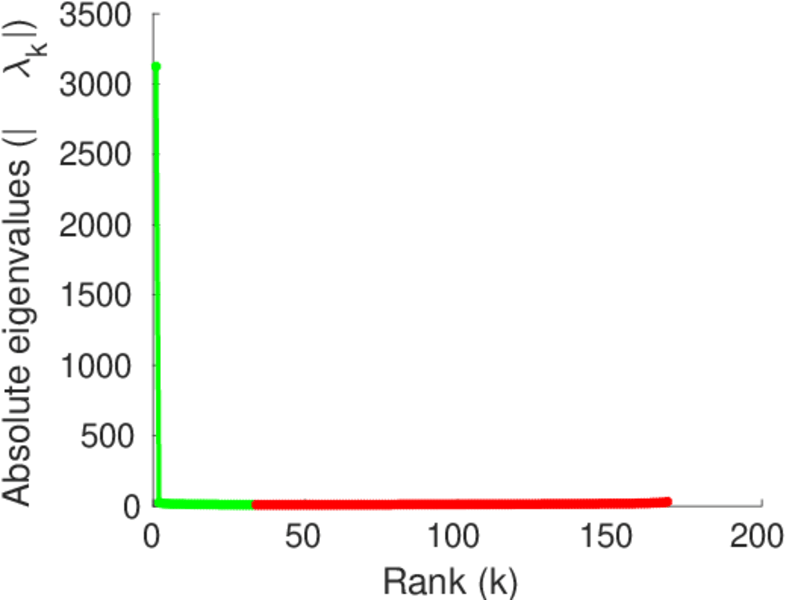
Matrix decompositions plots


Downloads
References
|
[1]
|
Jérôme Kunegis.
KONECT – The Koblenz Network Collection.
In Proc. Int. Conf. on World Wide Web Companion, pages
1343–1350, 2013.
[ http ]
|
|
[2]
|
Jean-François Rual, Kavitha Venkatesan, Tong Hao, Tomoko Hirozane-Kishikawa,
Amélie Dricot, Ning Li, Gabriel F. Berriz, Francis D. Gibbons, Matija Dreze,
and Nono Ayivi-Guedehoussou.
Towards a proteome-scale map of the human protein–protein
interaction network.
Nature, (7062):1173–1178, 2005.
|
 KONECT ‣ Networks ‣
Buy Me a Coffee
KONECT ‣ Networks ‣
Buy Me a Coffee