Windsurfers
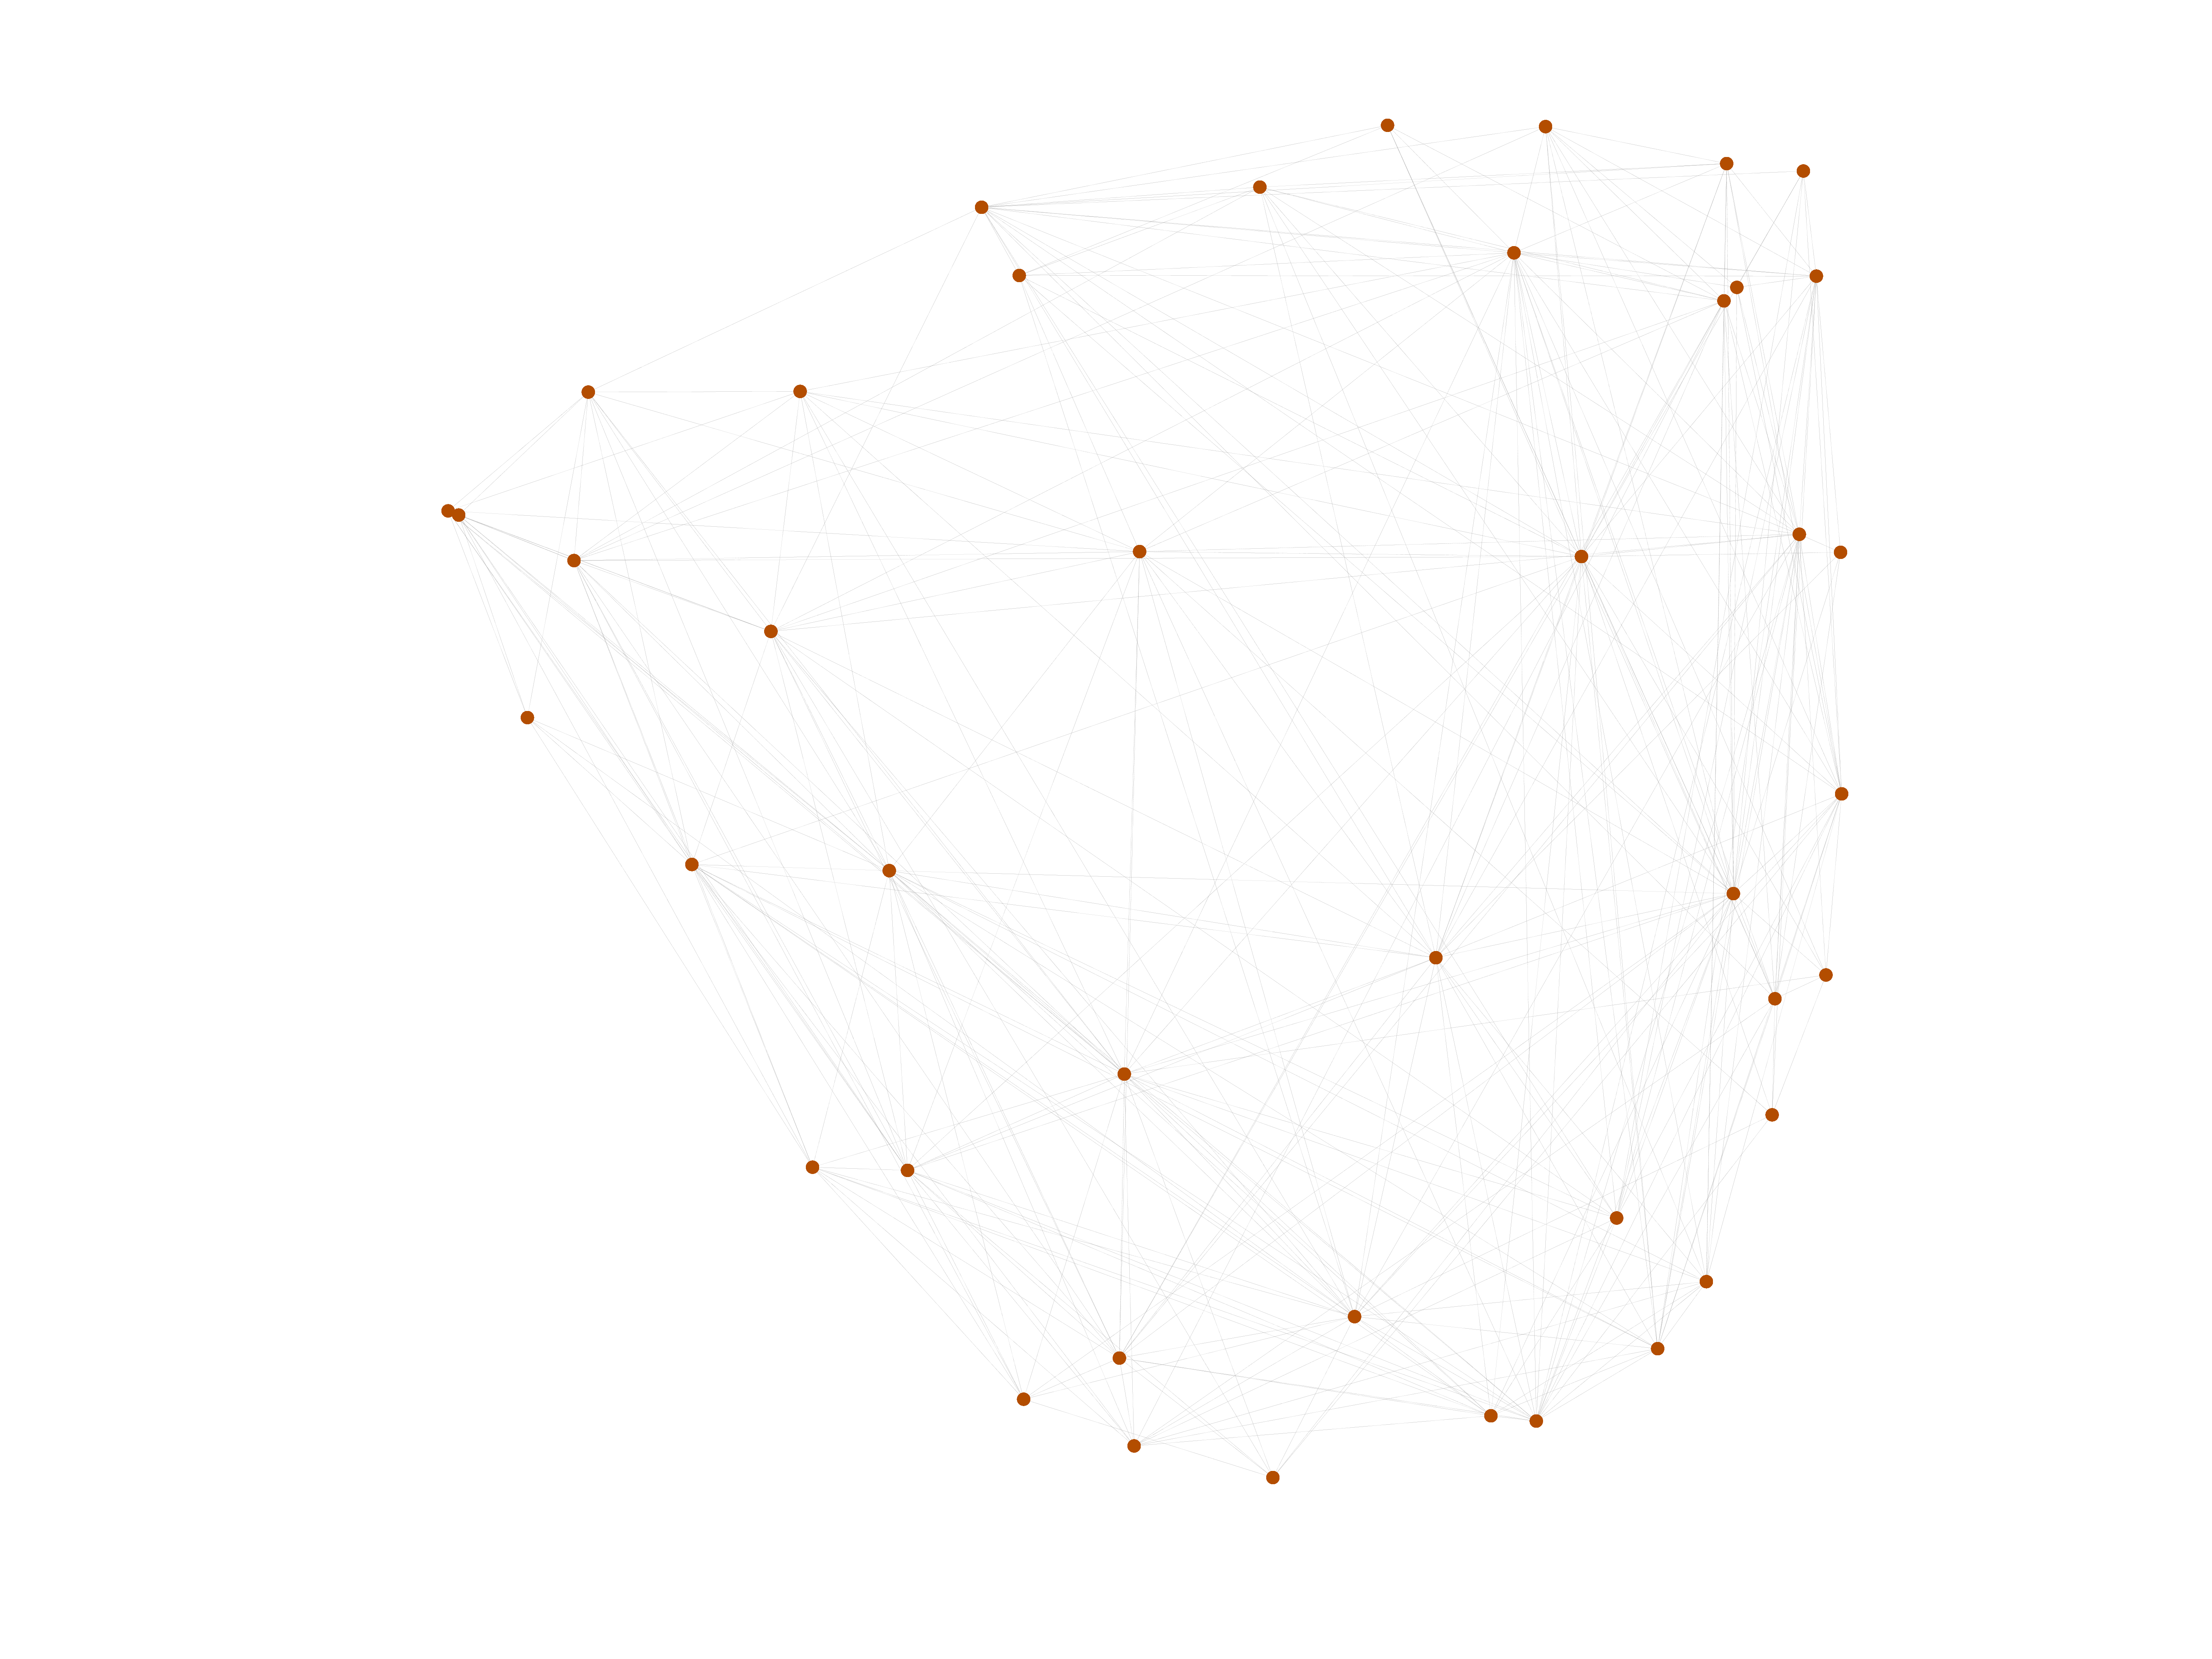
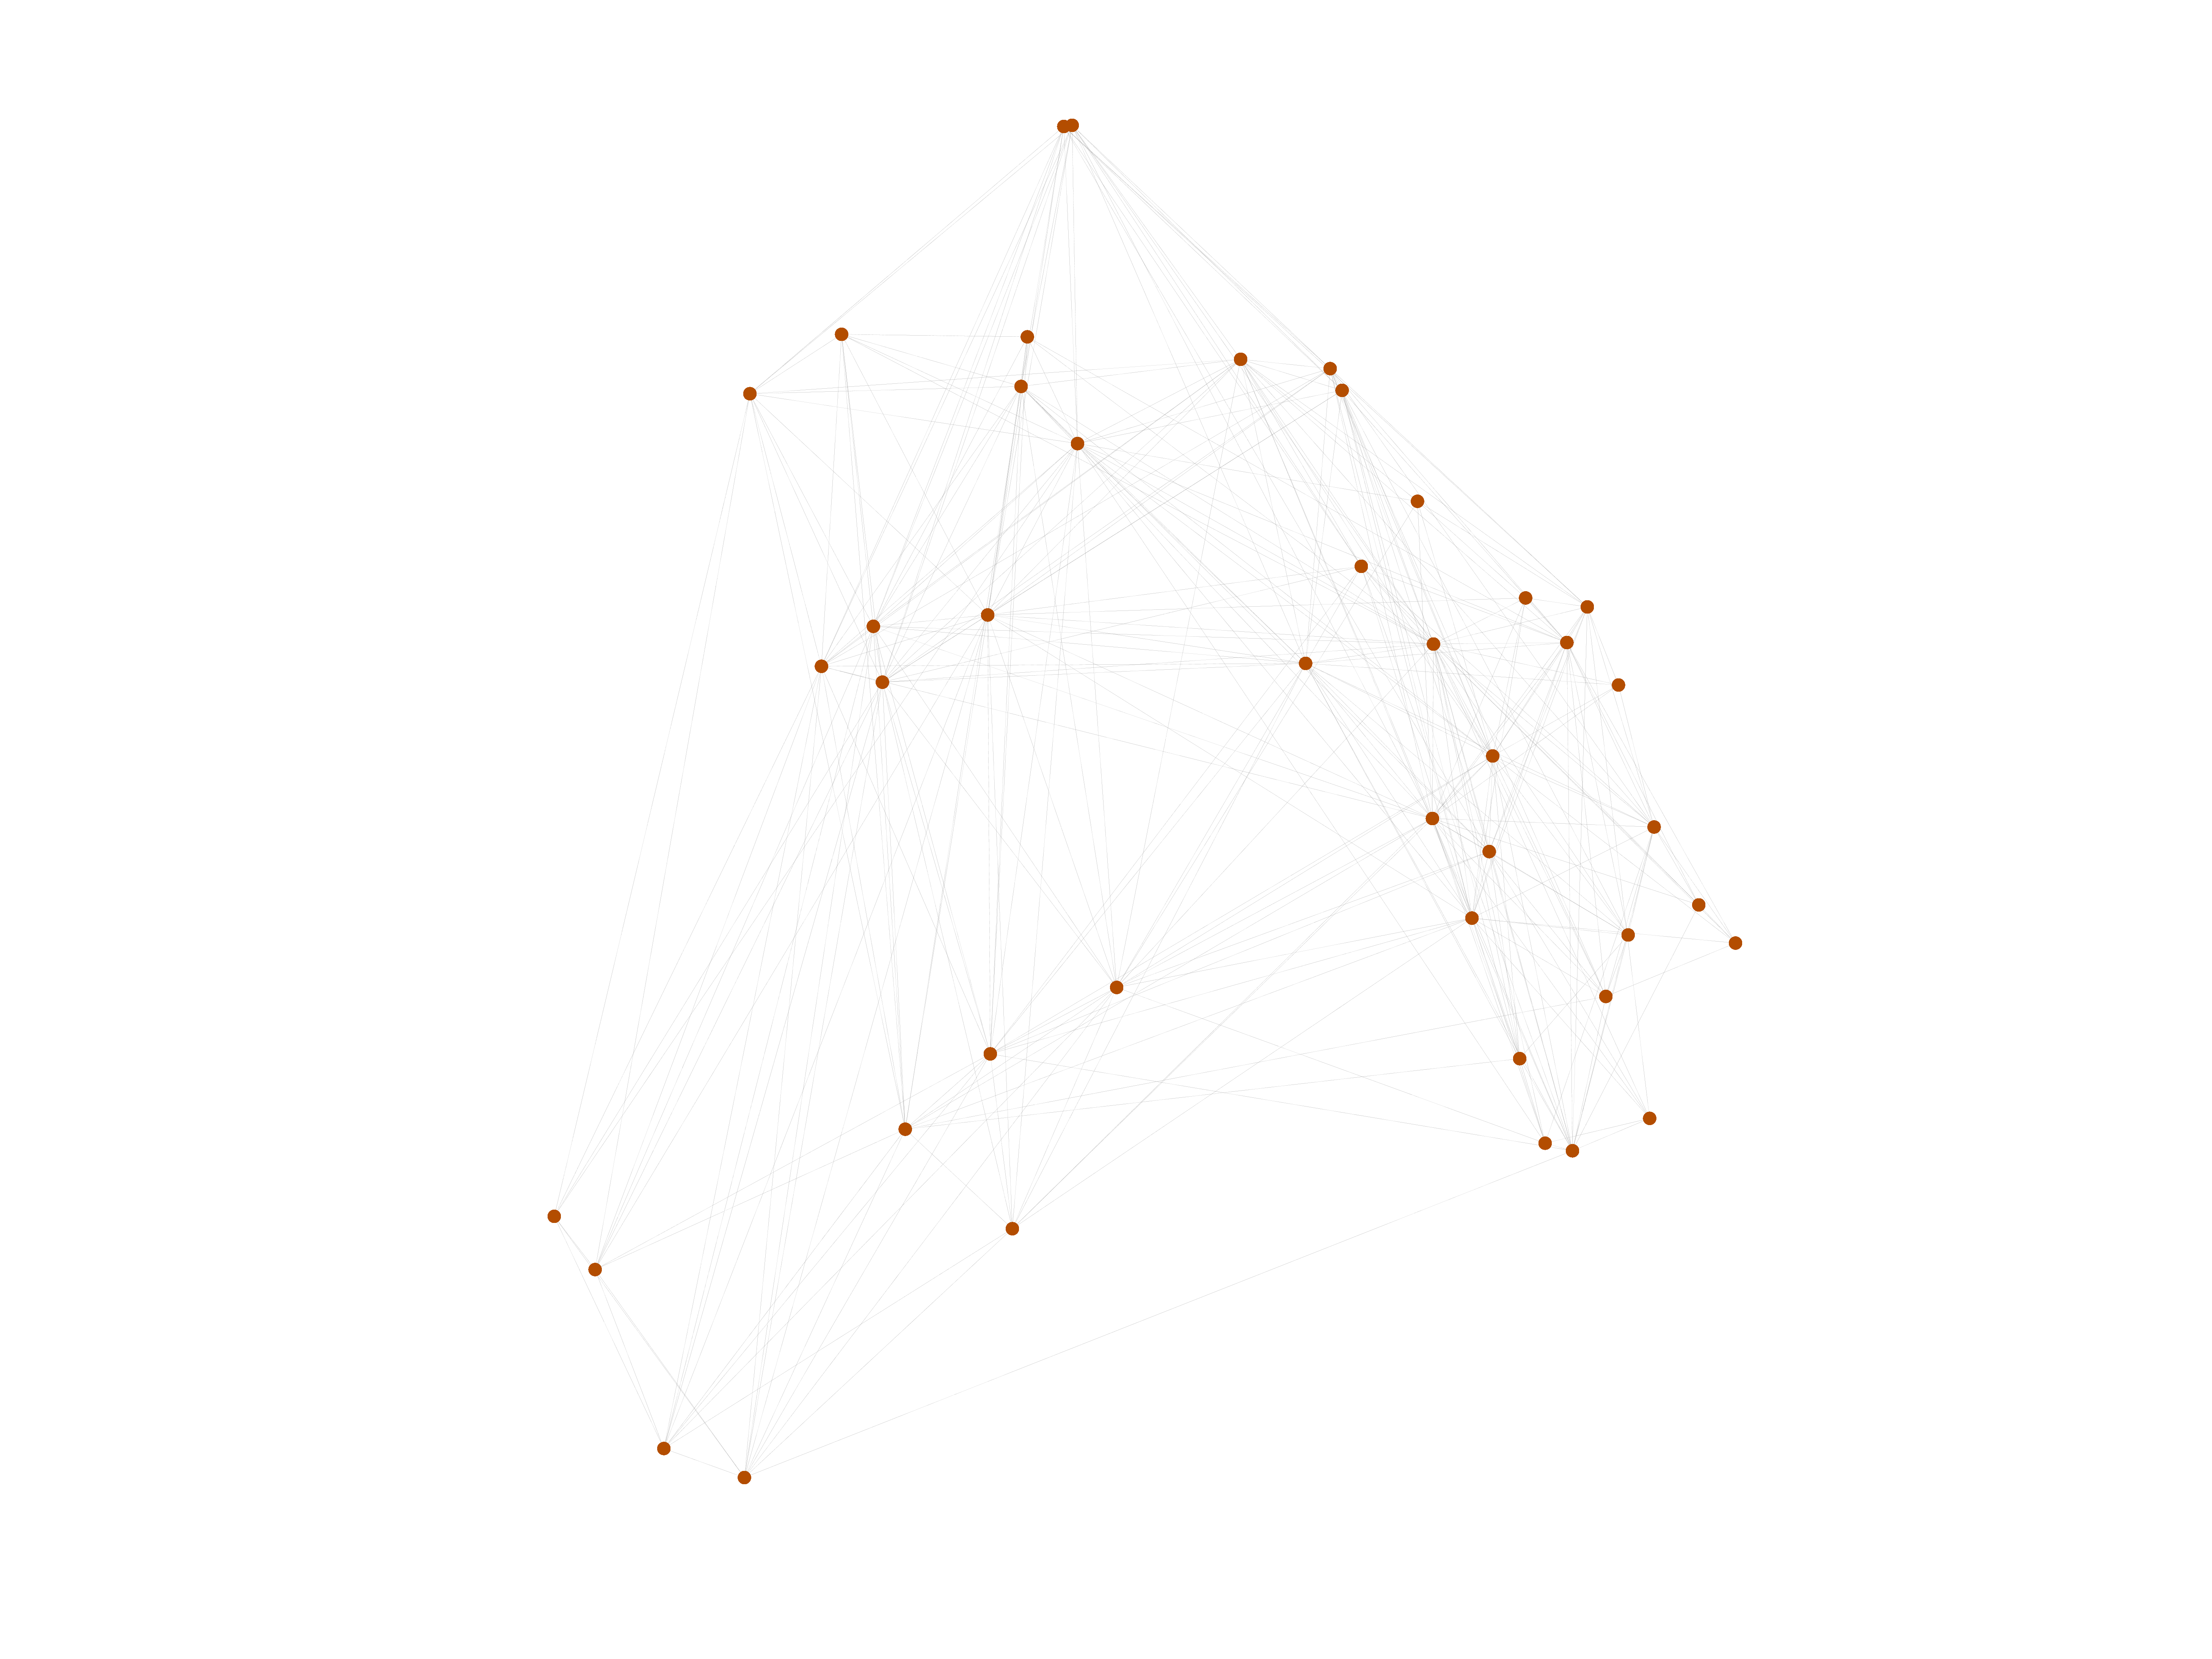
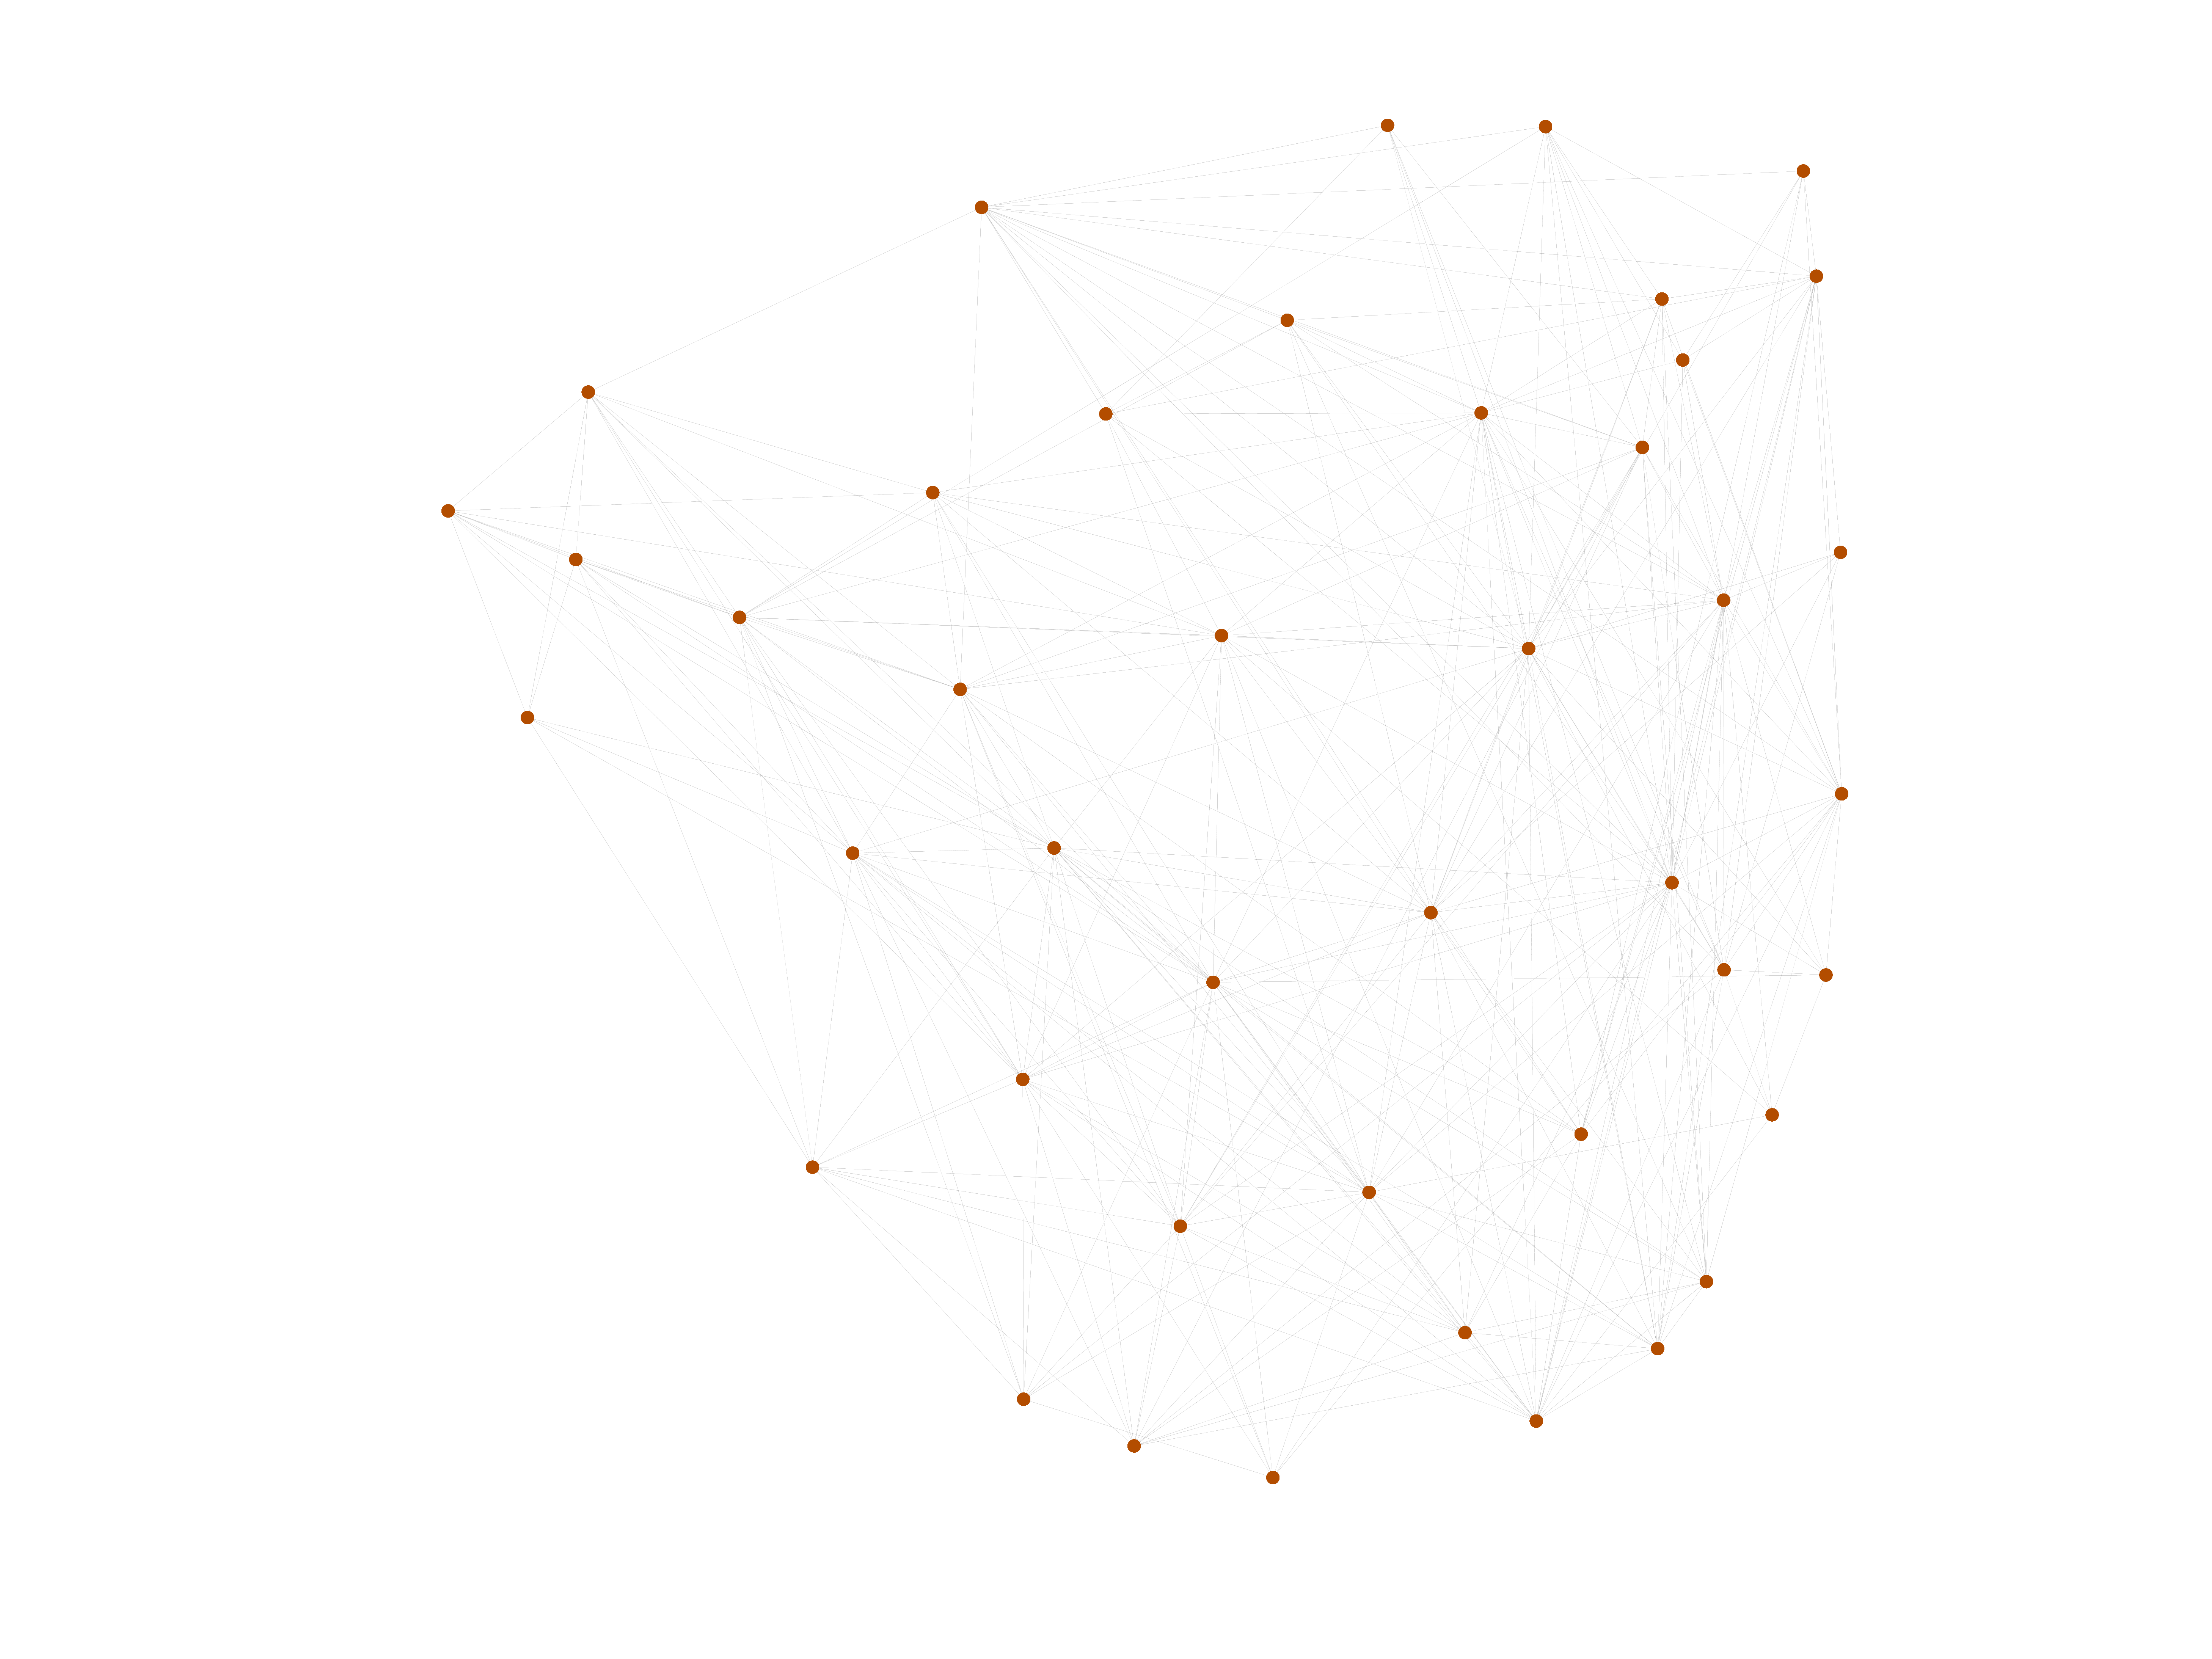
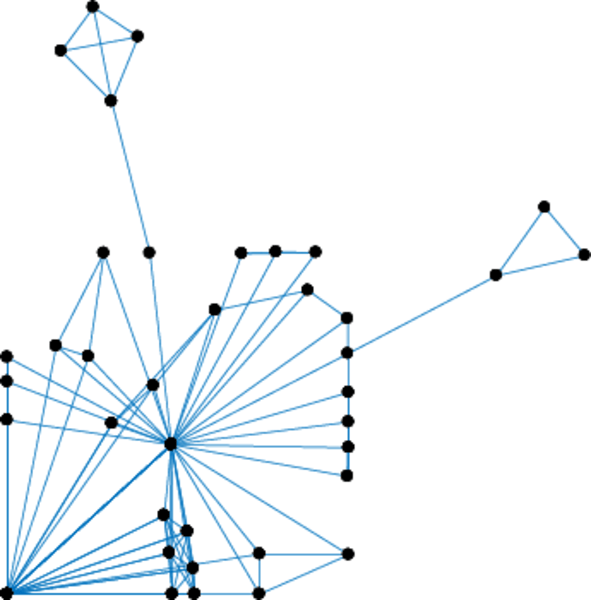
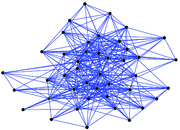
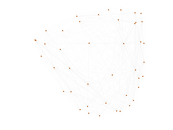
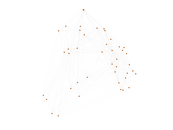
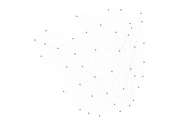
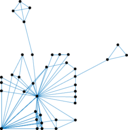
This undirected network contains interpersonal contacts between windsurfers in
southern California during the fall of 1986. A node represents a windsurfer and
an edge between two windsurfers shows that there was a interpersonal contact.
Metadata
Statistics
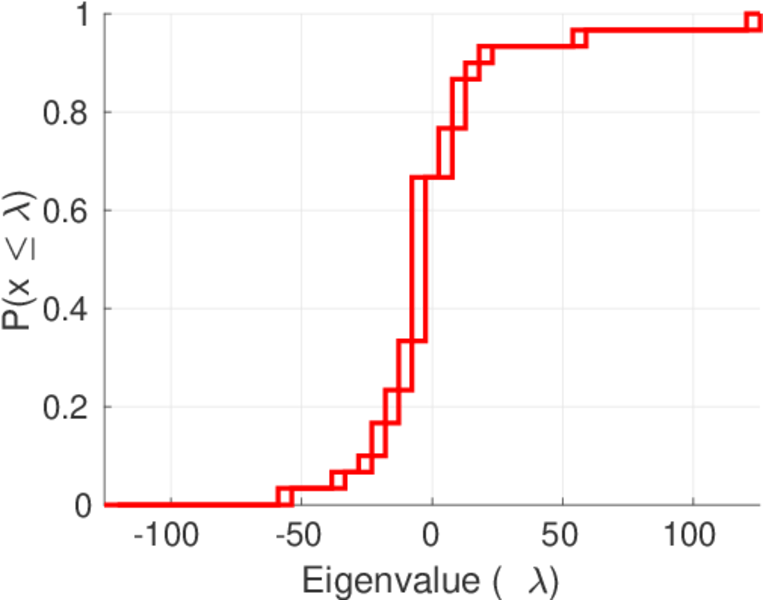
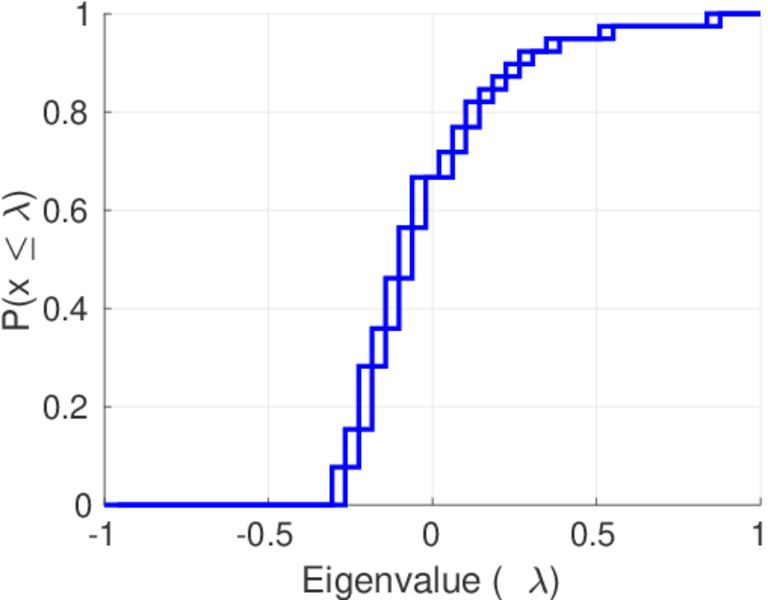
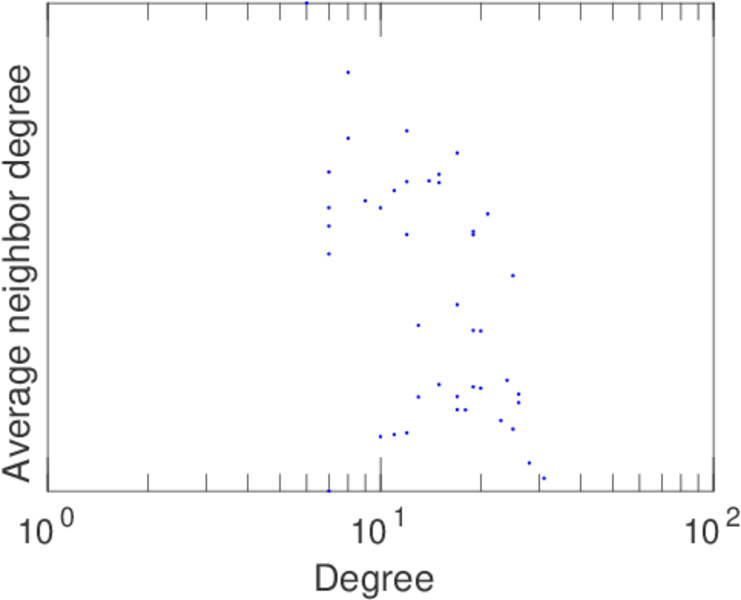
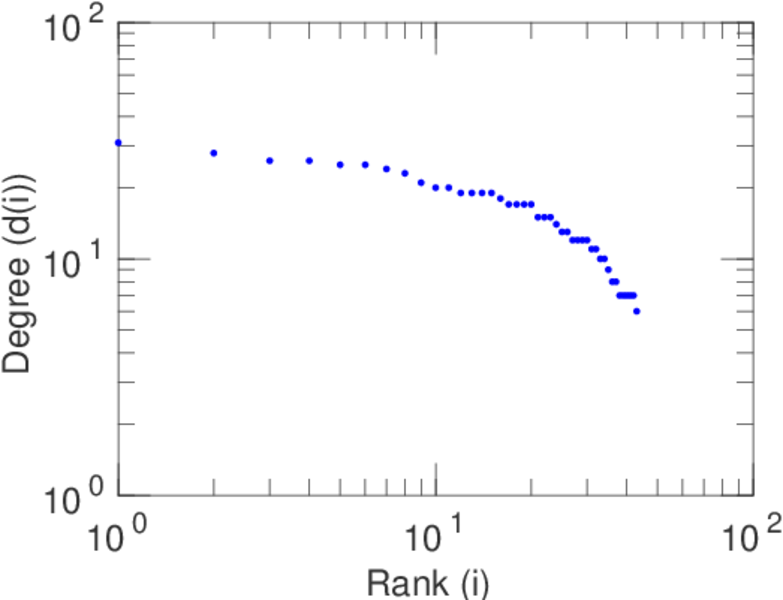
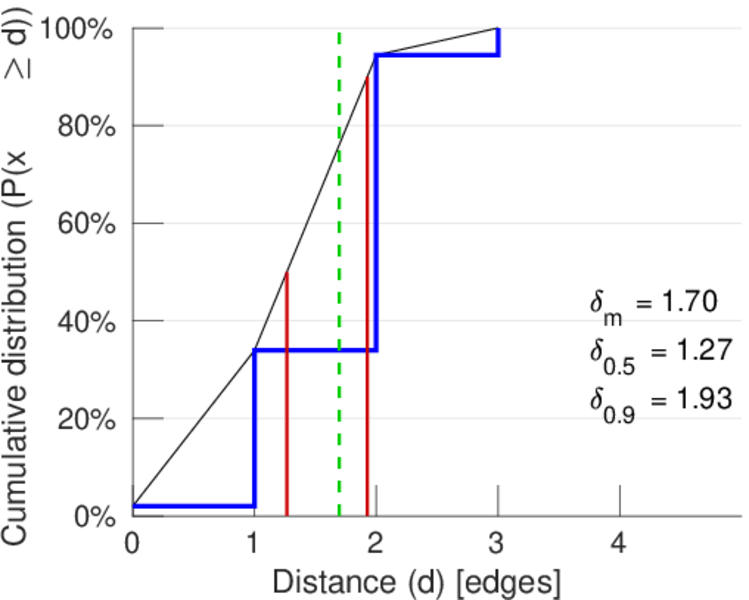
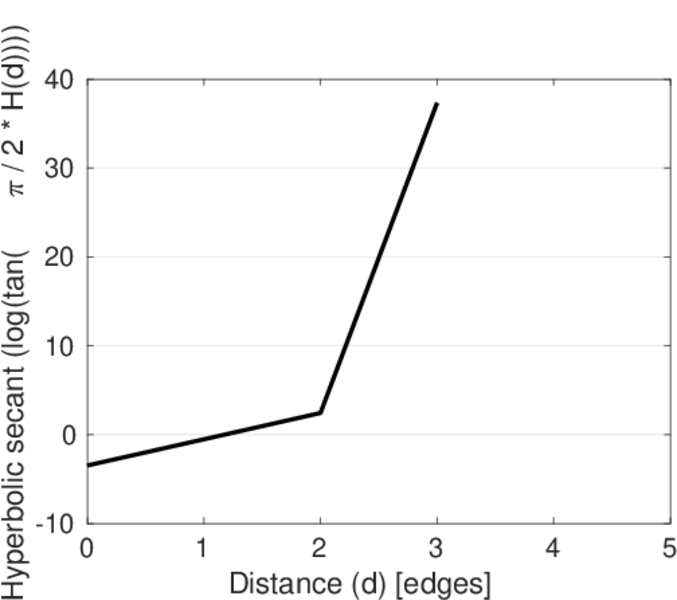
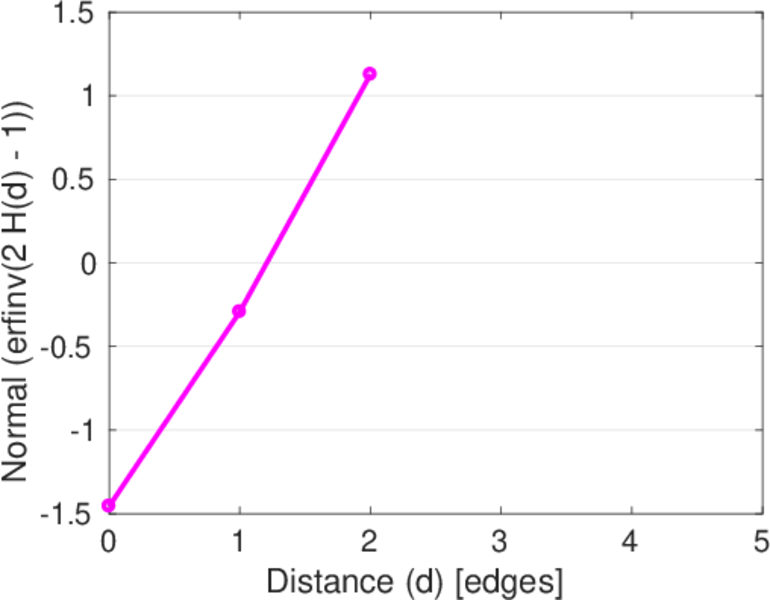
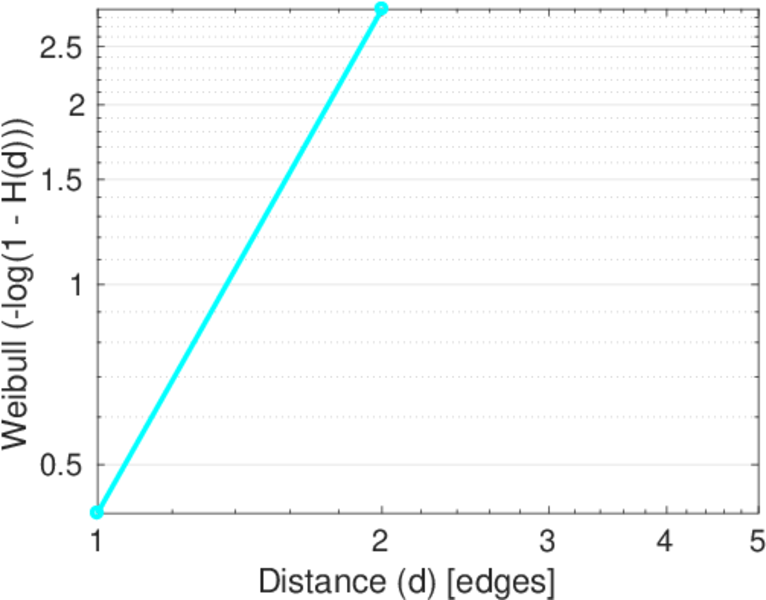
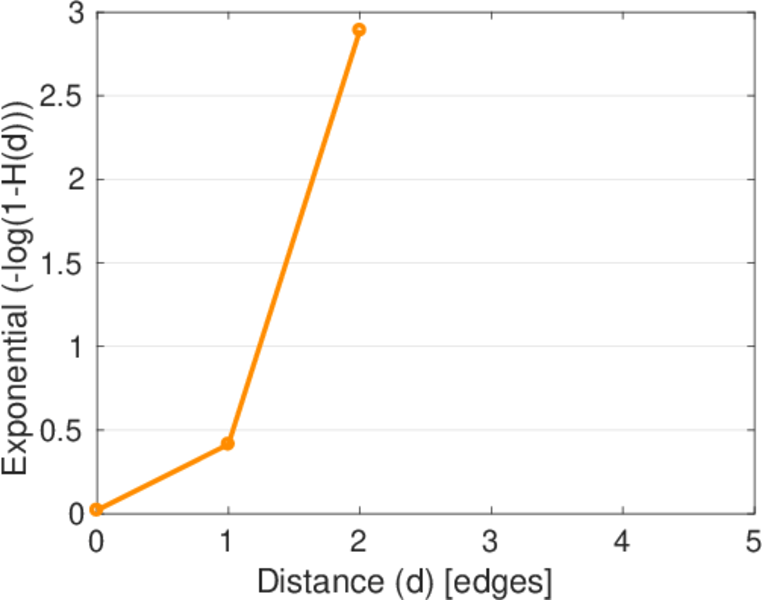
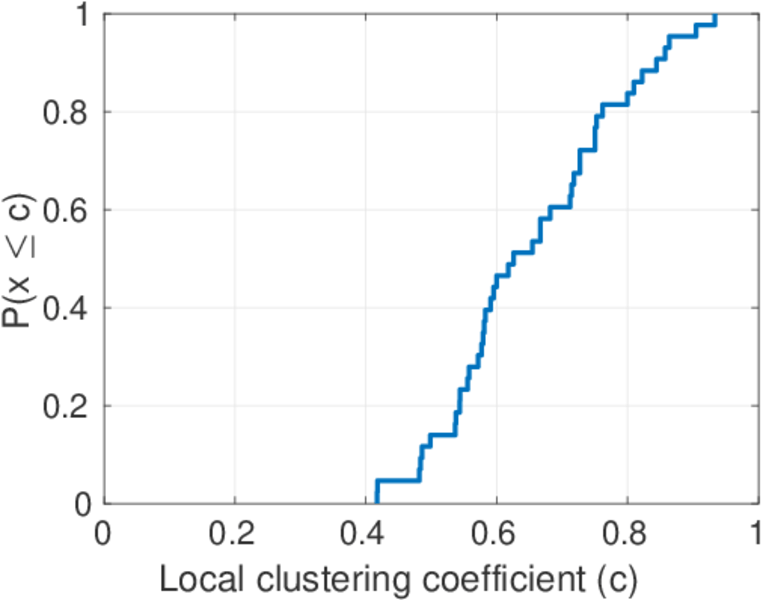
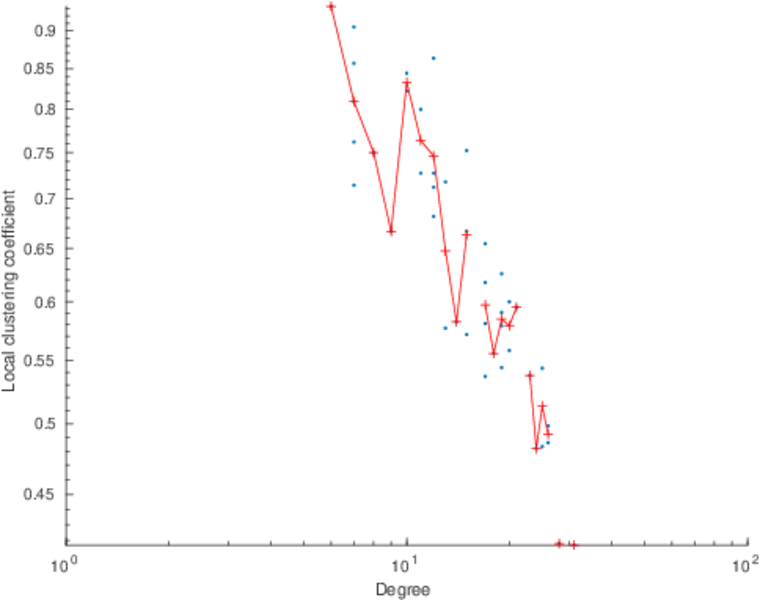
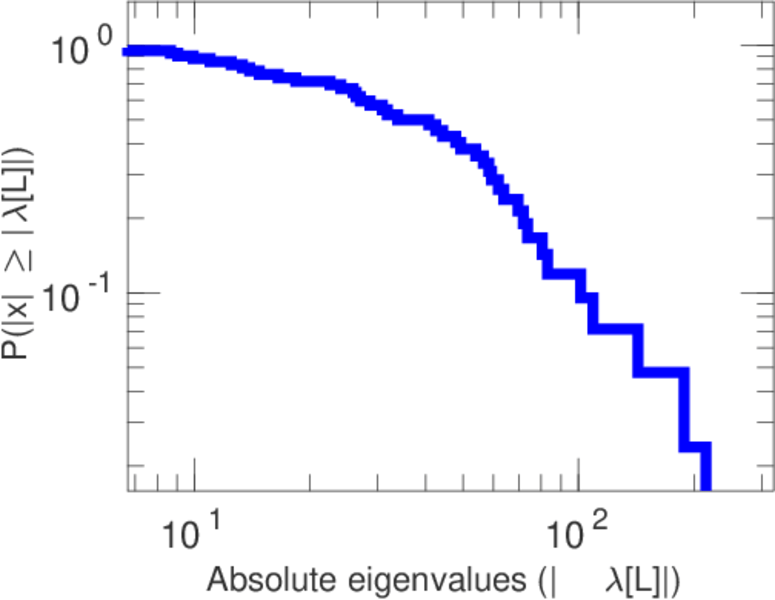
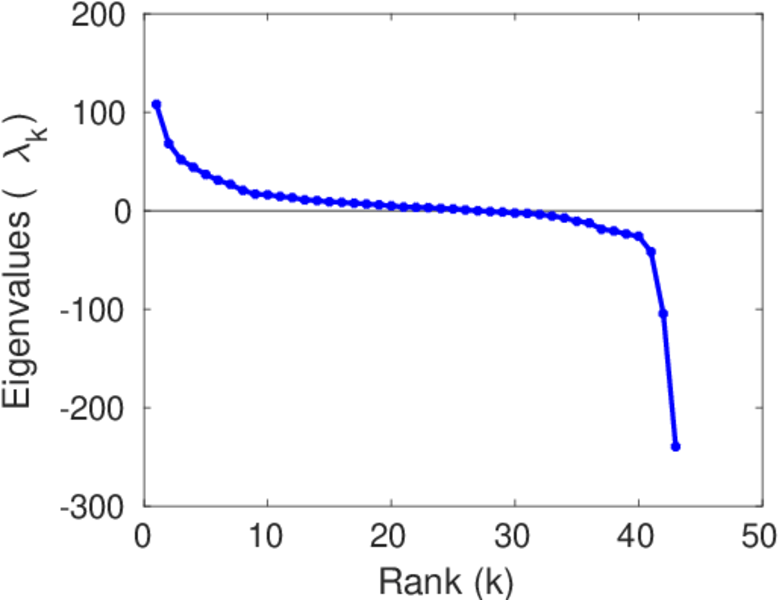
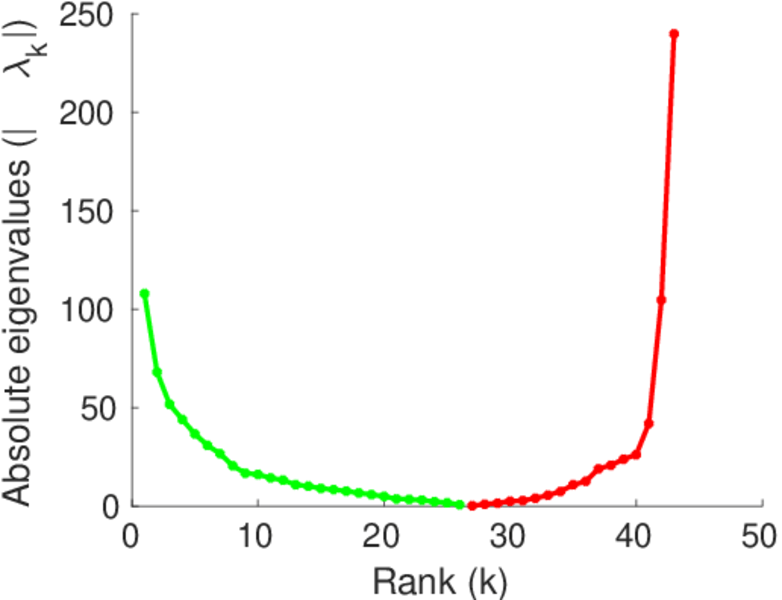
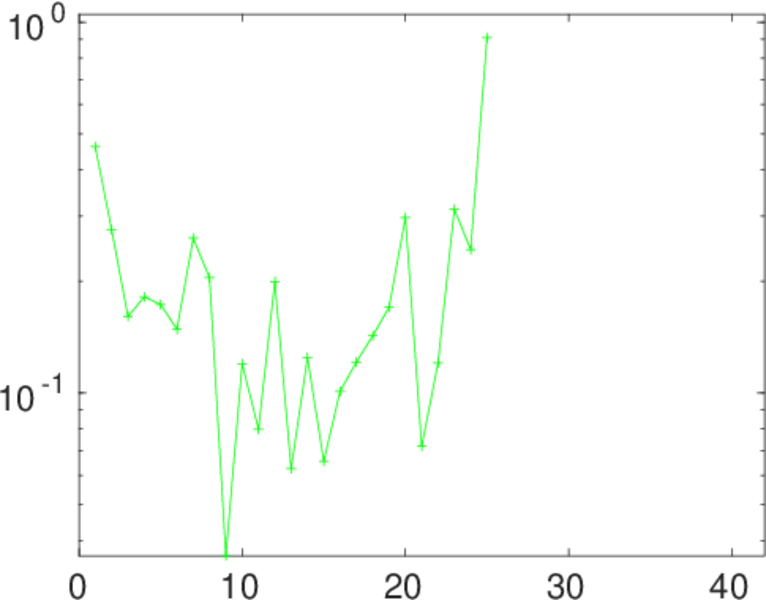
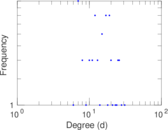
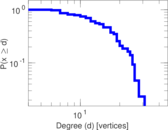
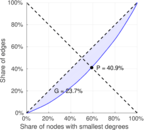
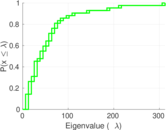
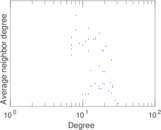
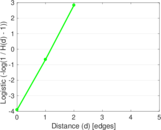
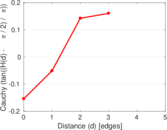
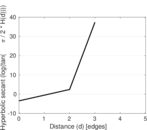
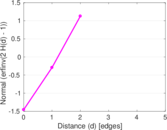
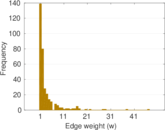
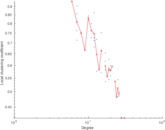
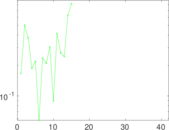
Plots


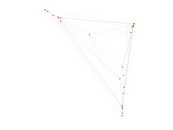
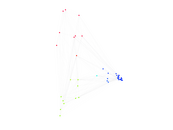

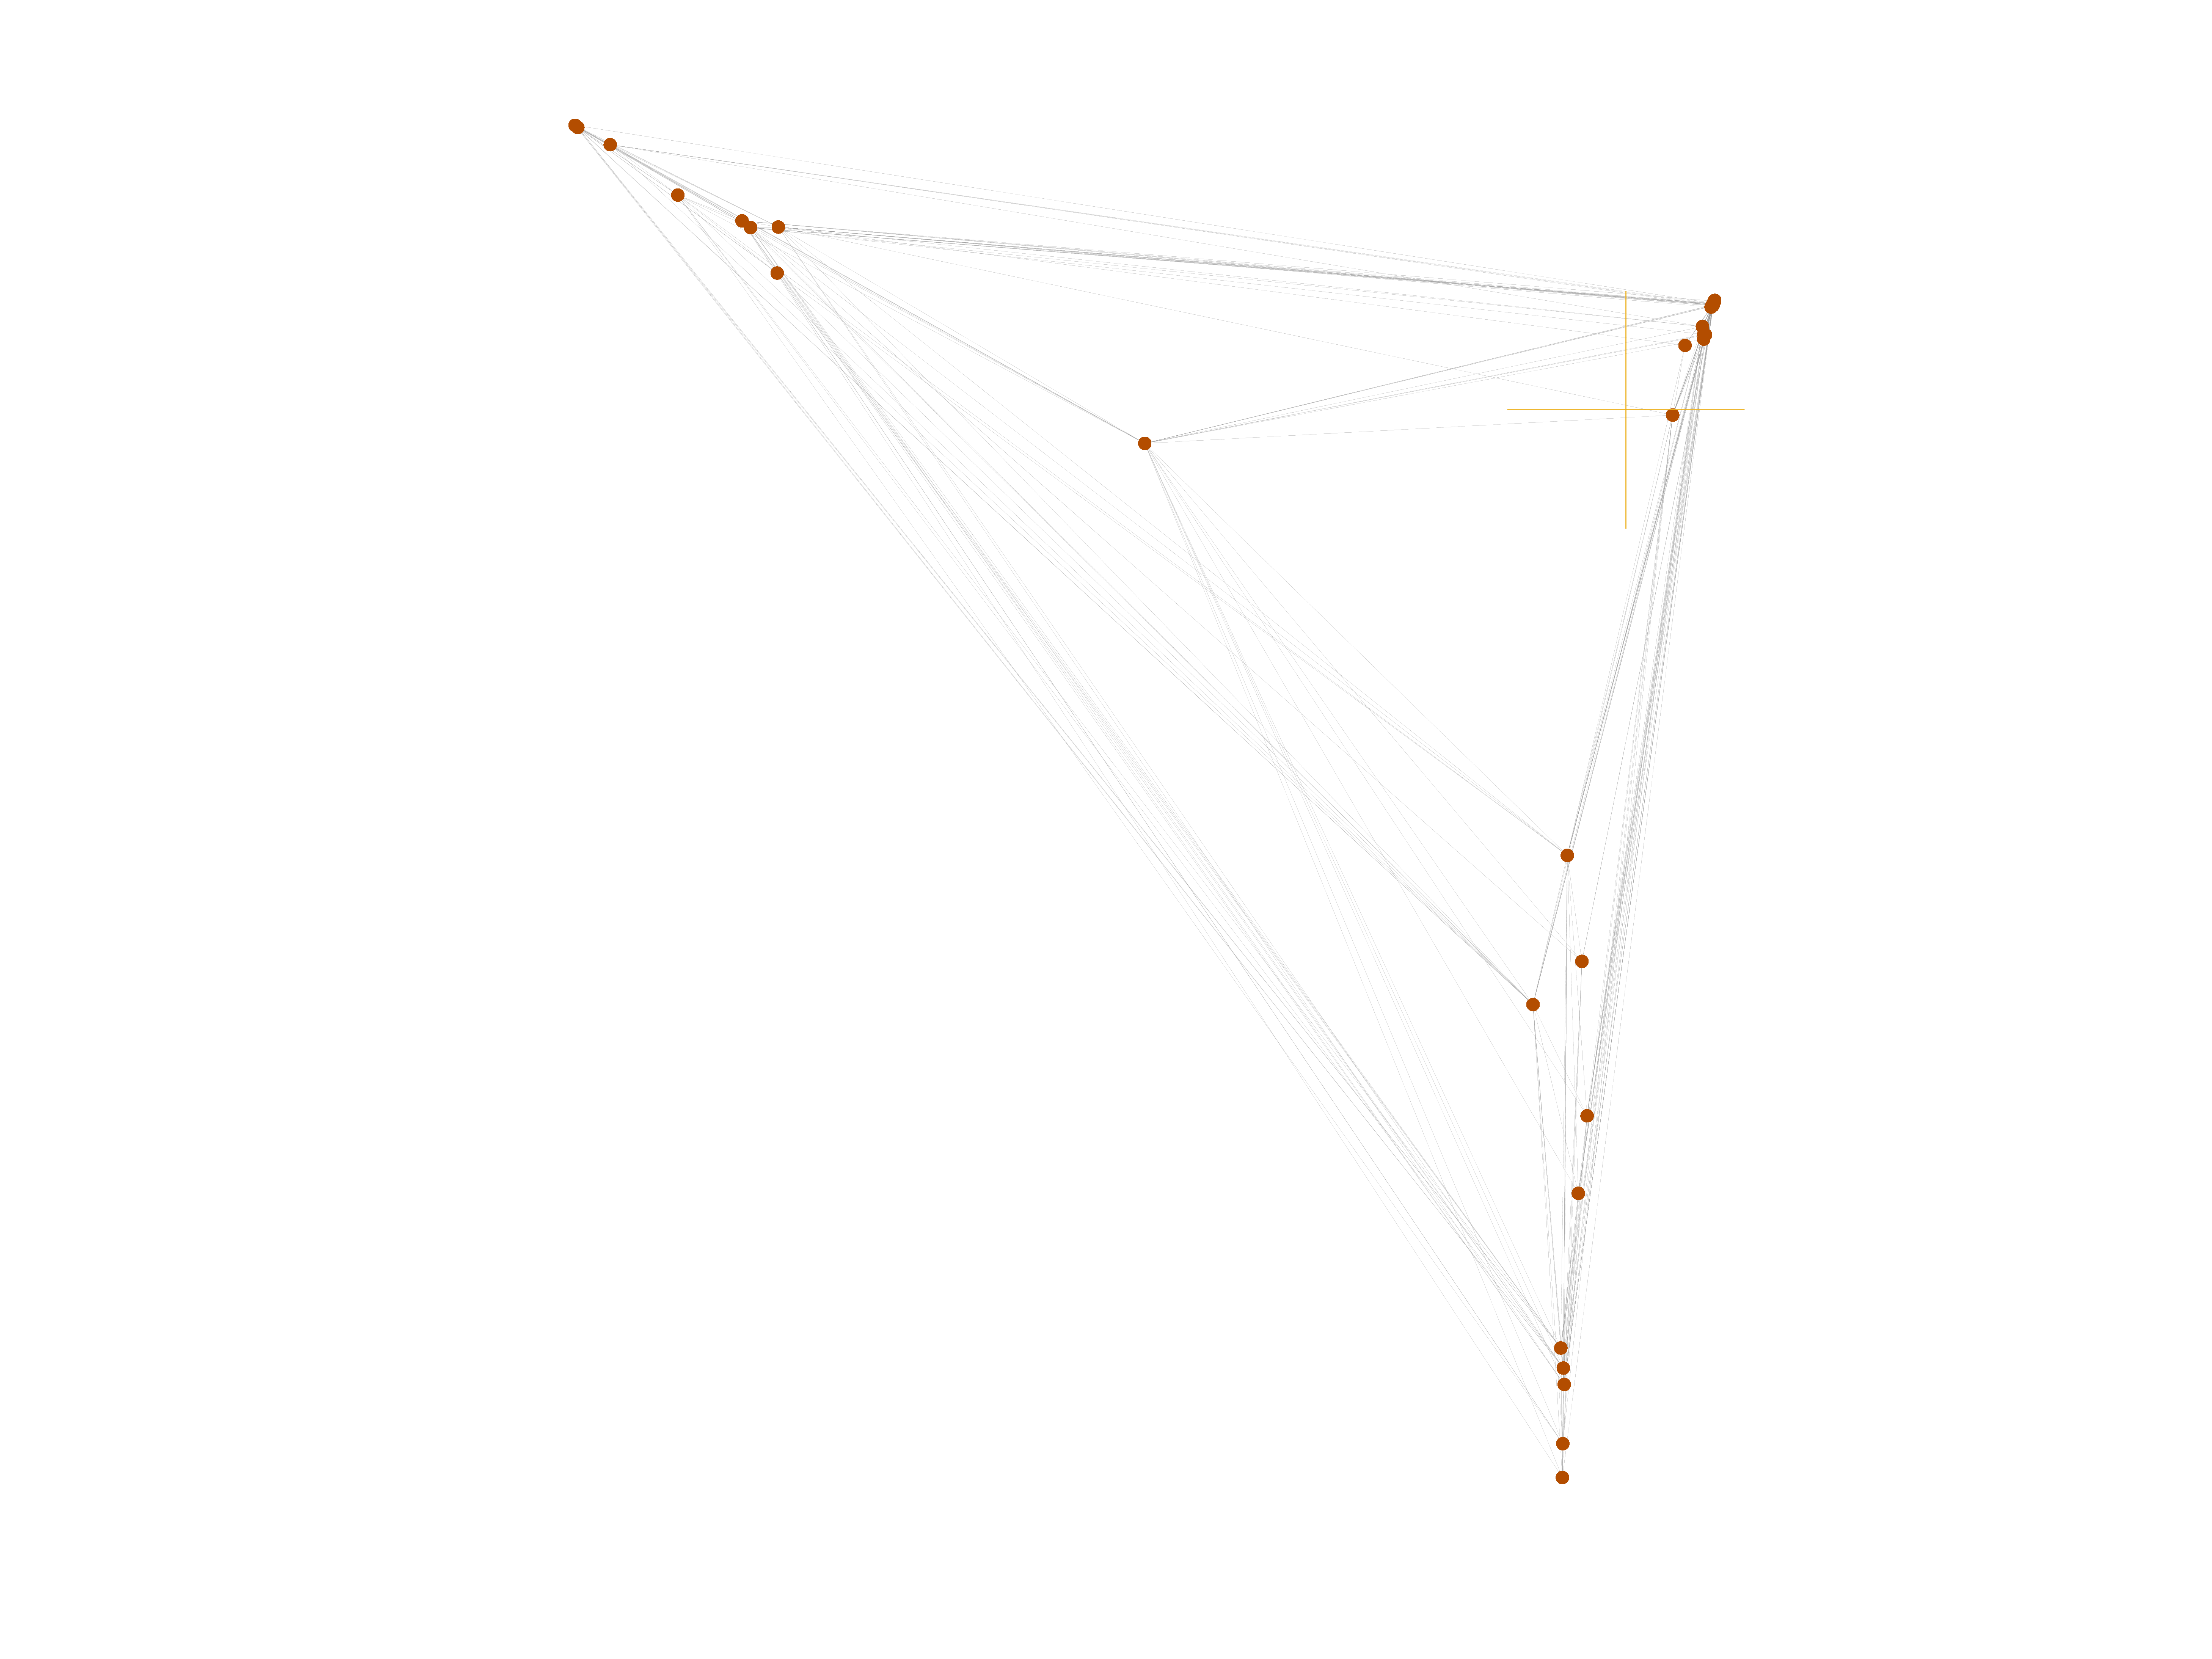
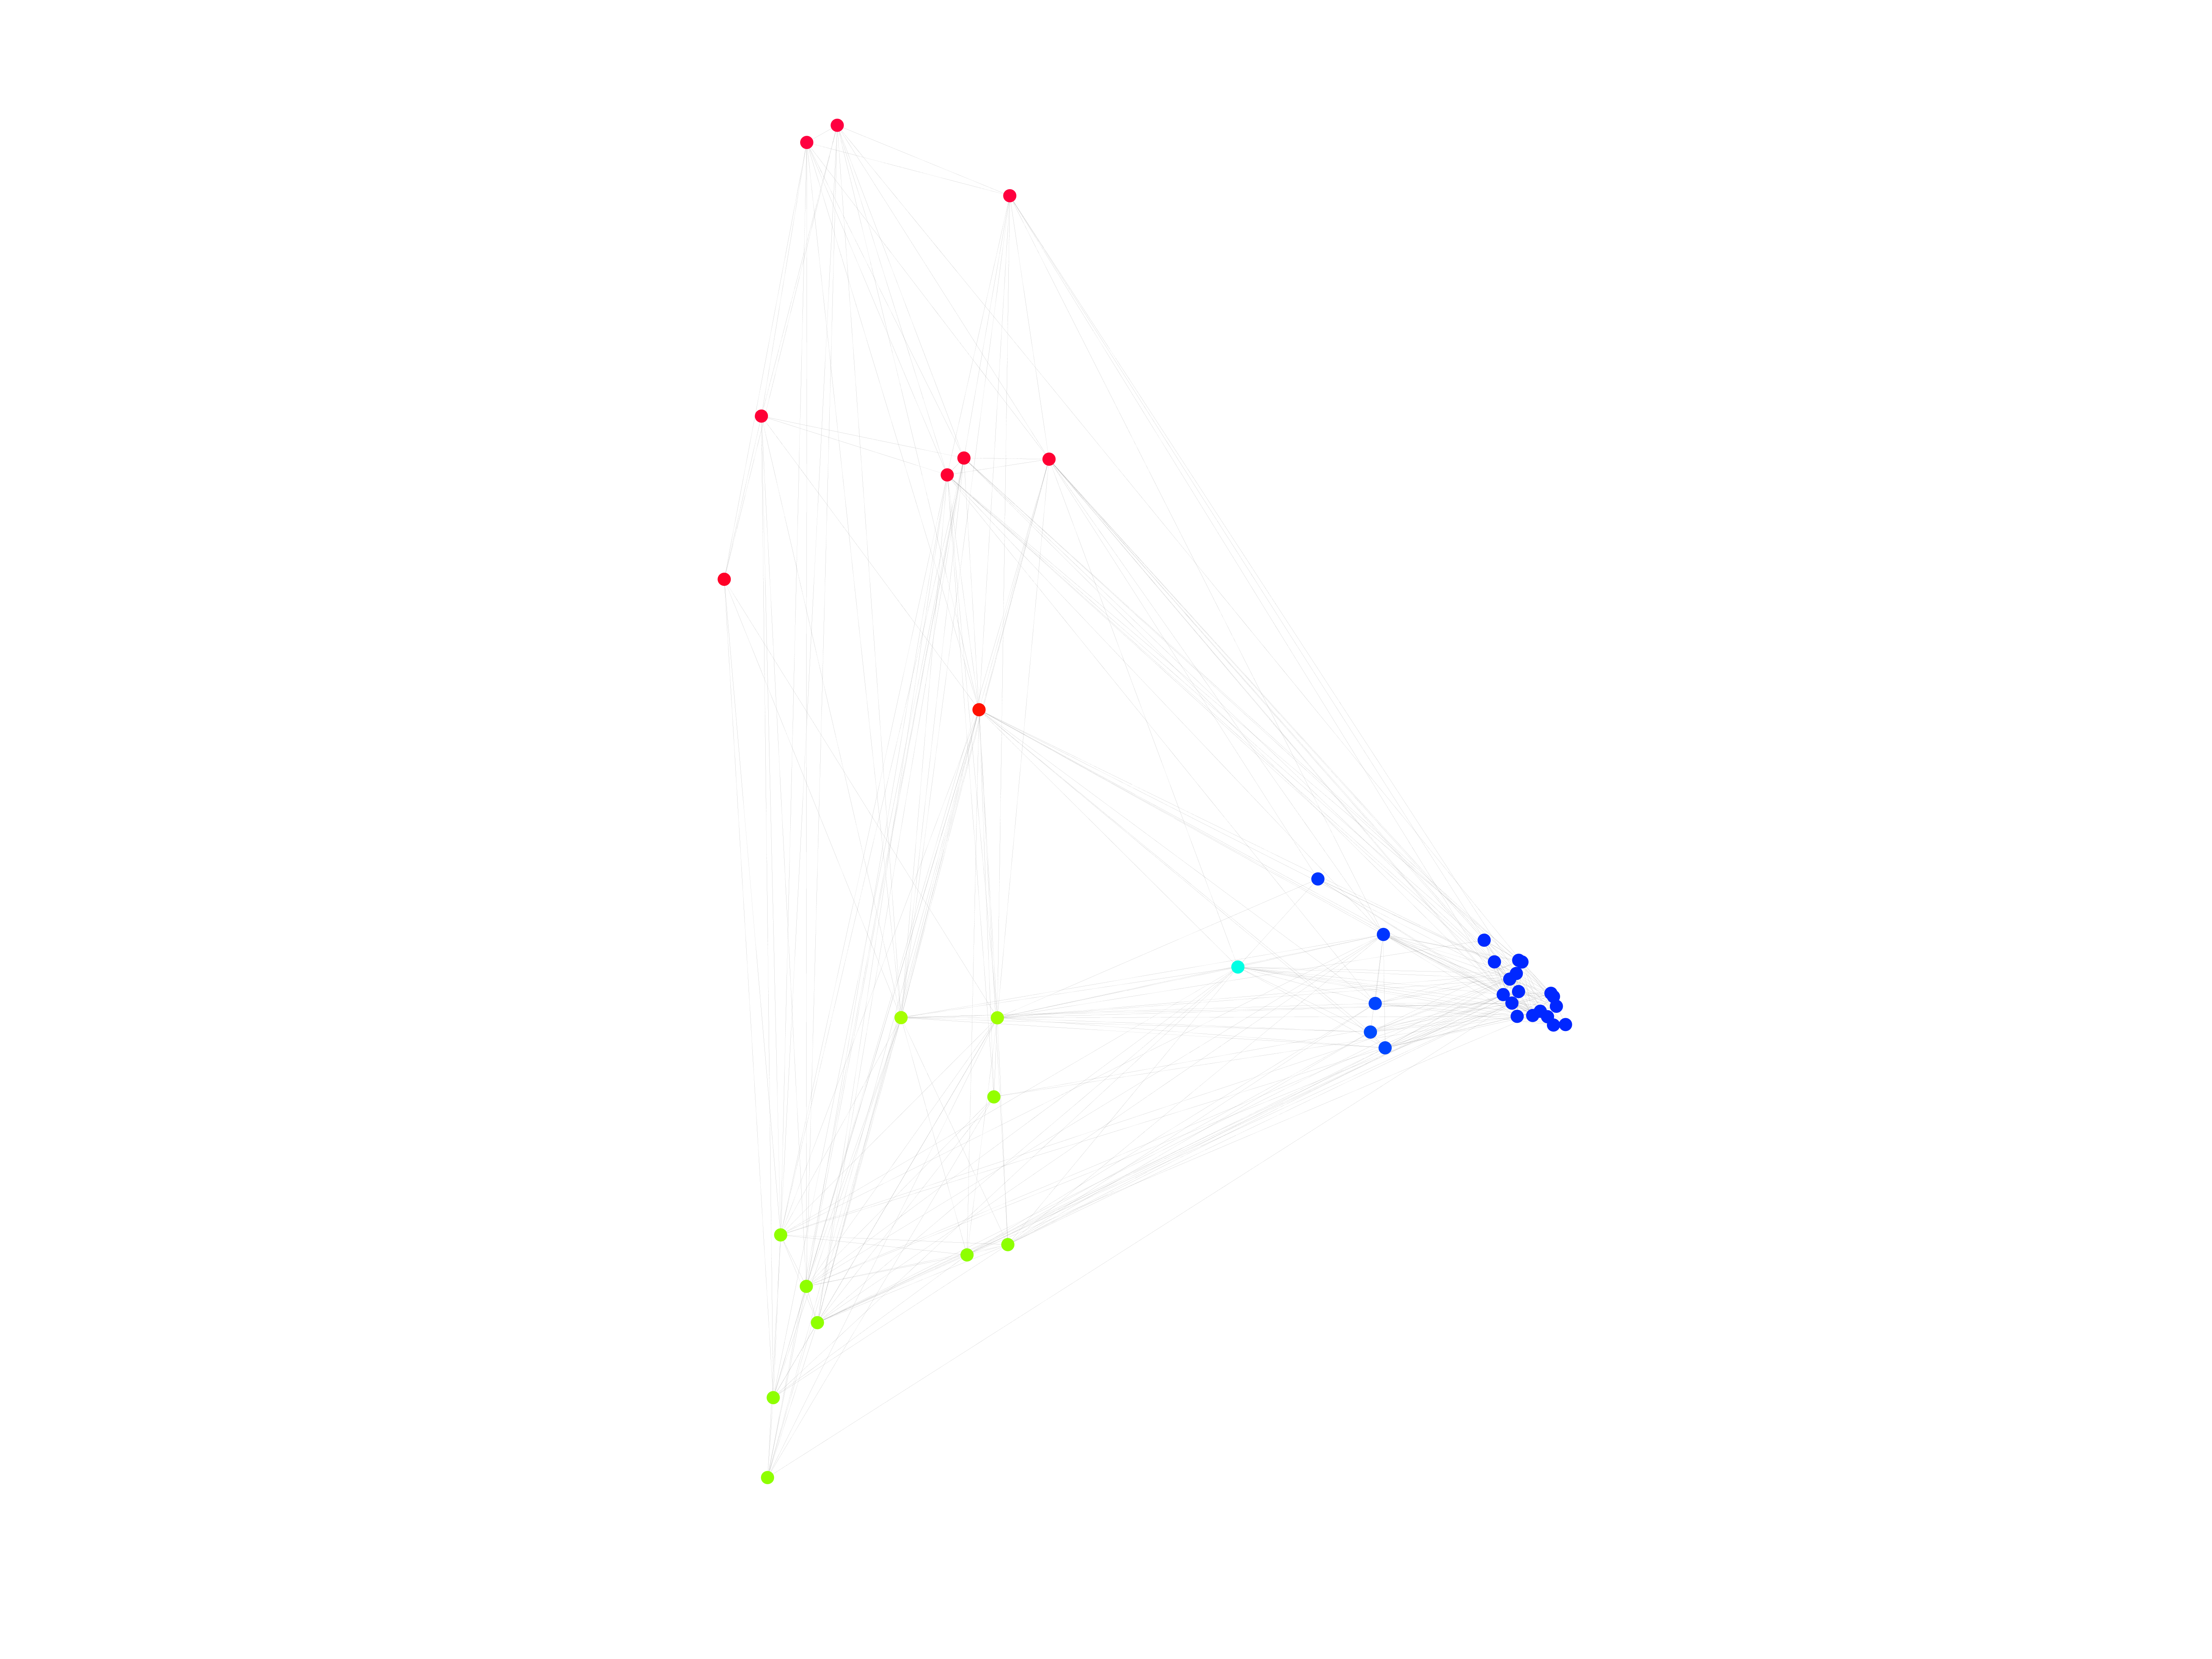
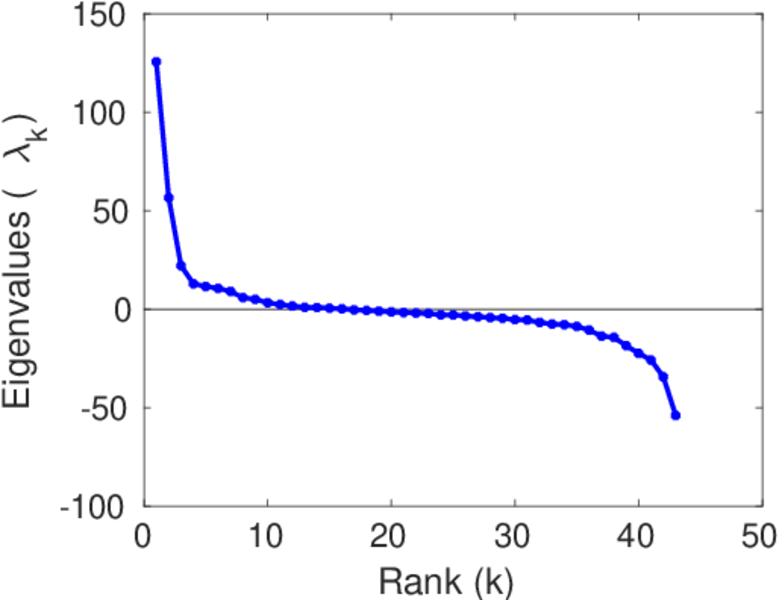
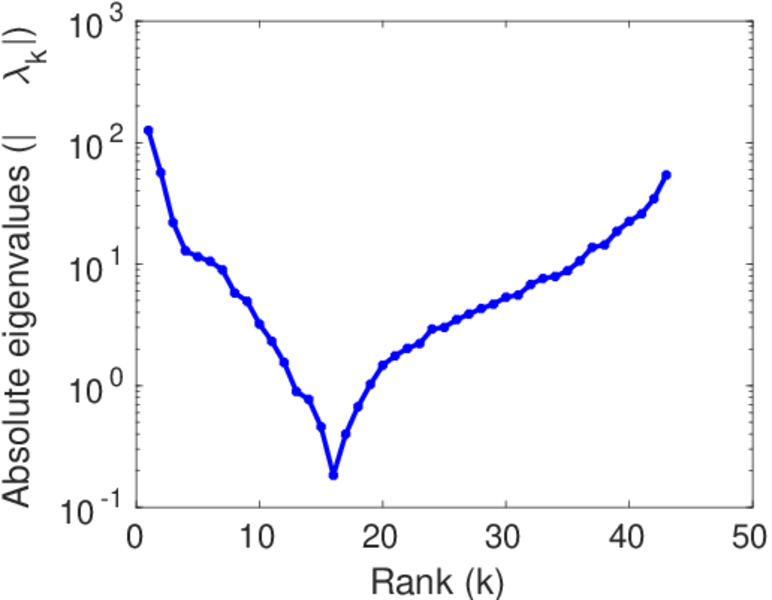
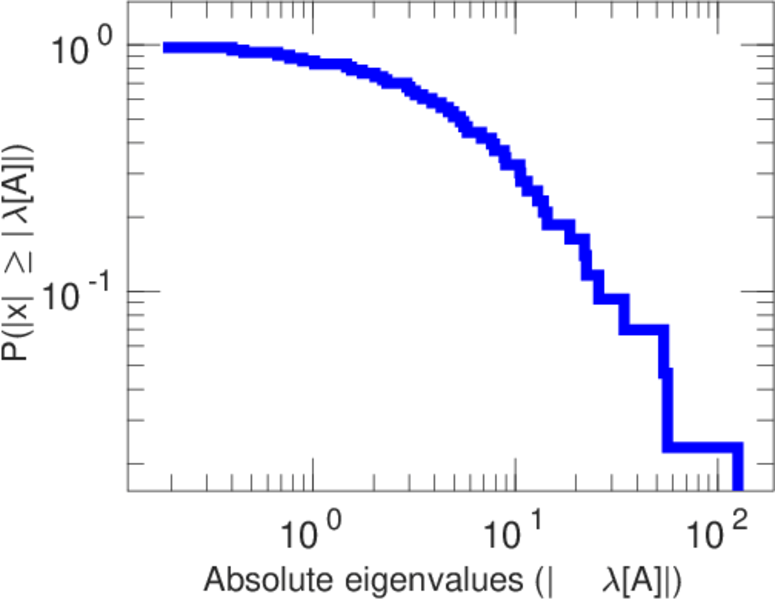
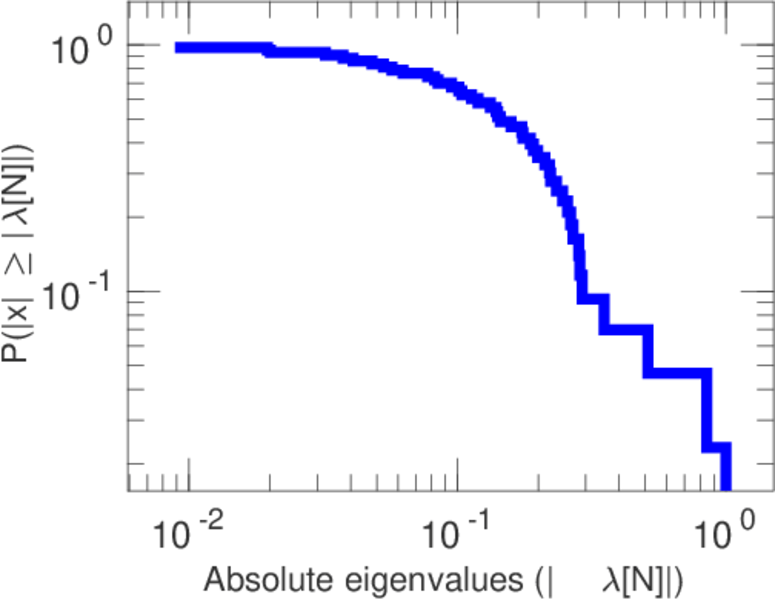
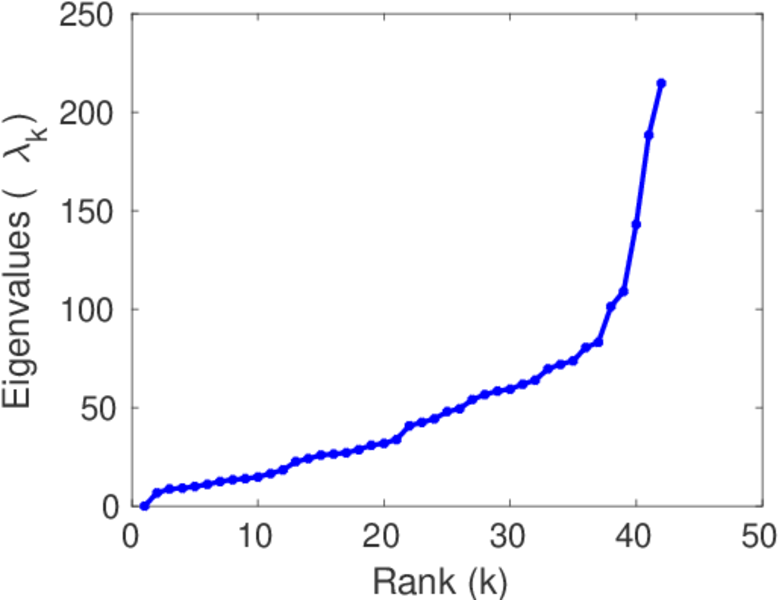
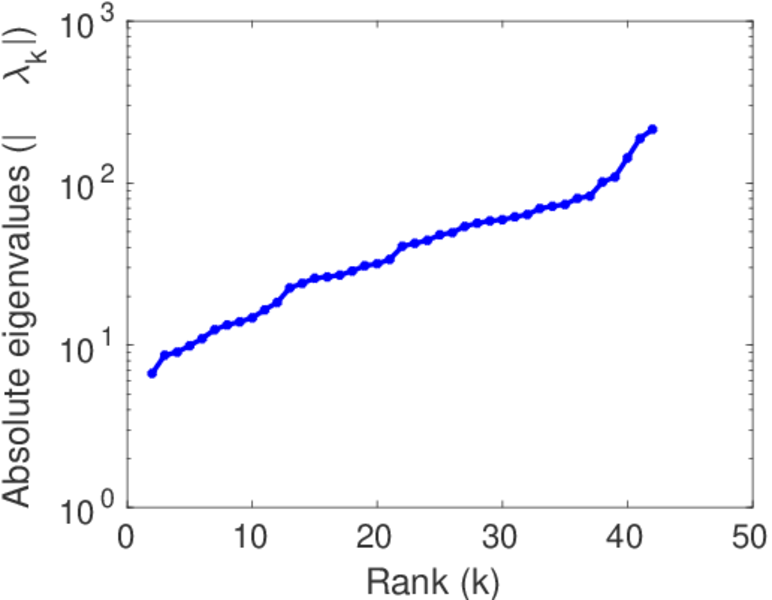
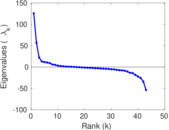
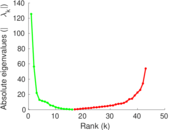
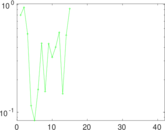
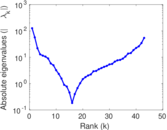
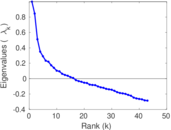
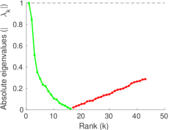
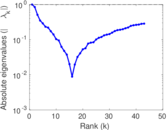
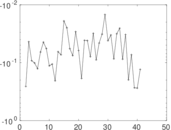
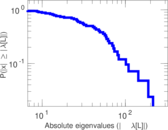
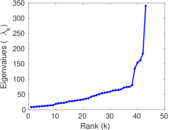
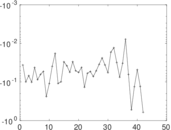
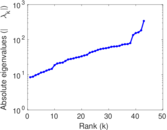
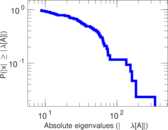
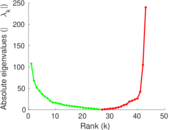
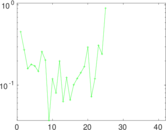
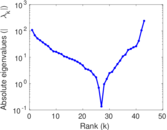
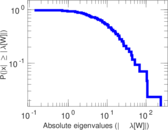
Matrix decompositions plots


Downloads
References
|
[1]
|
Jérôme Kunegis.
KONECT – The Koblenz Network Collection.
In Proc. Int. Conf. on World Wide Web Companion, pages
1343–1350, 2013.
[ http ]
|
|
[2]
|
Linton Clarke Freeman, Cynthia Marie Webster, and Deirdre M. Kirke.
Exploring social structure using dynamic three-dimensional color
images.
Soc. Netw., 20(2):109–118, 1998.
|
|
[3]
|
Linton C. Freeman, Sue C. Freeman, and Alaina G. Michaelson.
On human social intelligence.
J. Soc. and Biol. Struct., 11(4):415–425, 1988.
|
 KONECT ‣ Networks ‣
Buy Me a Coffee
KONECT ‣ Networks ‣
Buy Me a Coffee