 KONECT ‣ Networks ‣
Buy Me a Coffee
KONECT ‣ Networks ‣
Buy Me a Coffee
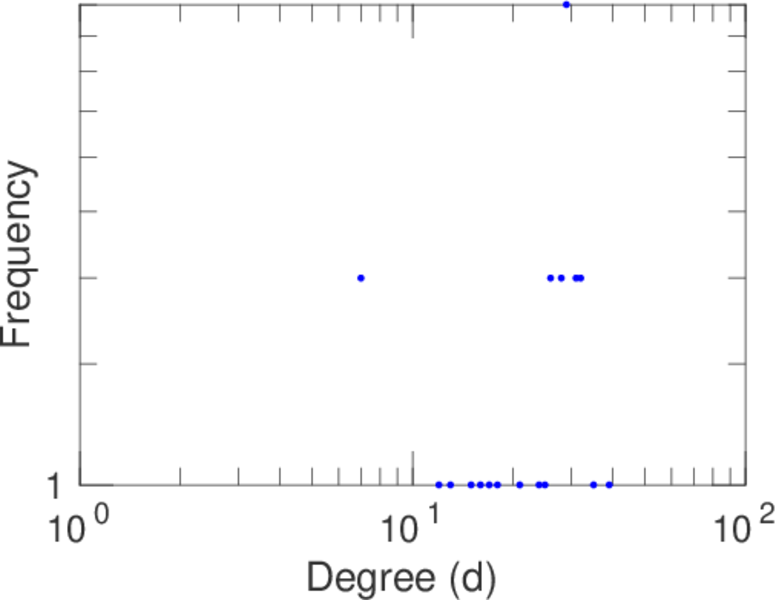
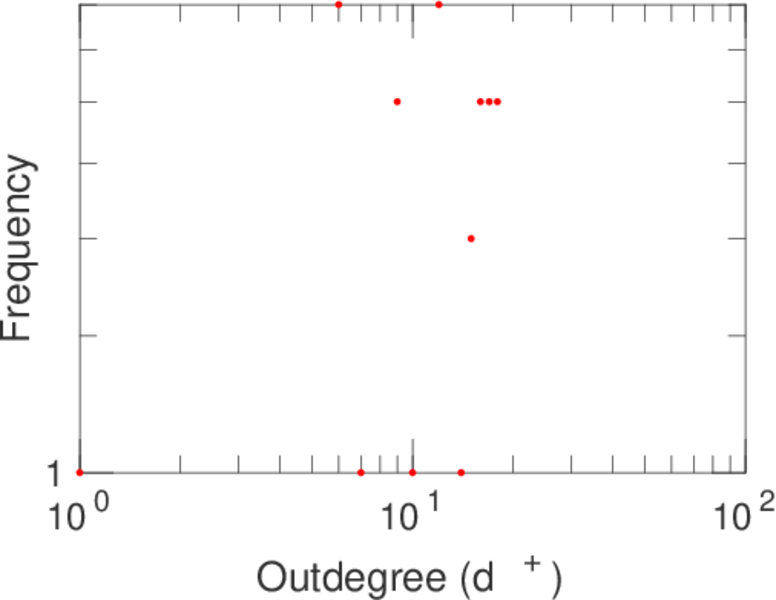
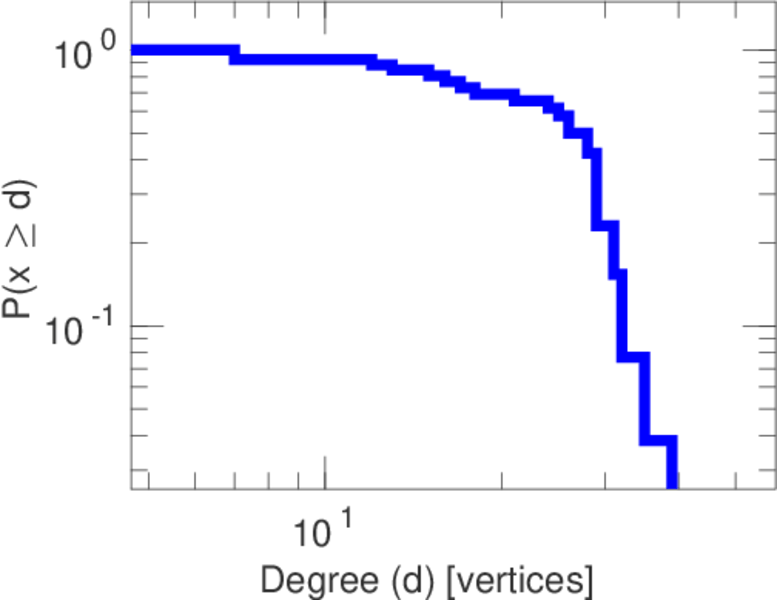
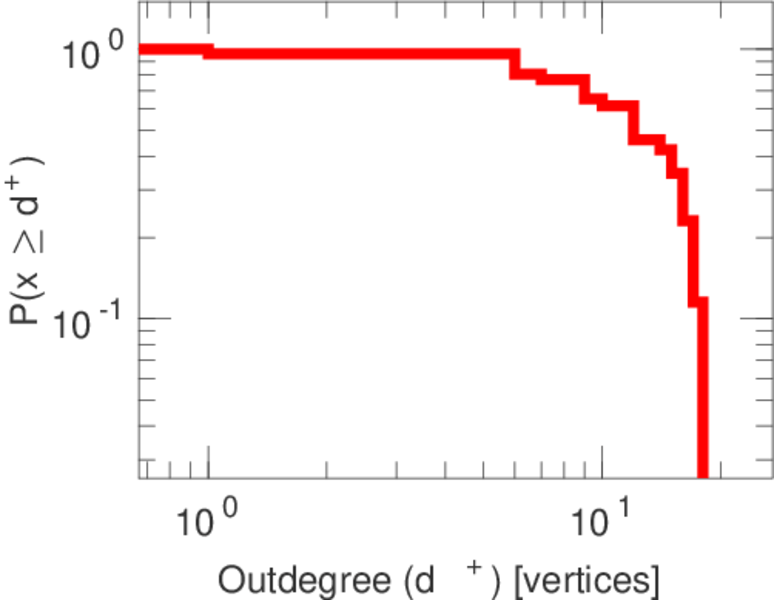
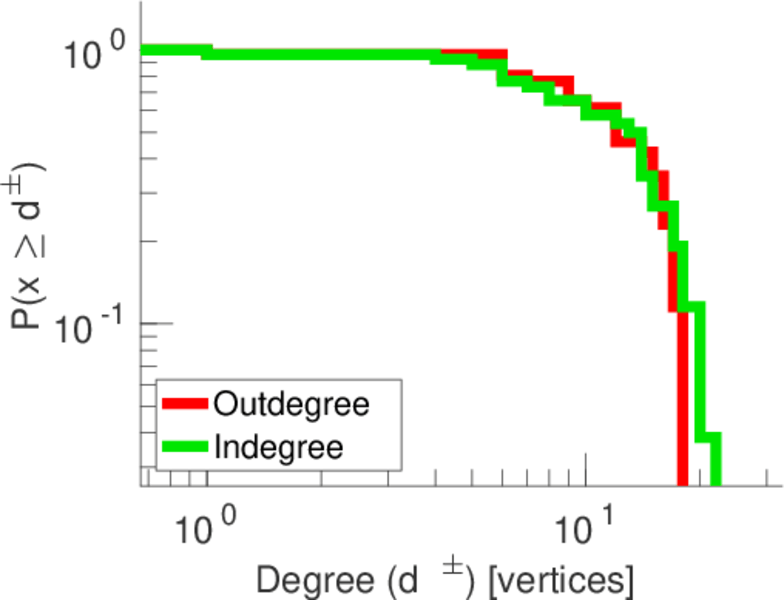
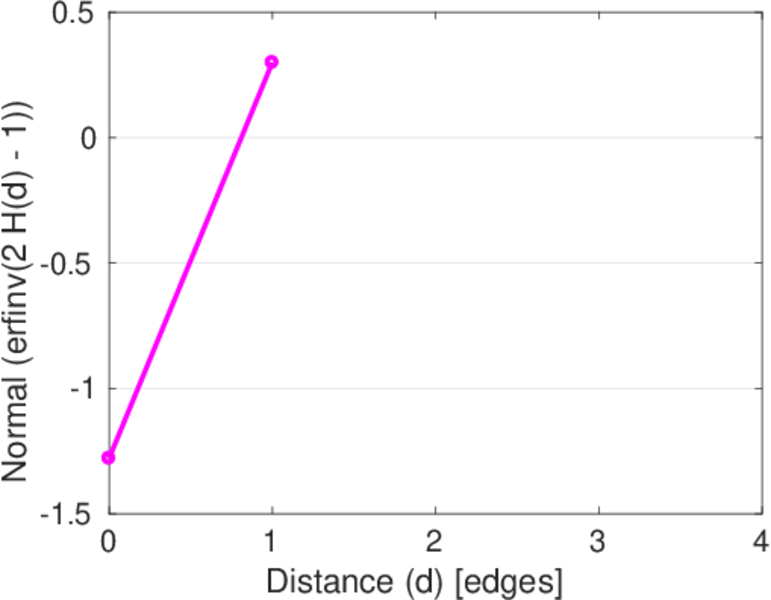
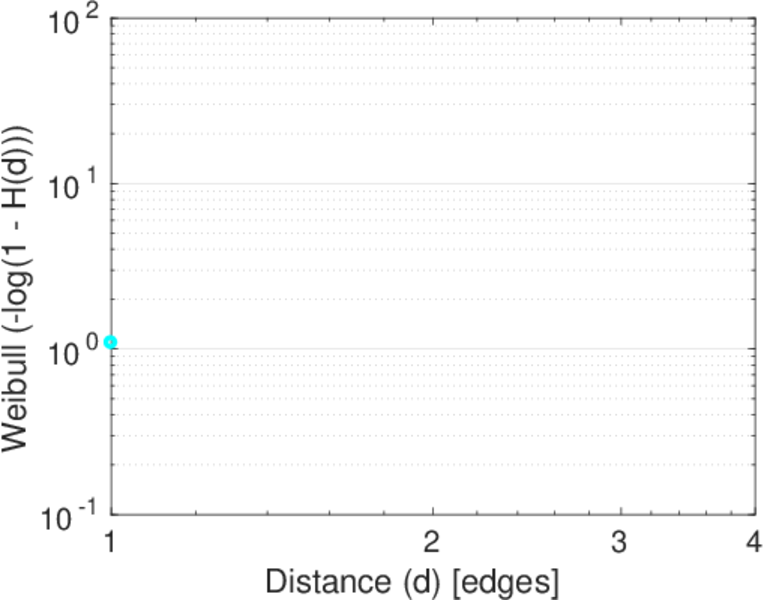
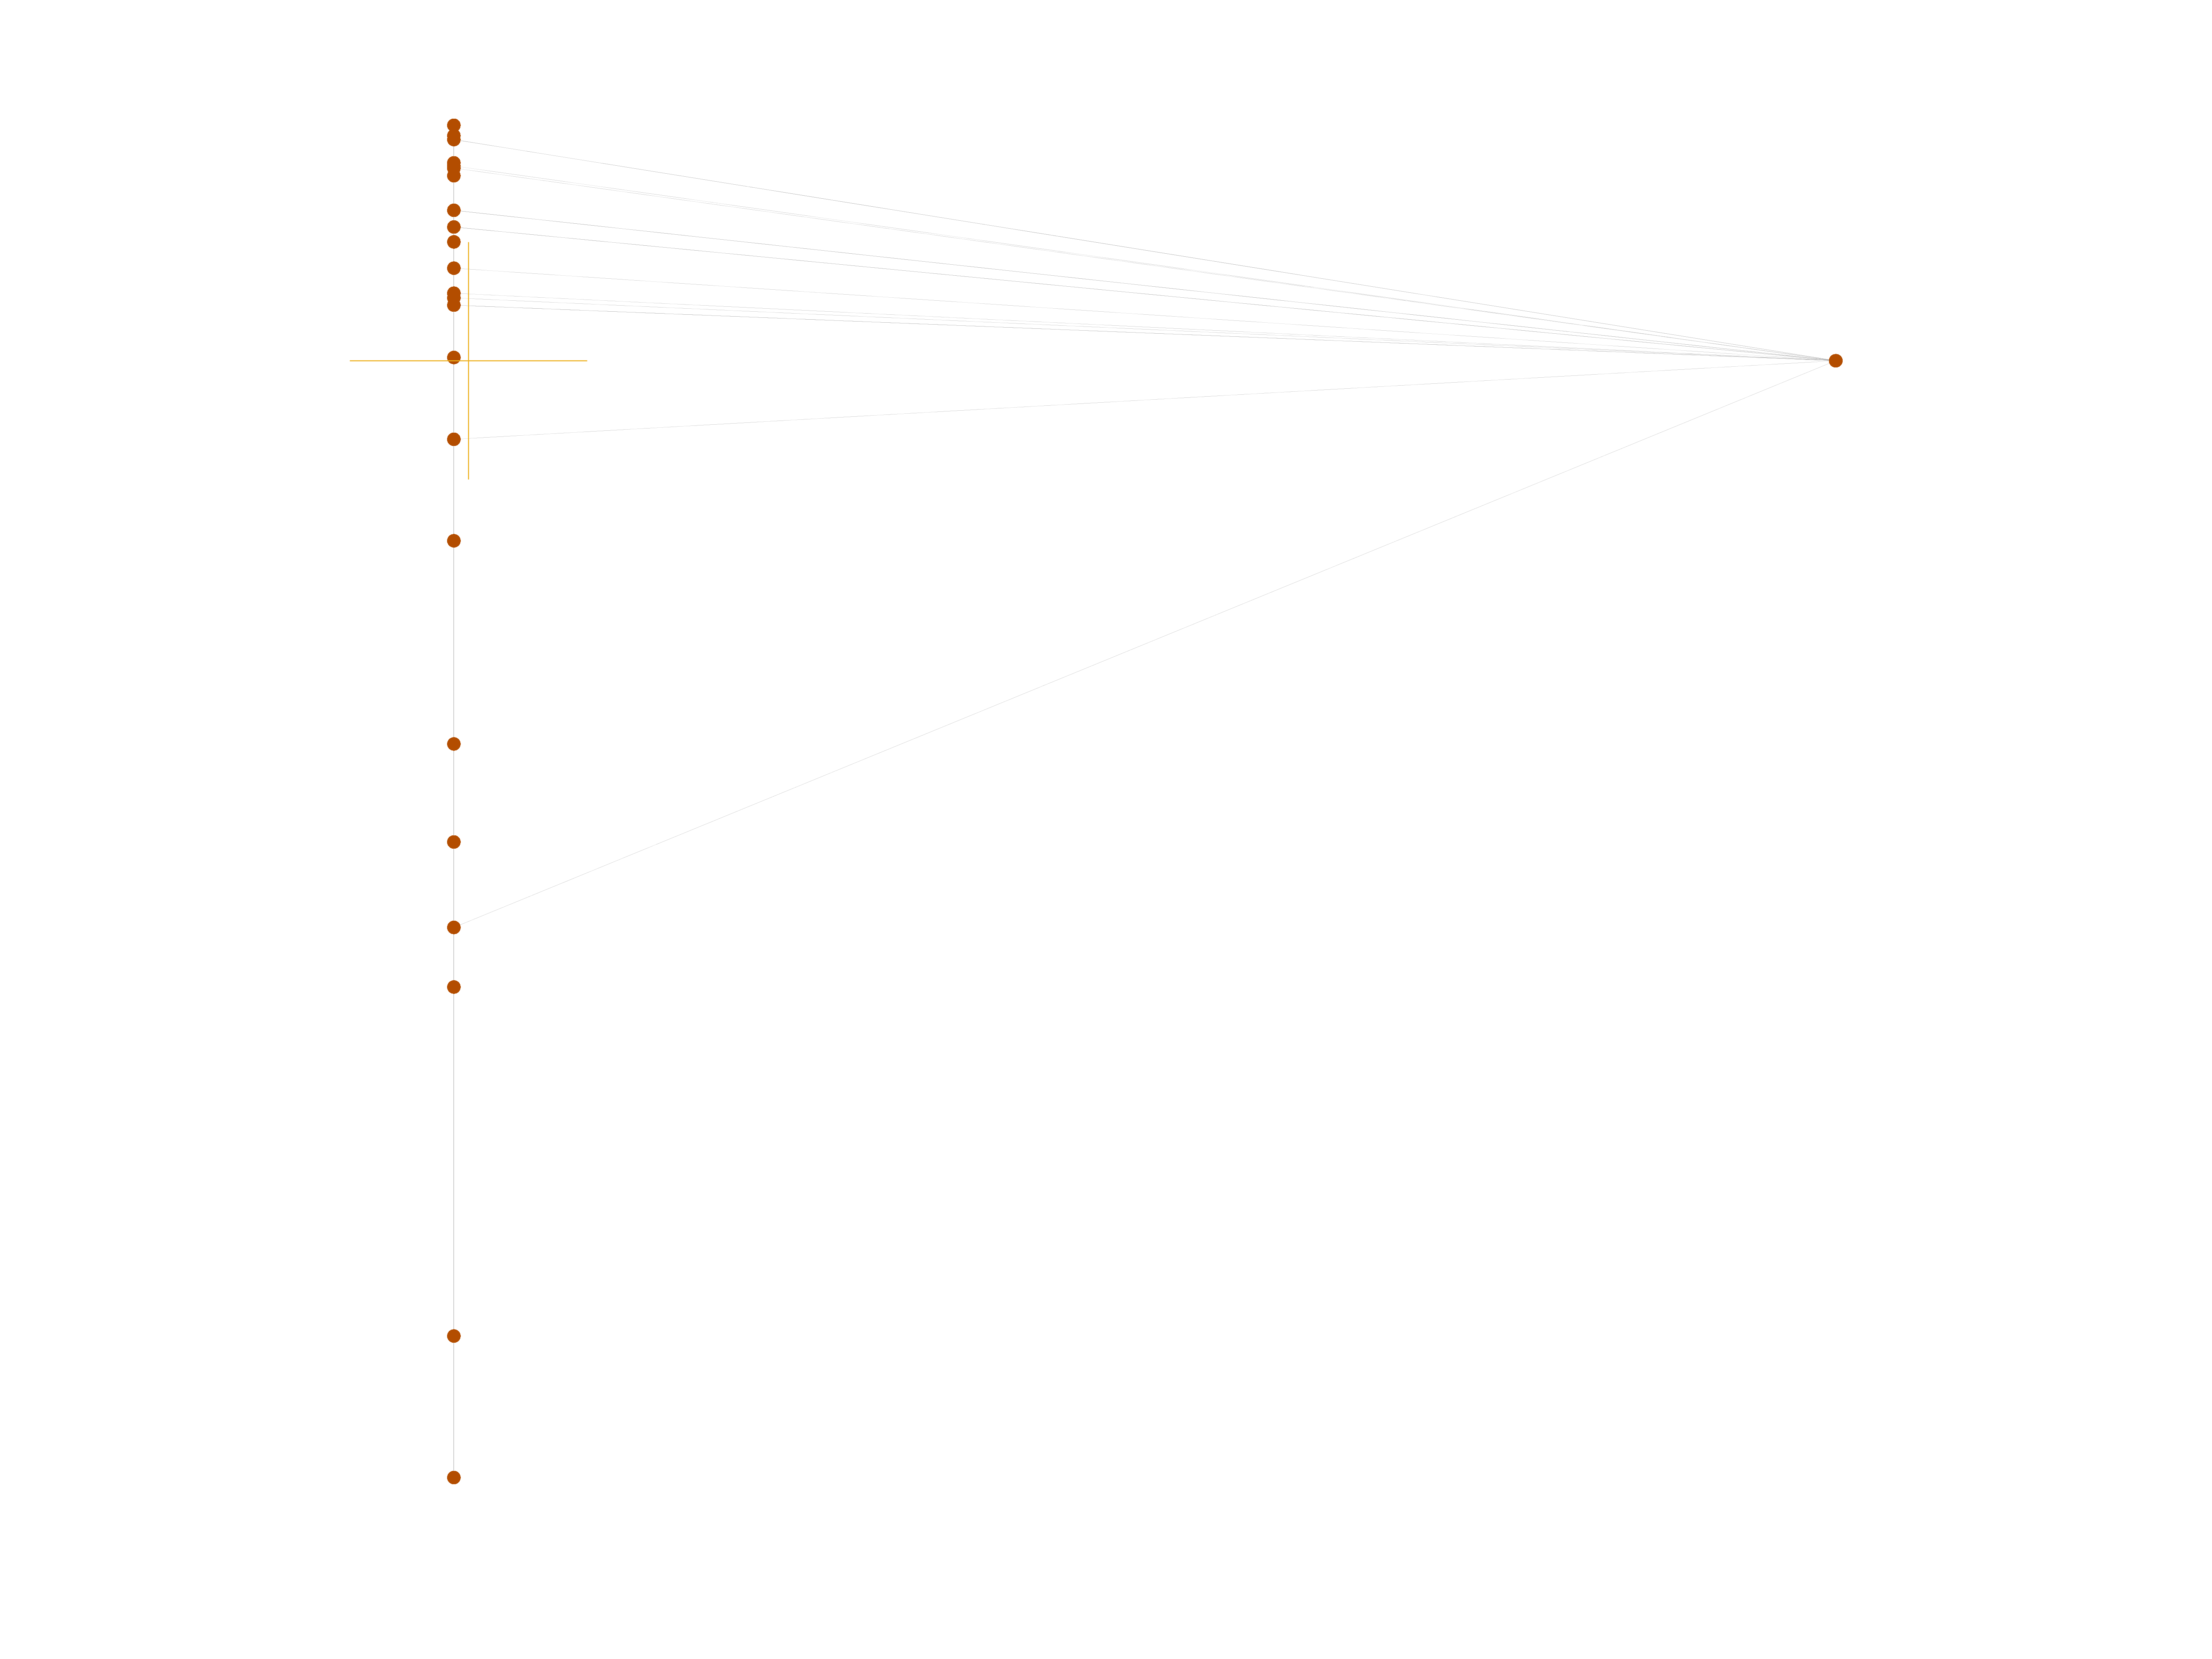
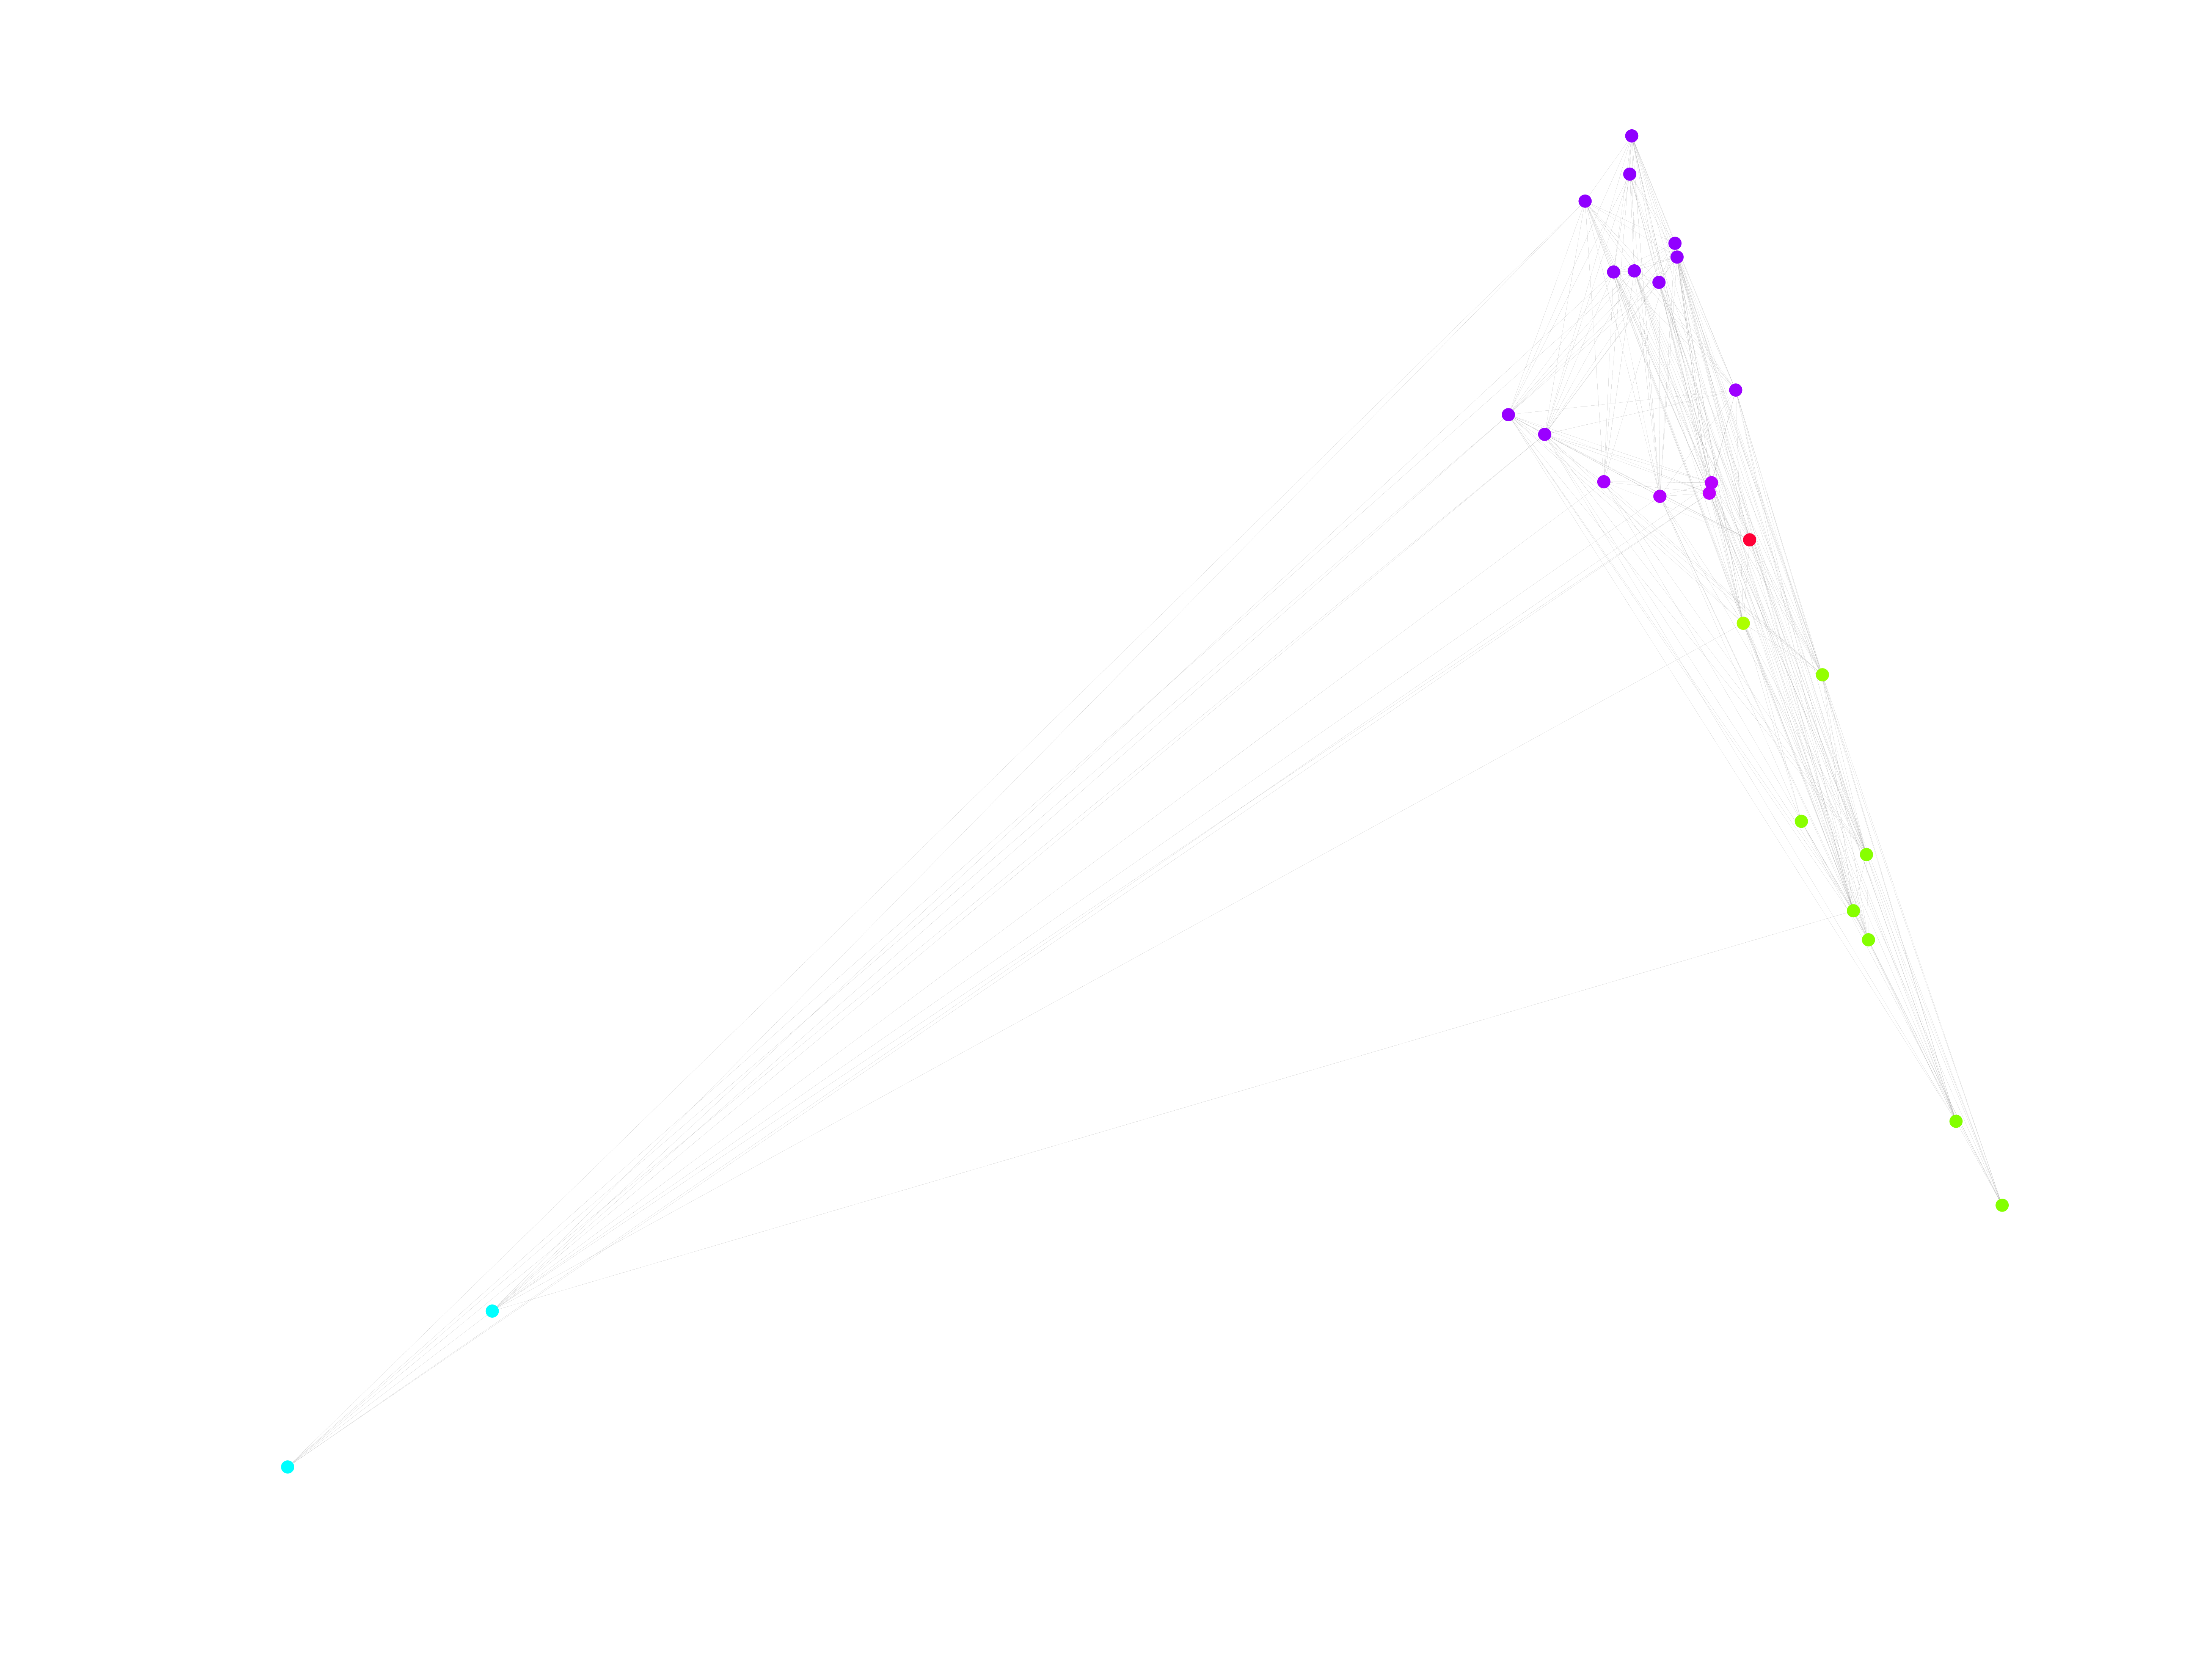
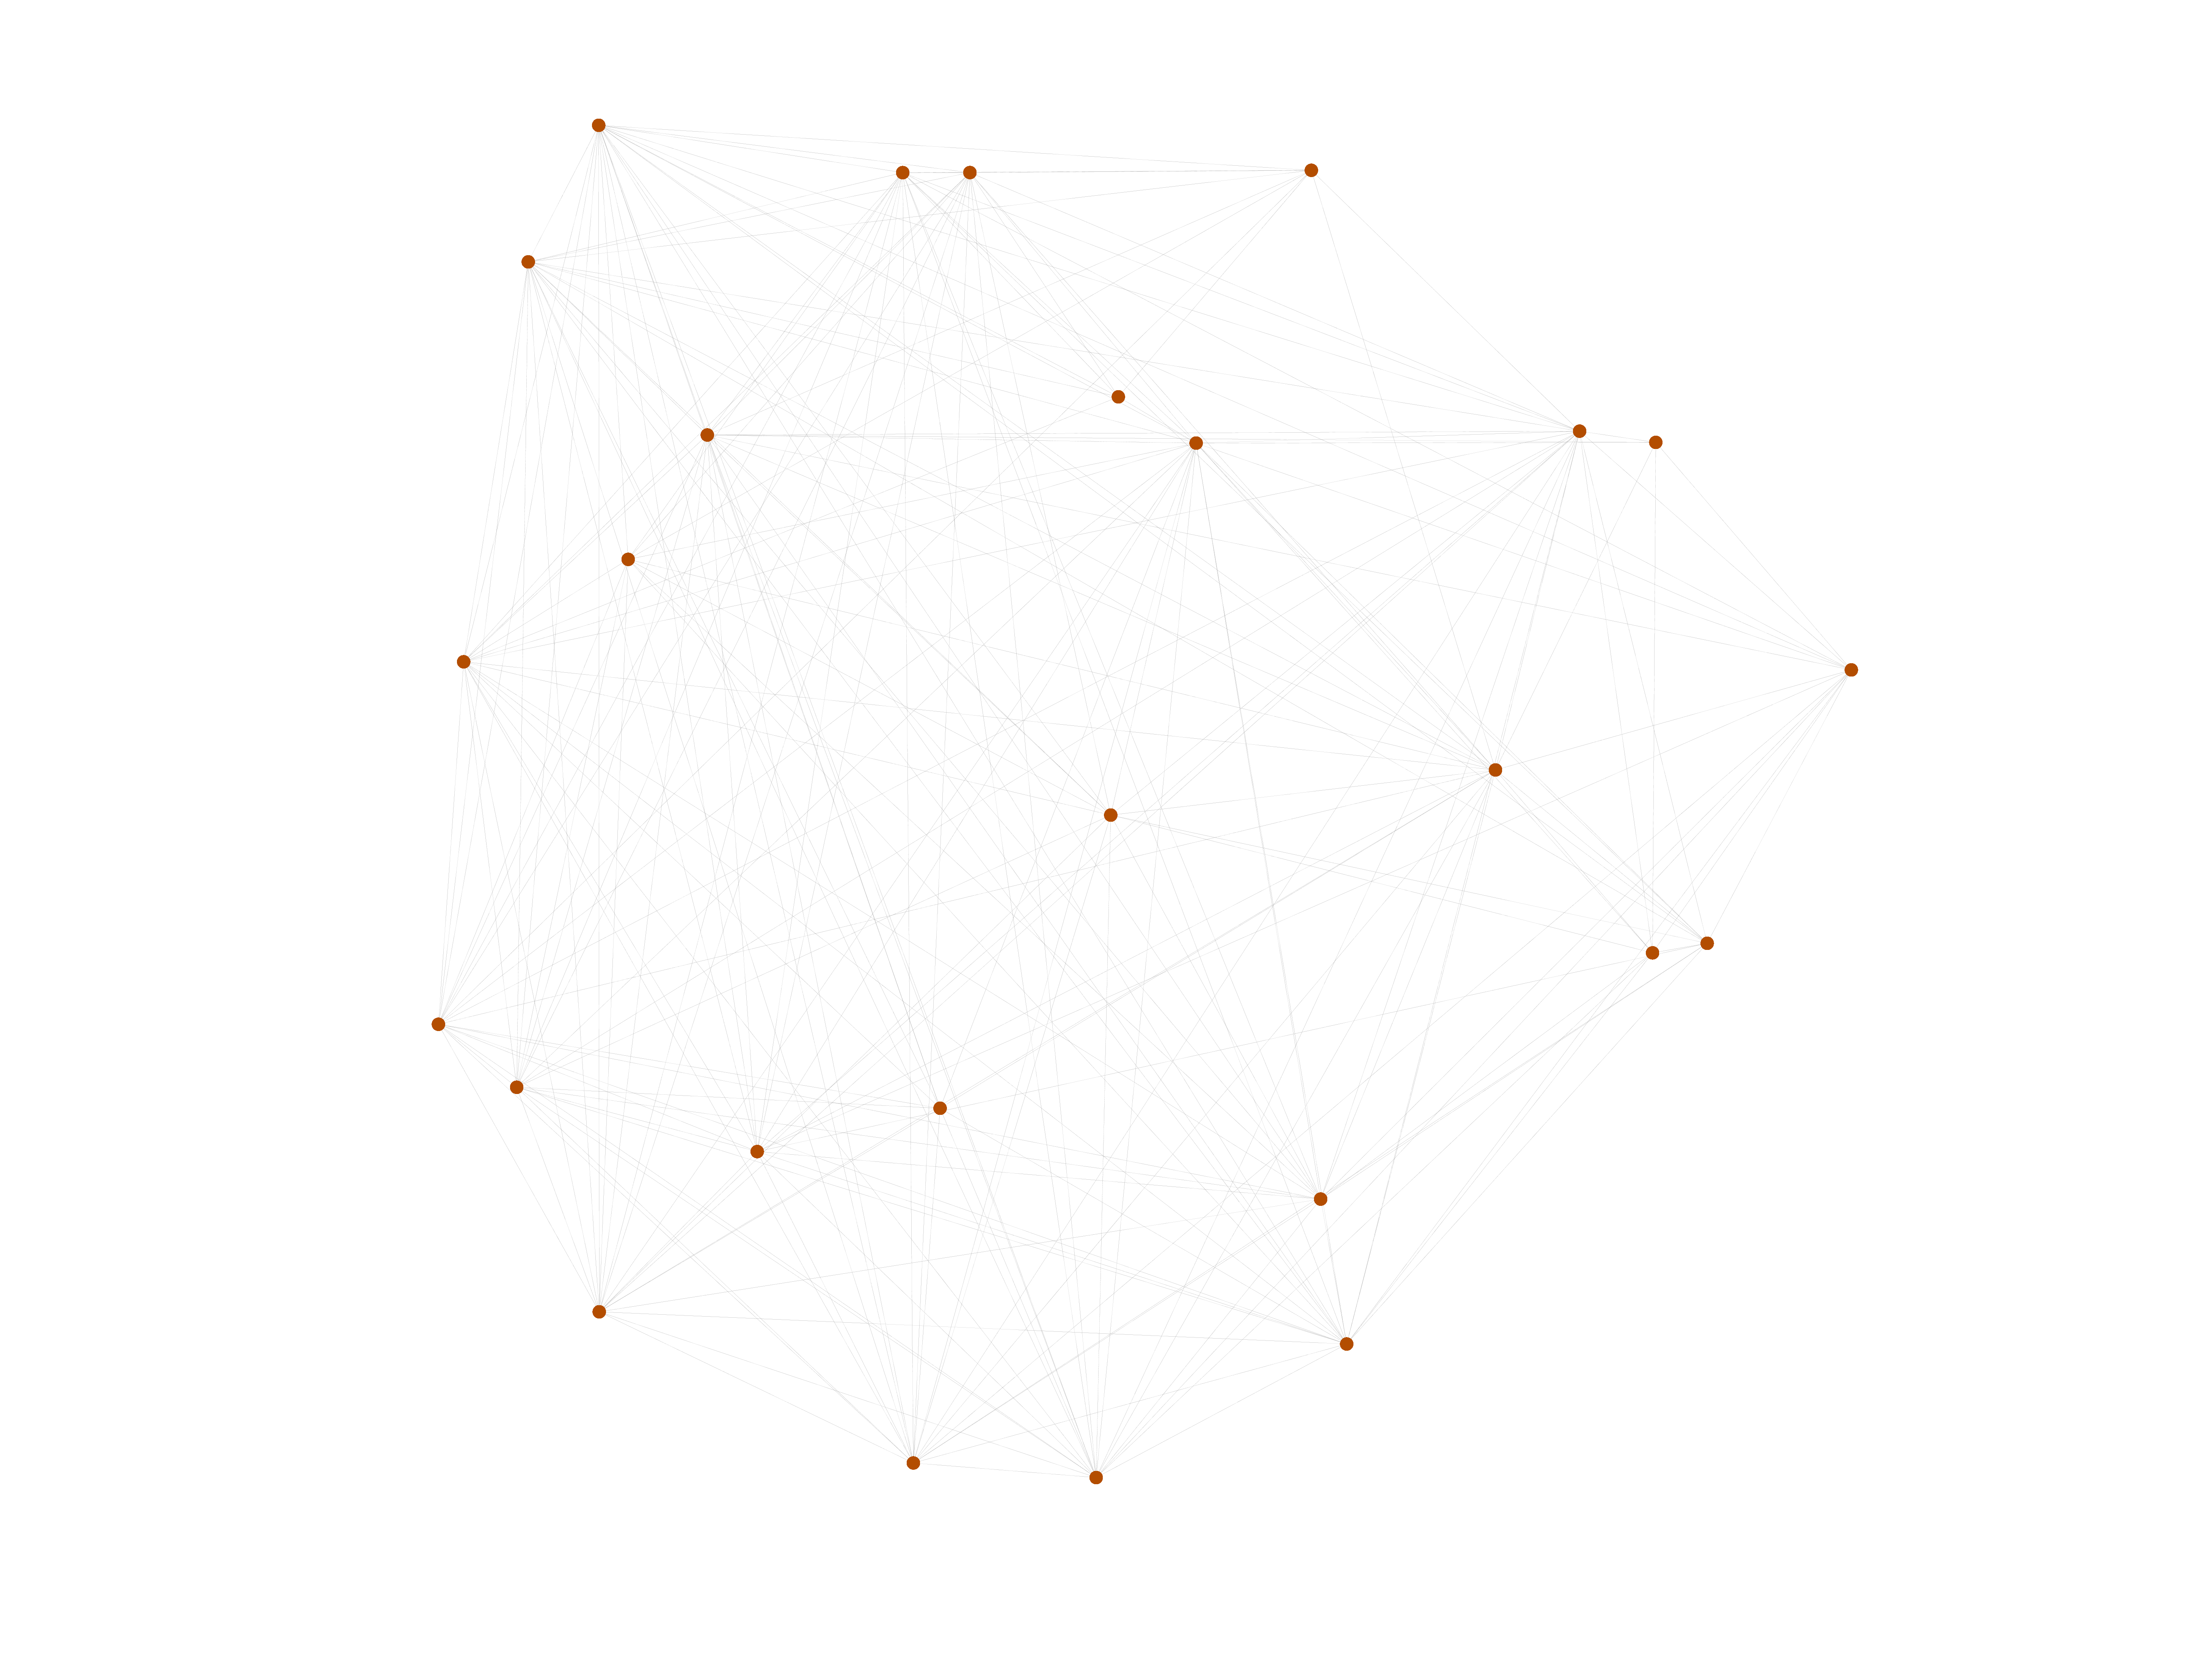
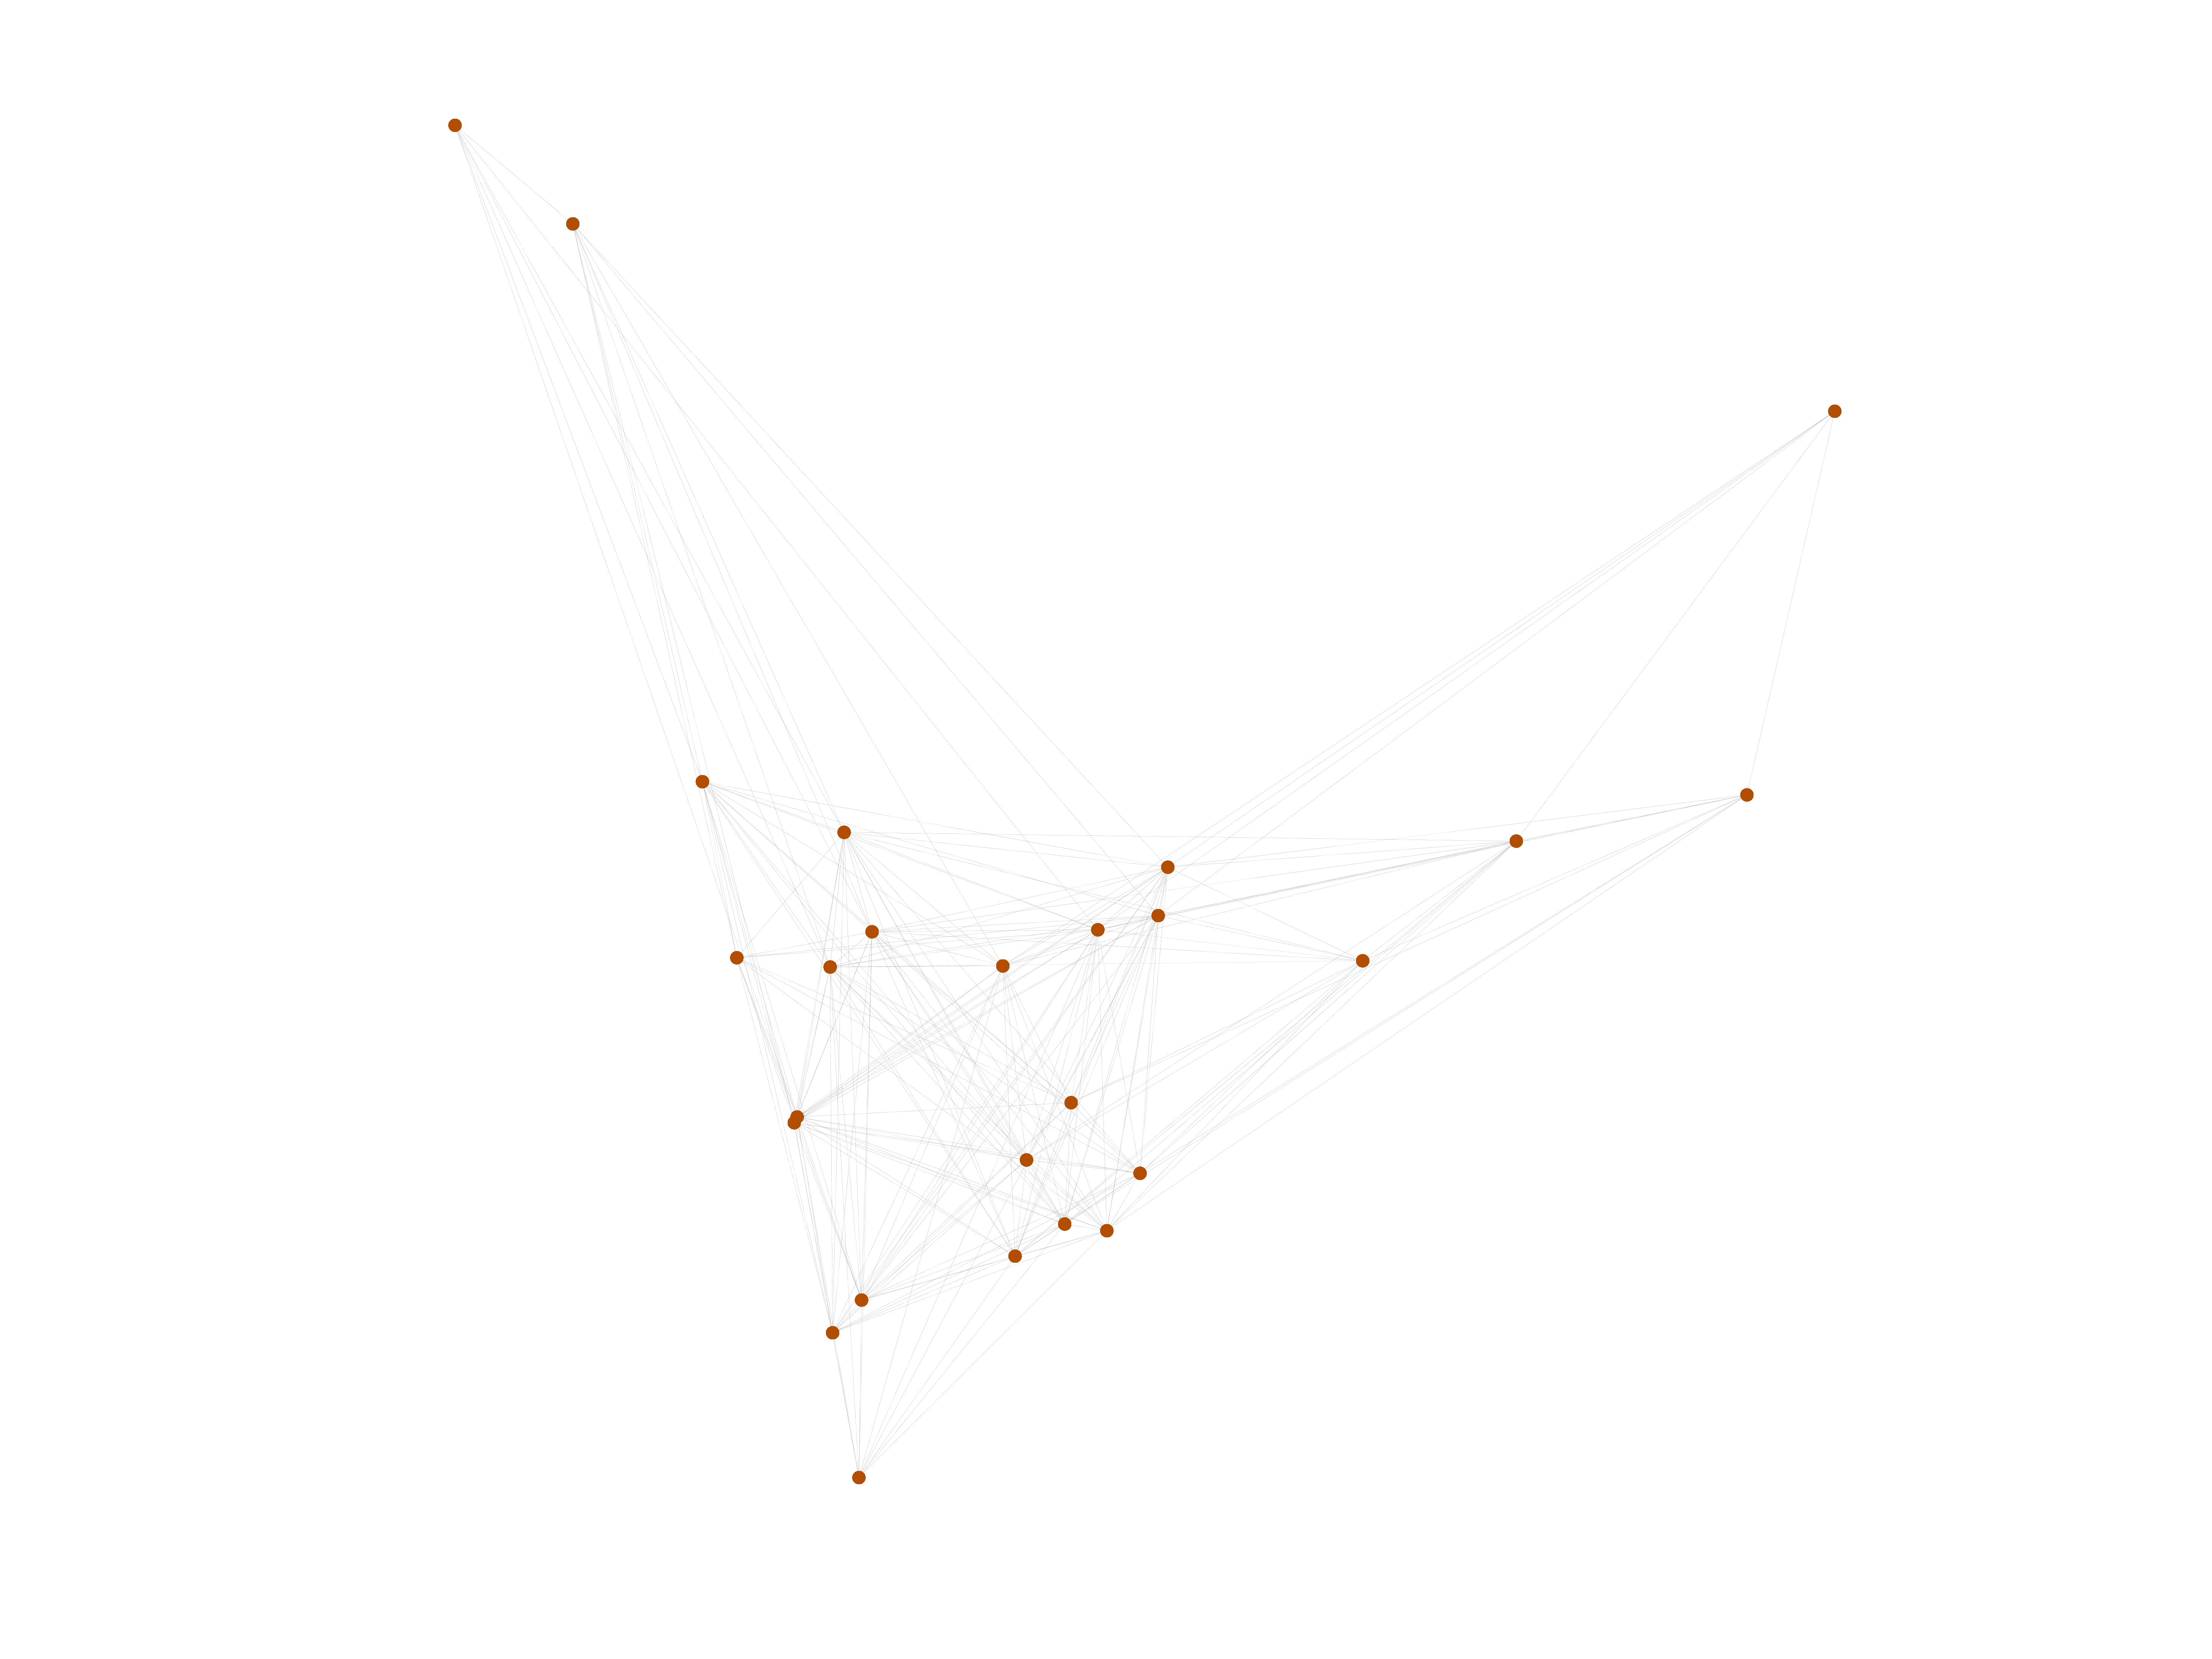
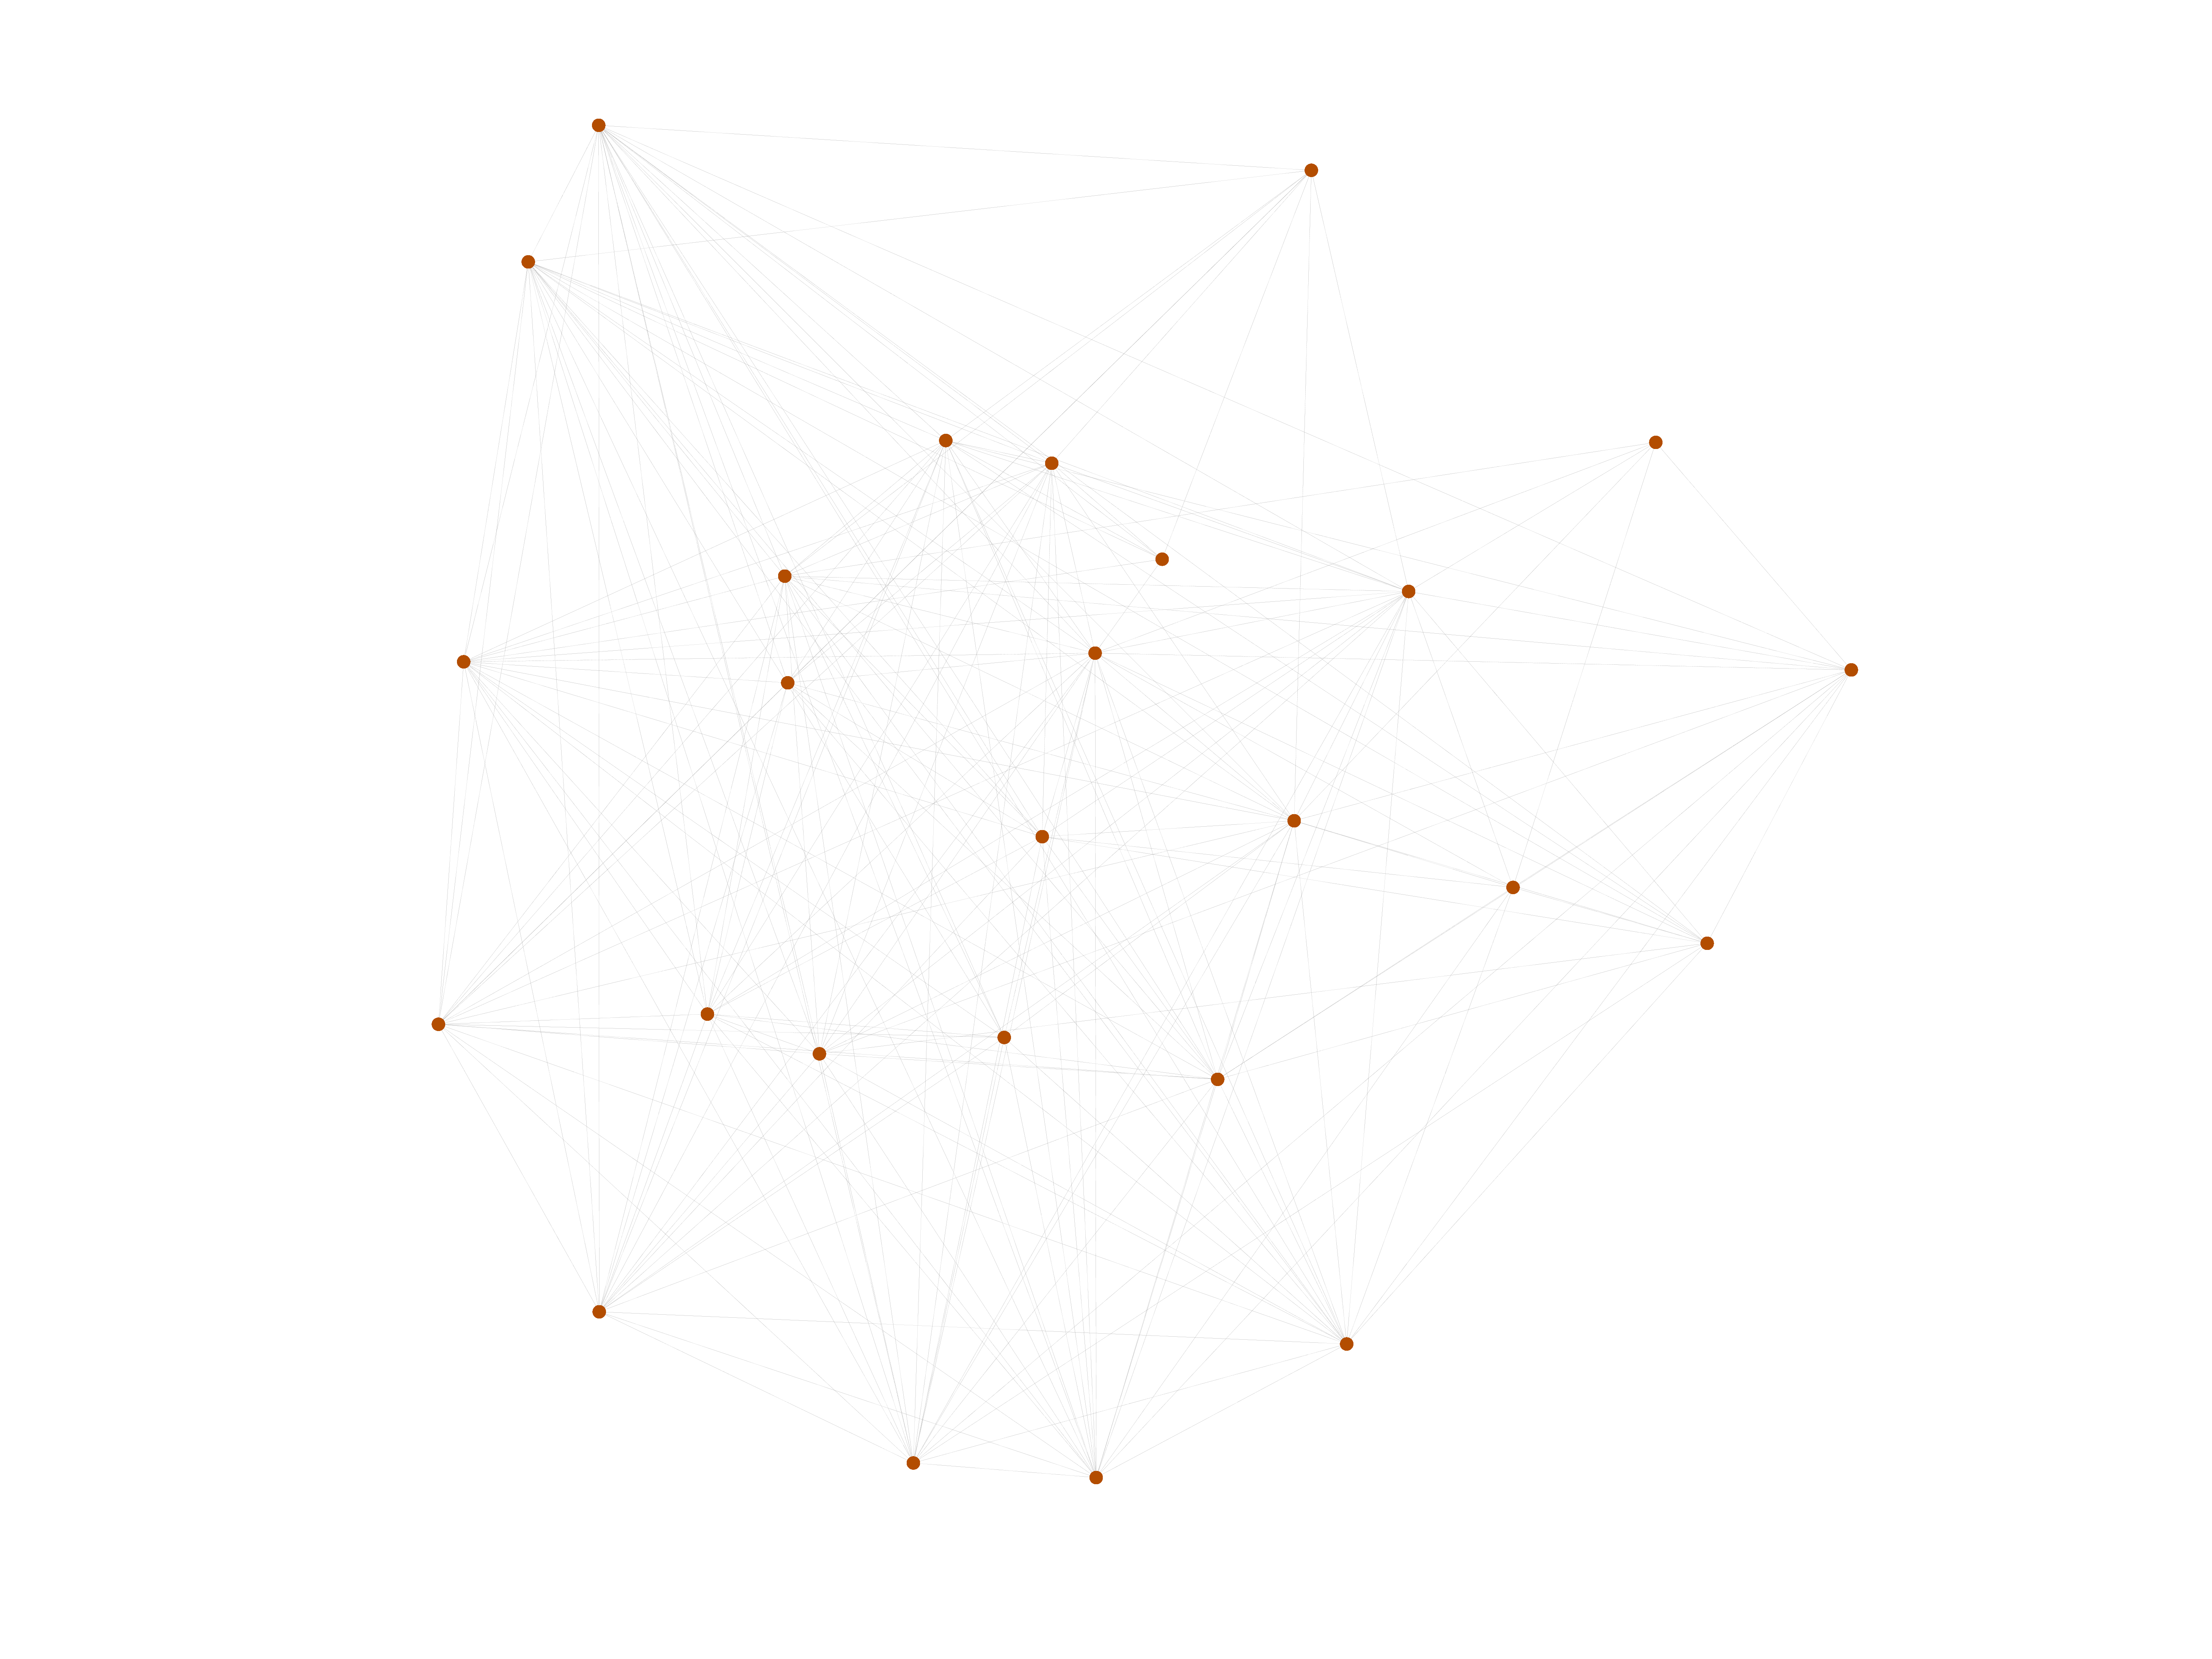
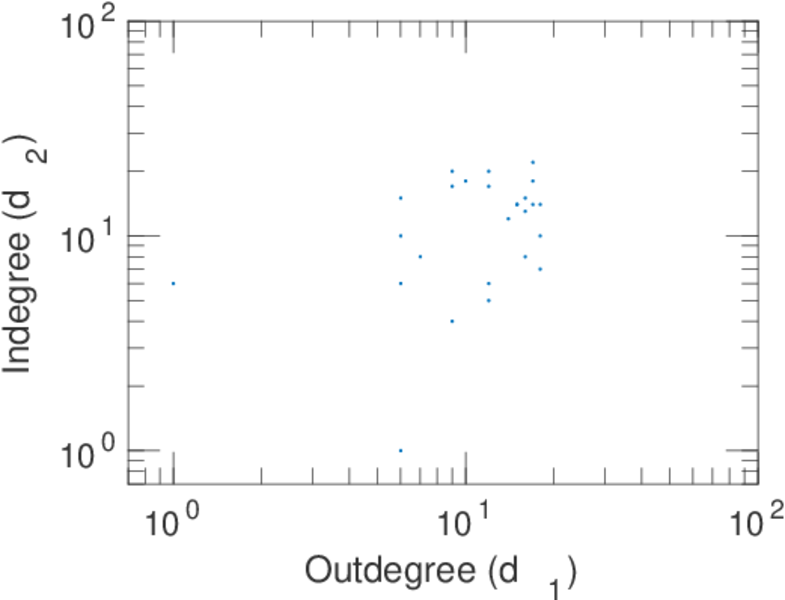
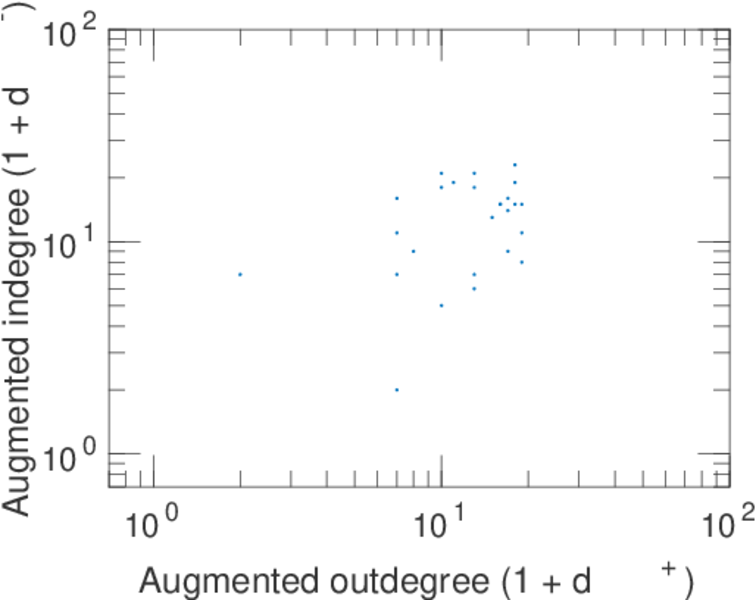
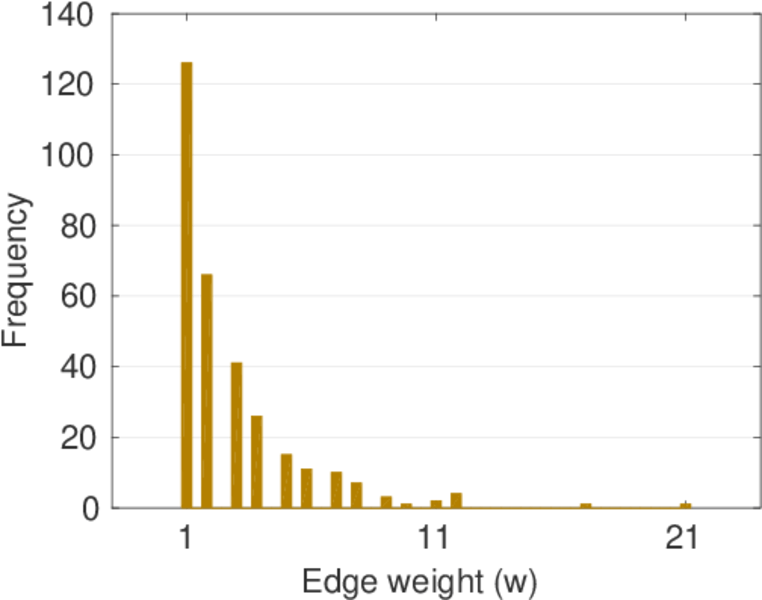
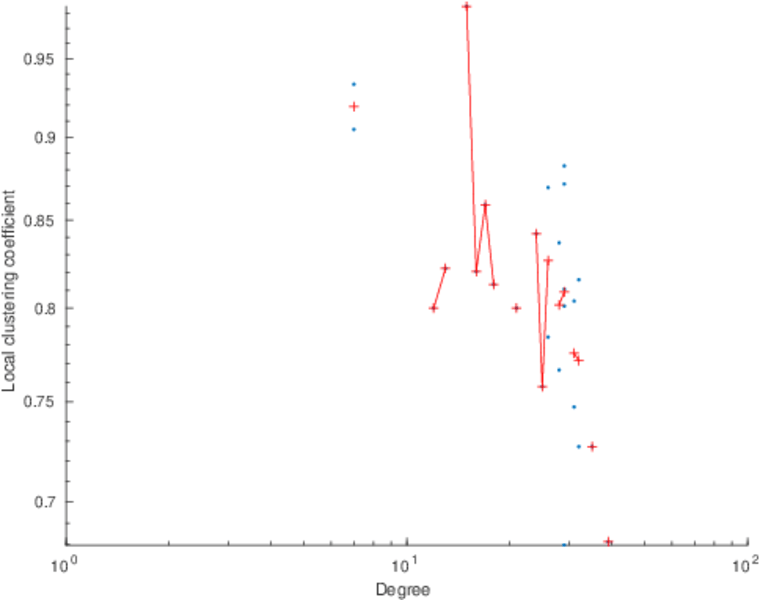
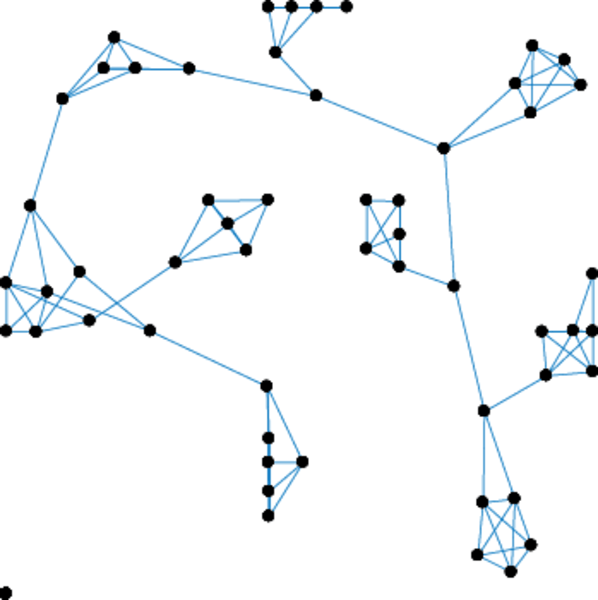
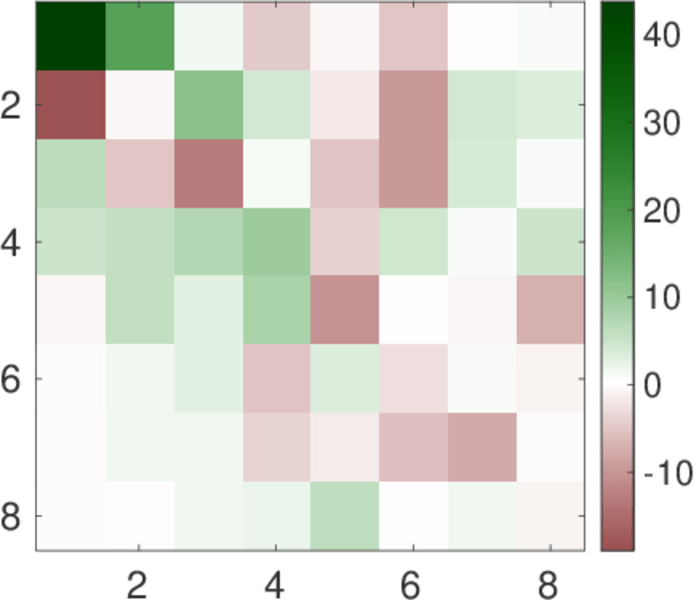
This directed network contains dominance between American bison (Bison bison) in 1972 on the National Bison Range in Moiese (Montana). A node represents a bison and an edge represents dominance of the left bison over the right bison. The edge values indicate how often this dominance behaviour was observed.
| Code | MB
| |
| Internal name | moreno_bison
| |
| Name | Bison | |
| Data source | http://moreno.ss.uci.edu/data.html#bison | |
| Availability | Dataset is available for download | |
| Consistency check | Dataset passed all tests | |
| Category | Animal network | |
| Dataset timestamp | 1972-07-25 ⋯ 1972-08-14 | |
| Node meaning | Bison | |
| Edge meaning | Dominance | |
| Network format | Unipartite, directed | |
| Edge type | Positive weights, no multiple edges | |
| Reciprocal | Contains reciprocal edges | |
| Directed cycles | Contains directed cycles | |
| Loops | Does not contain loops | |
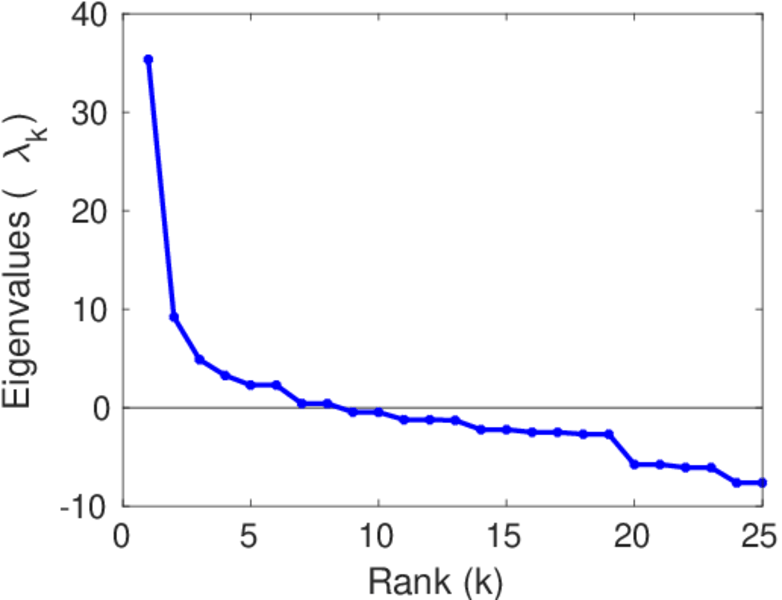
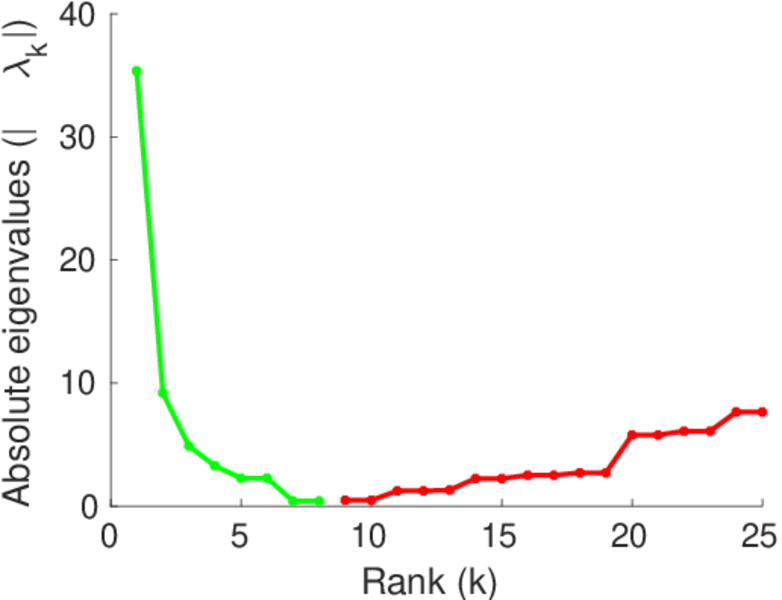
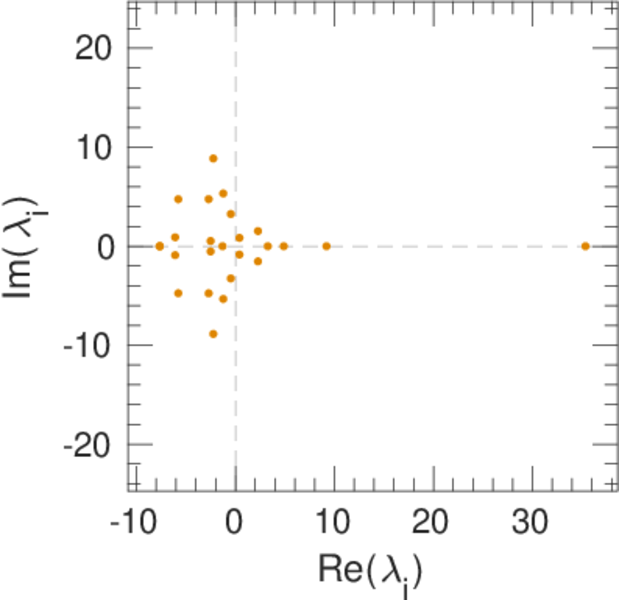
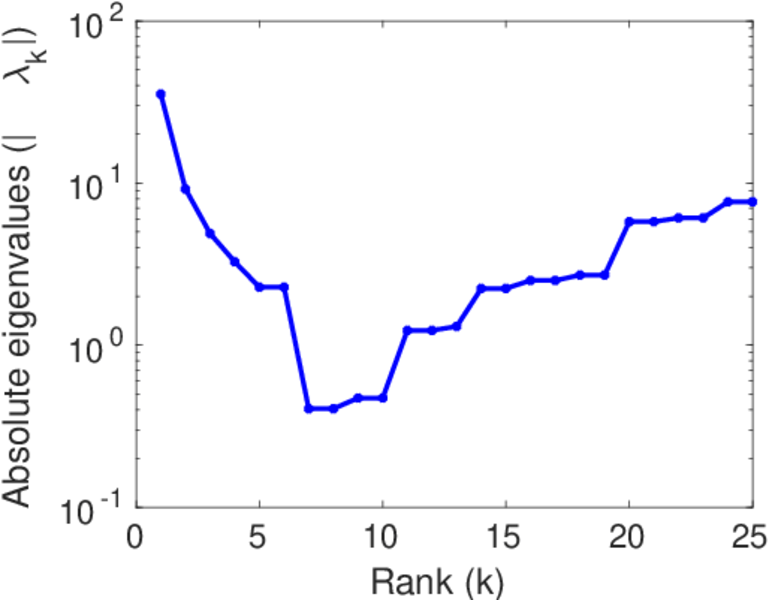
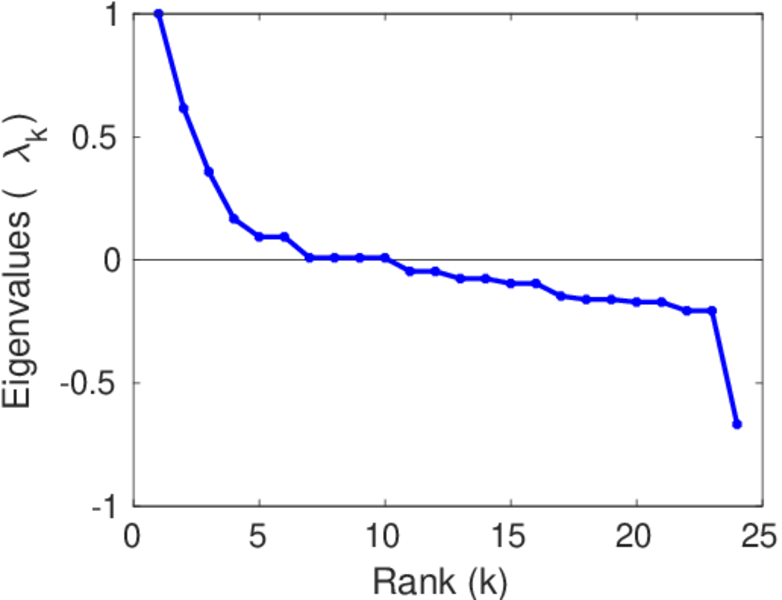
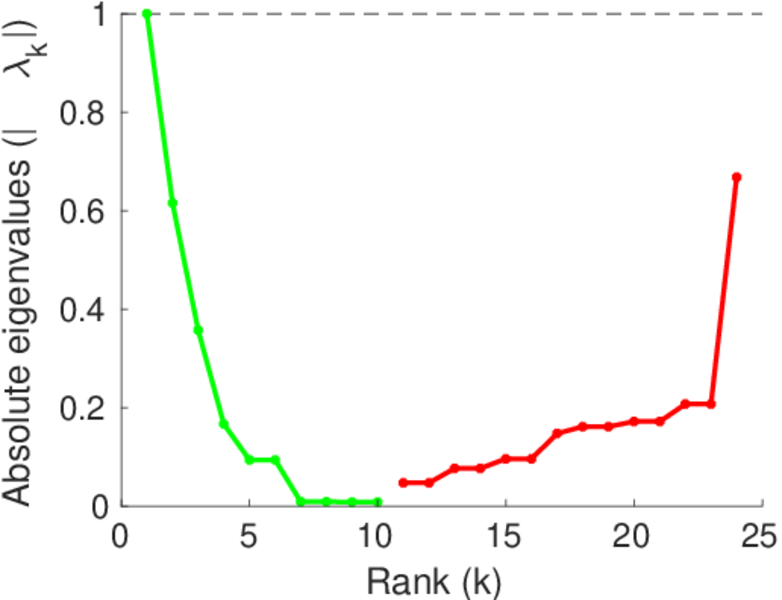
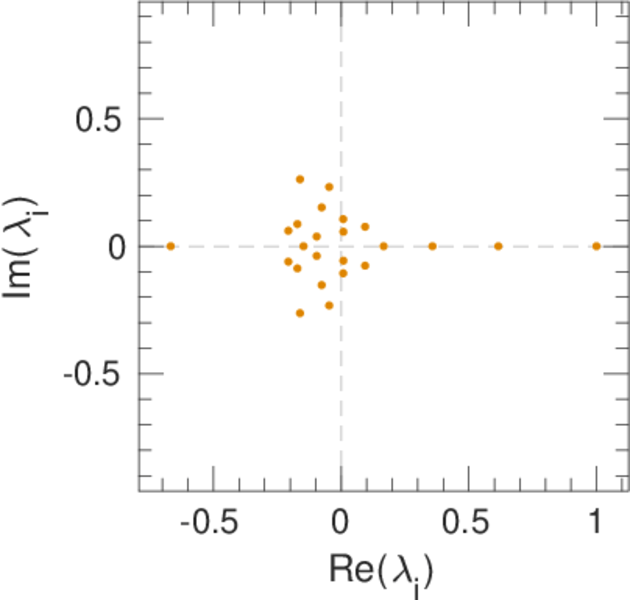
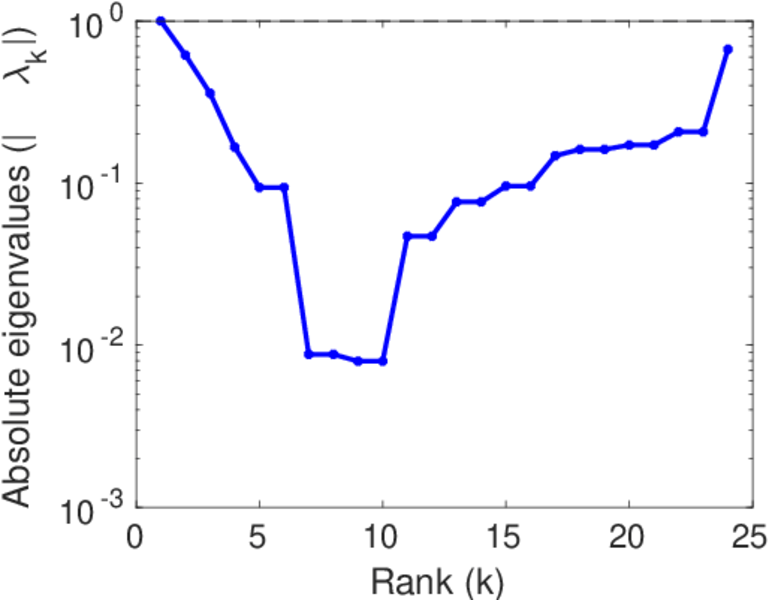
| Skew-symmetry | Inverted edges can be interpreted as negated edges |


| [1] | Jérôme Kunegis. KONECT – The Koblenz Network Collection. In Proc. Int. Conf. on World Wide Web Companion, pages 1343–1350, 2013. [ http ] |
| [2] | Dale F. Lott. Dominance relations and breeding rate in mature male American bison. Z. für Tierpsychol., 49(4):418–432, 1979. |