 KONECT ‣ Networks ‣
Buy Me a Coffee
KONECT ‣ Networks ‣
Buy Me a Coffee
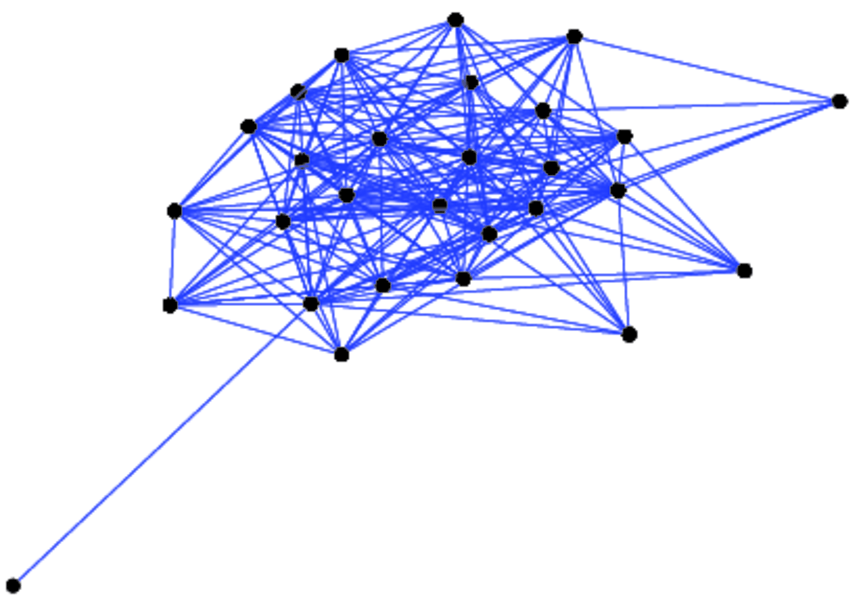
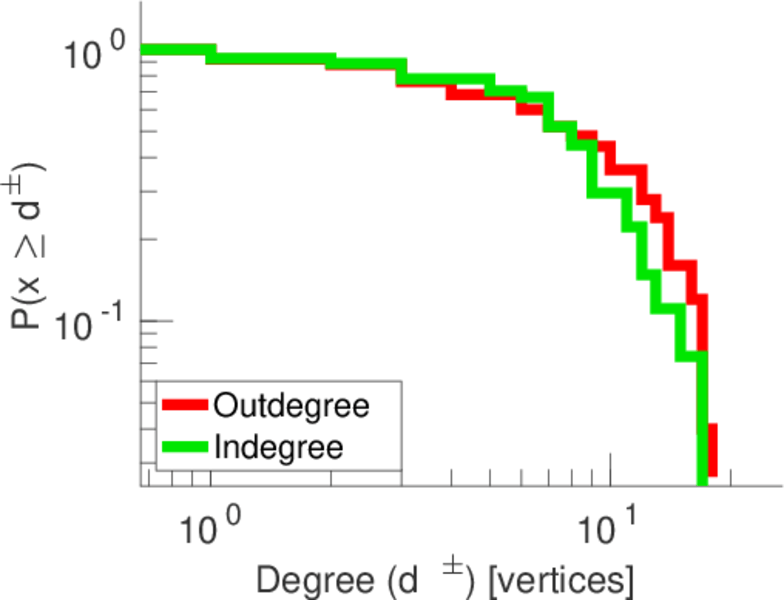
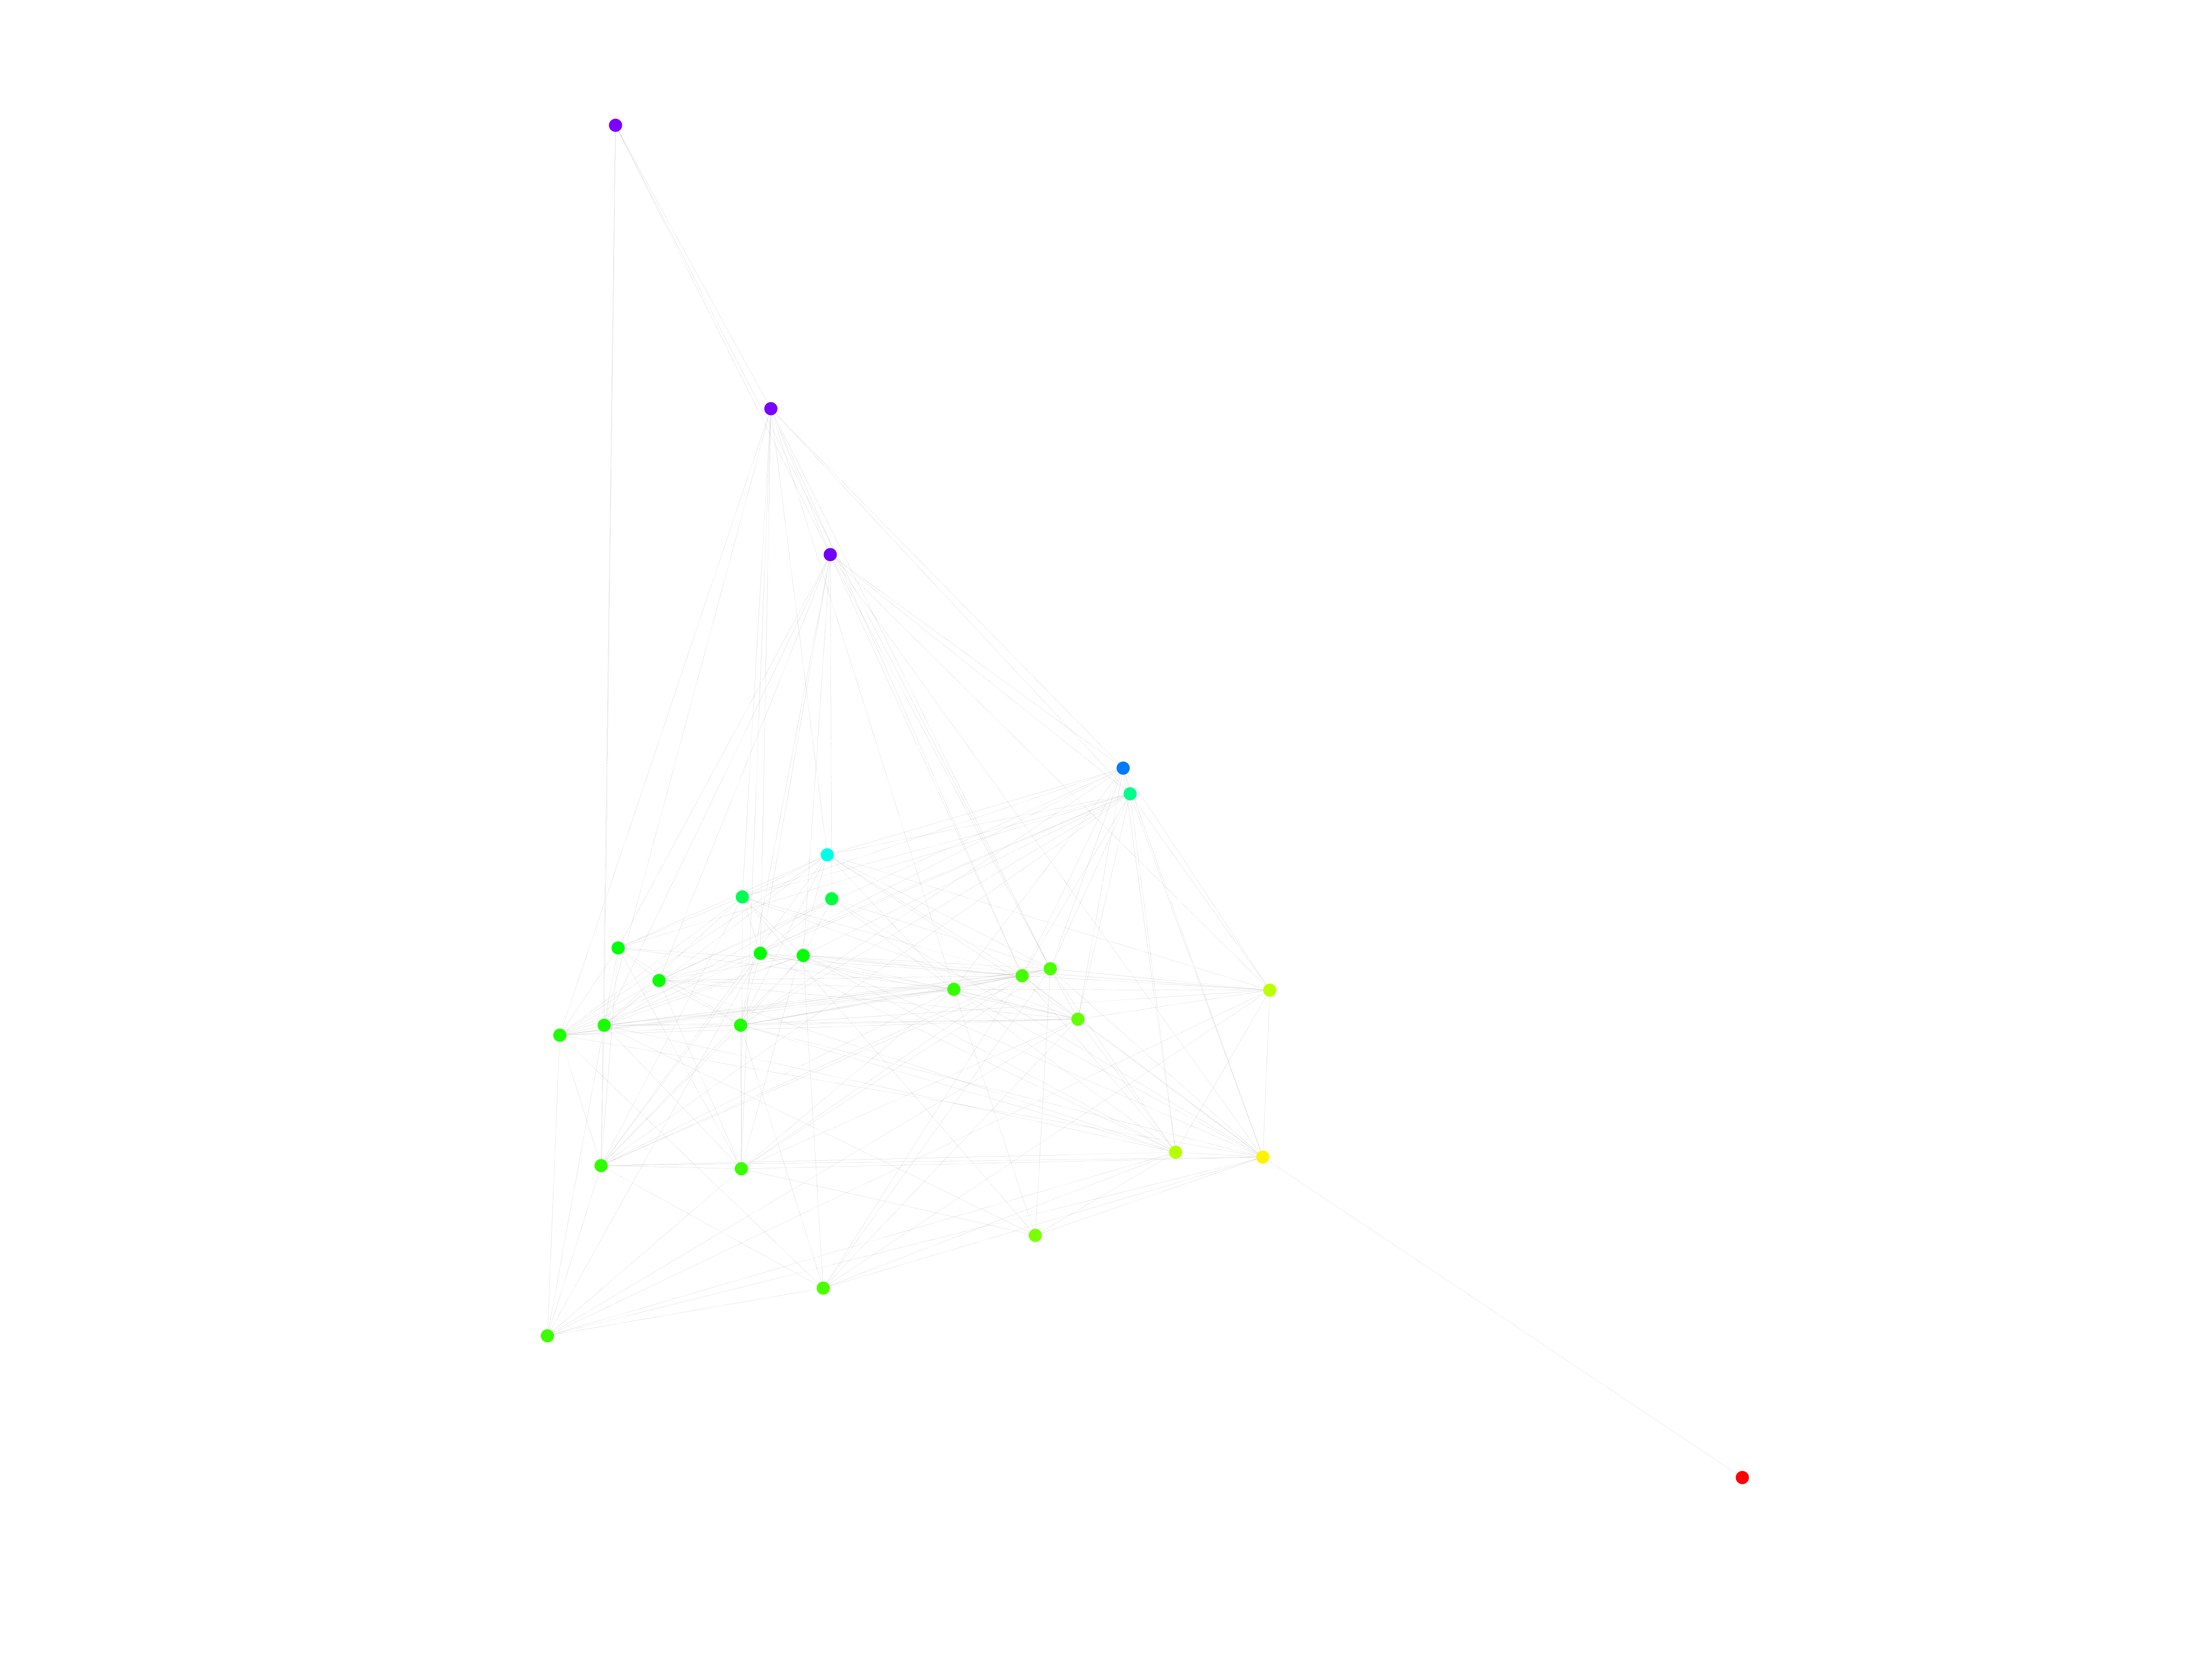
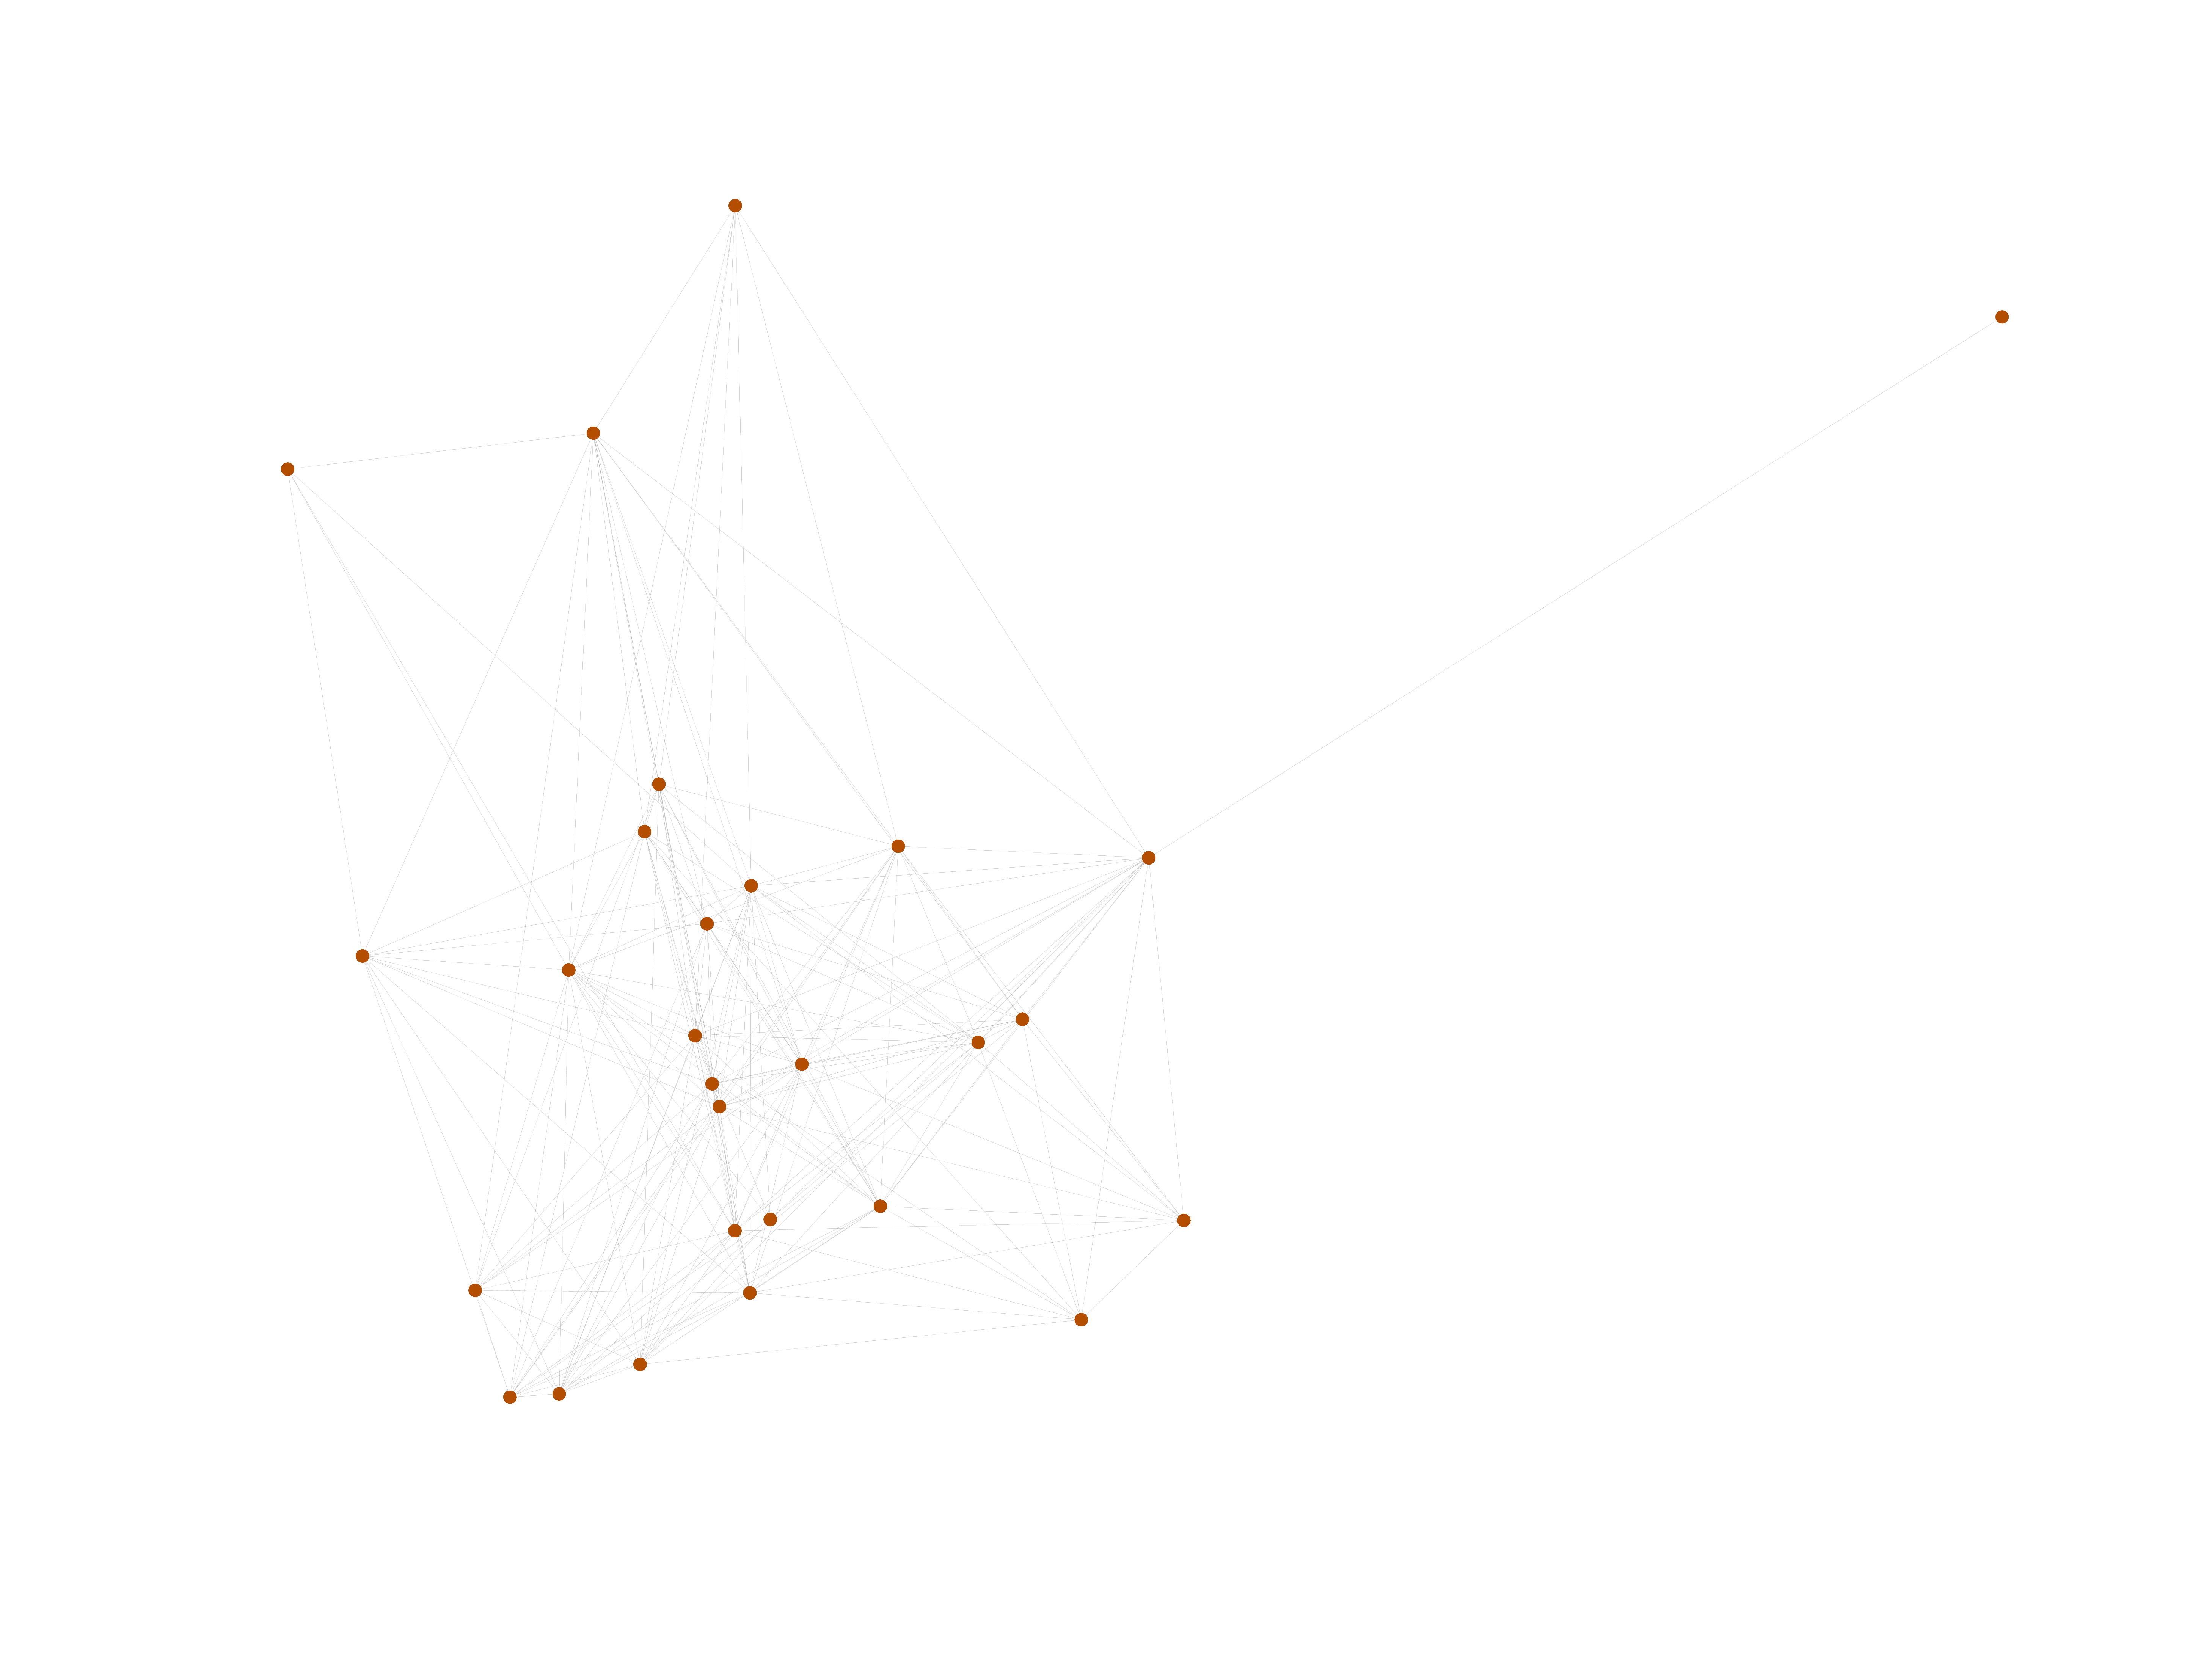
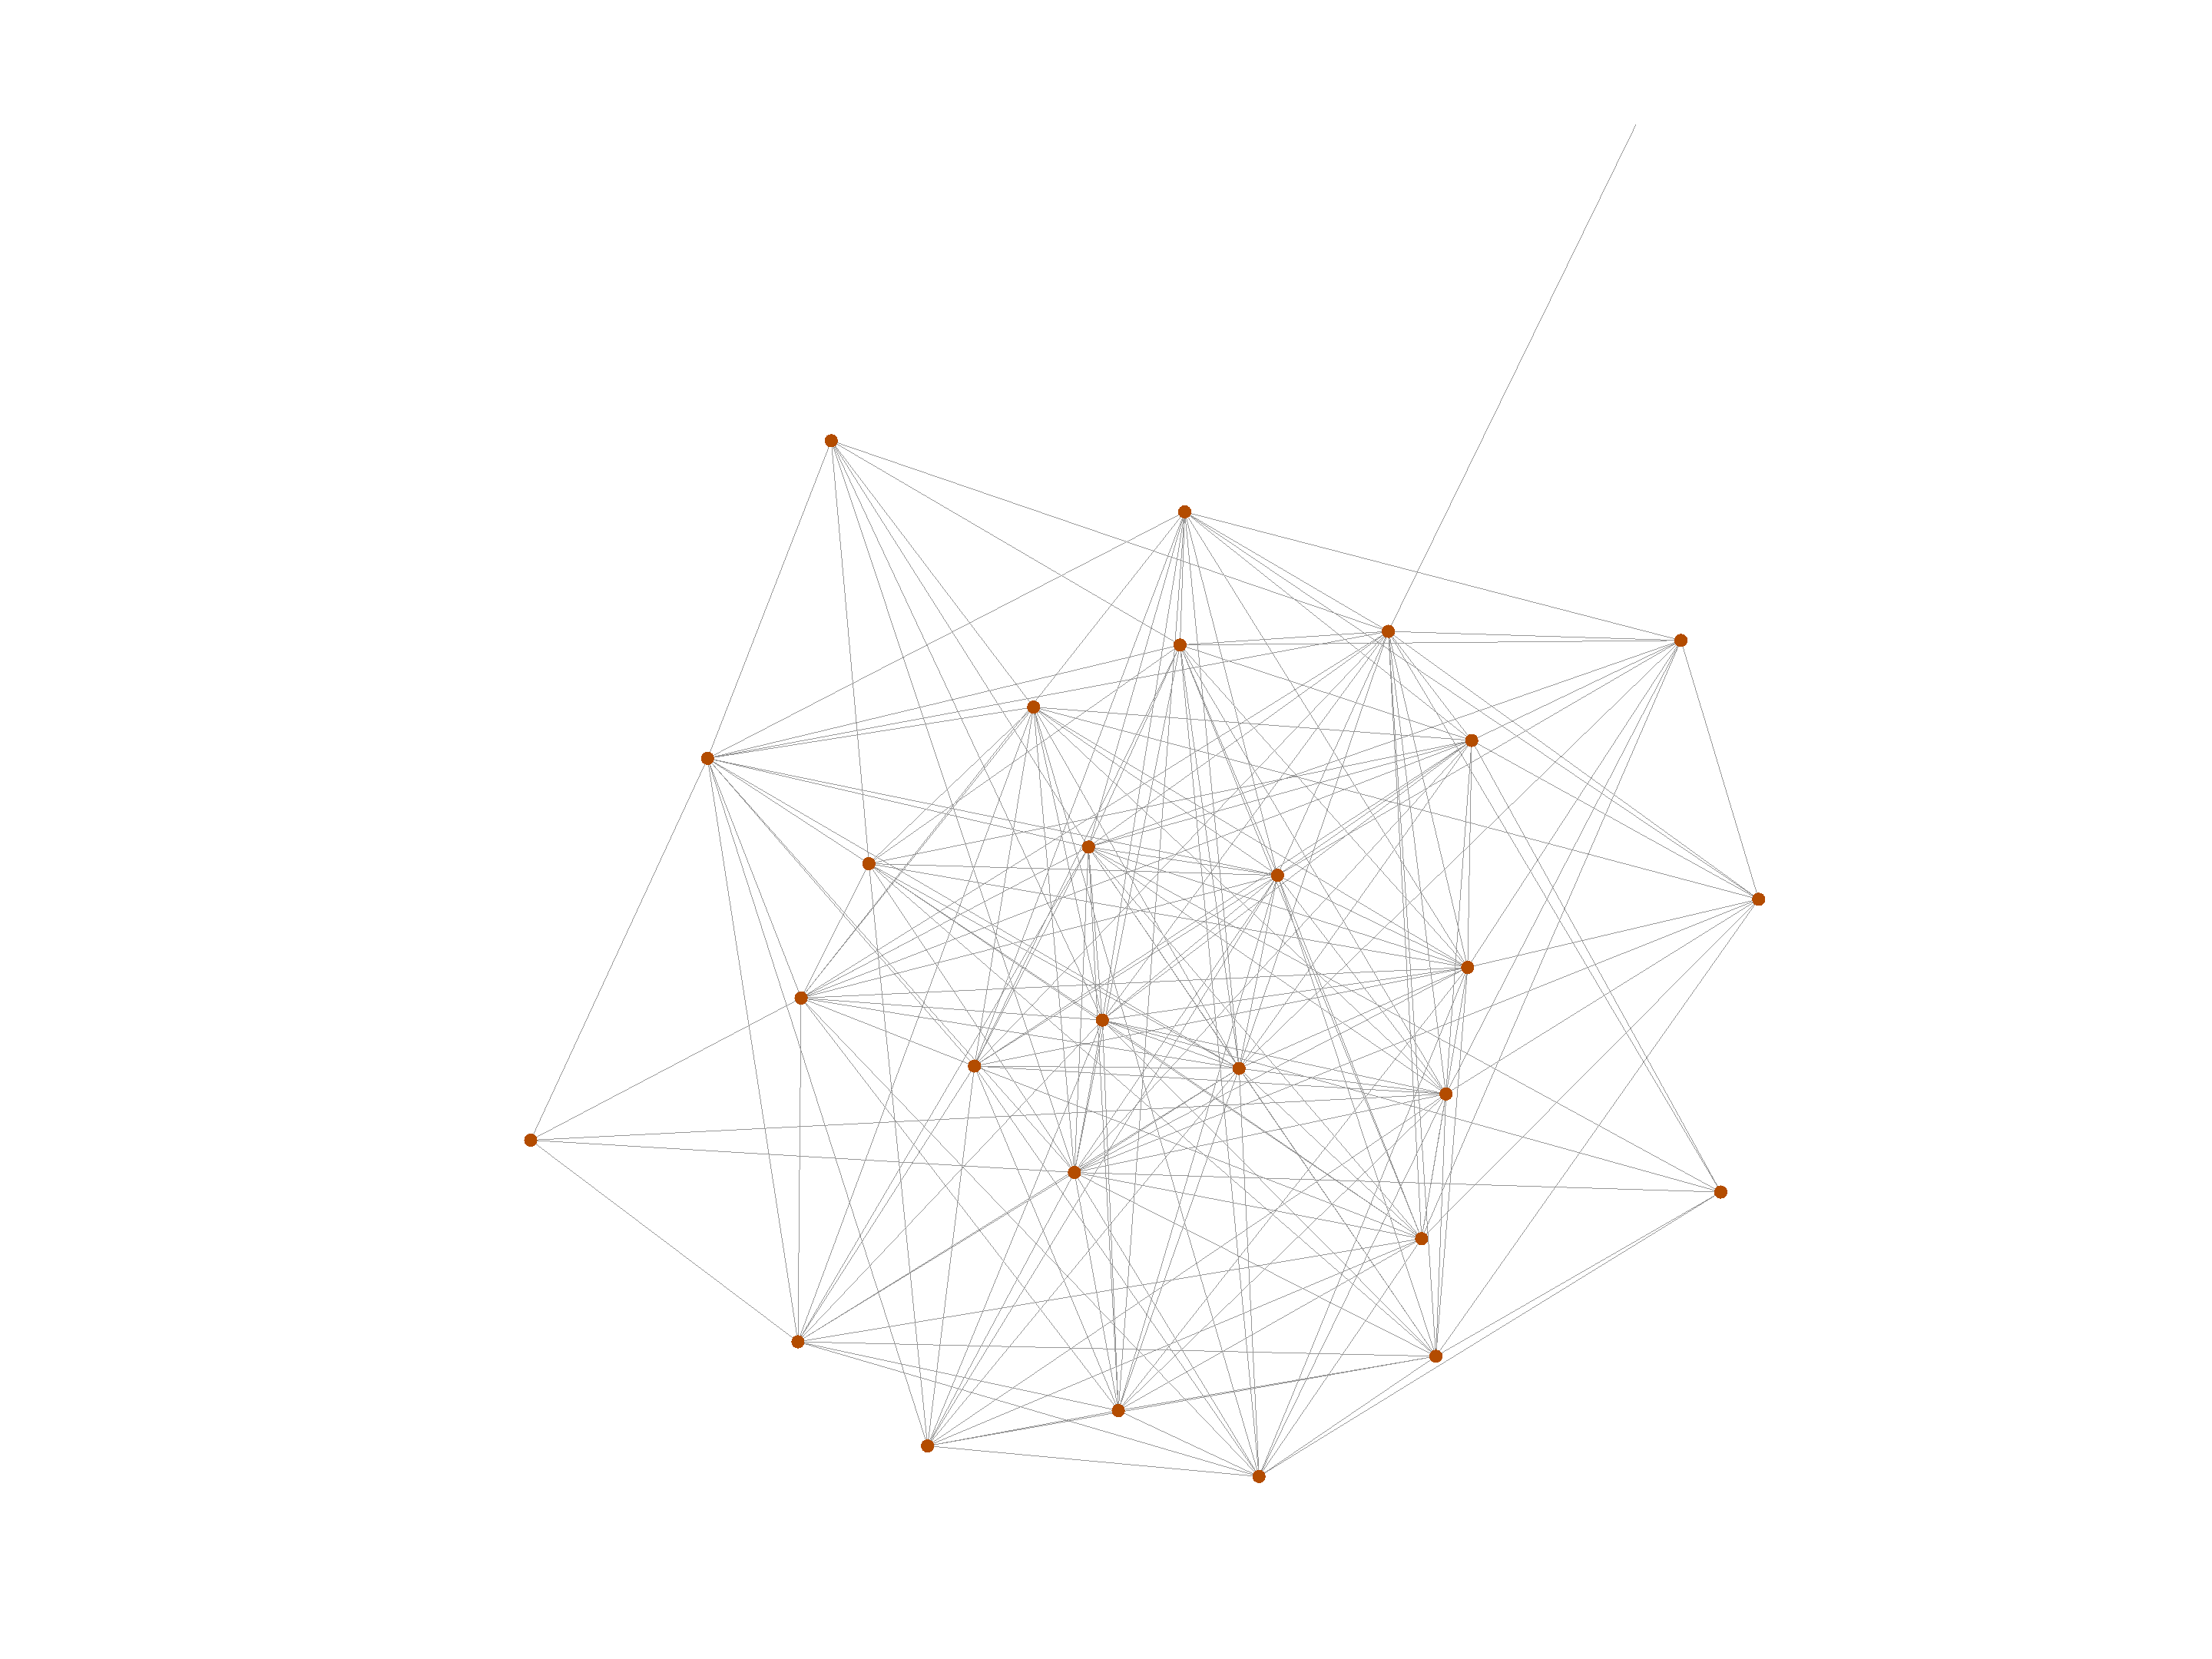
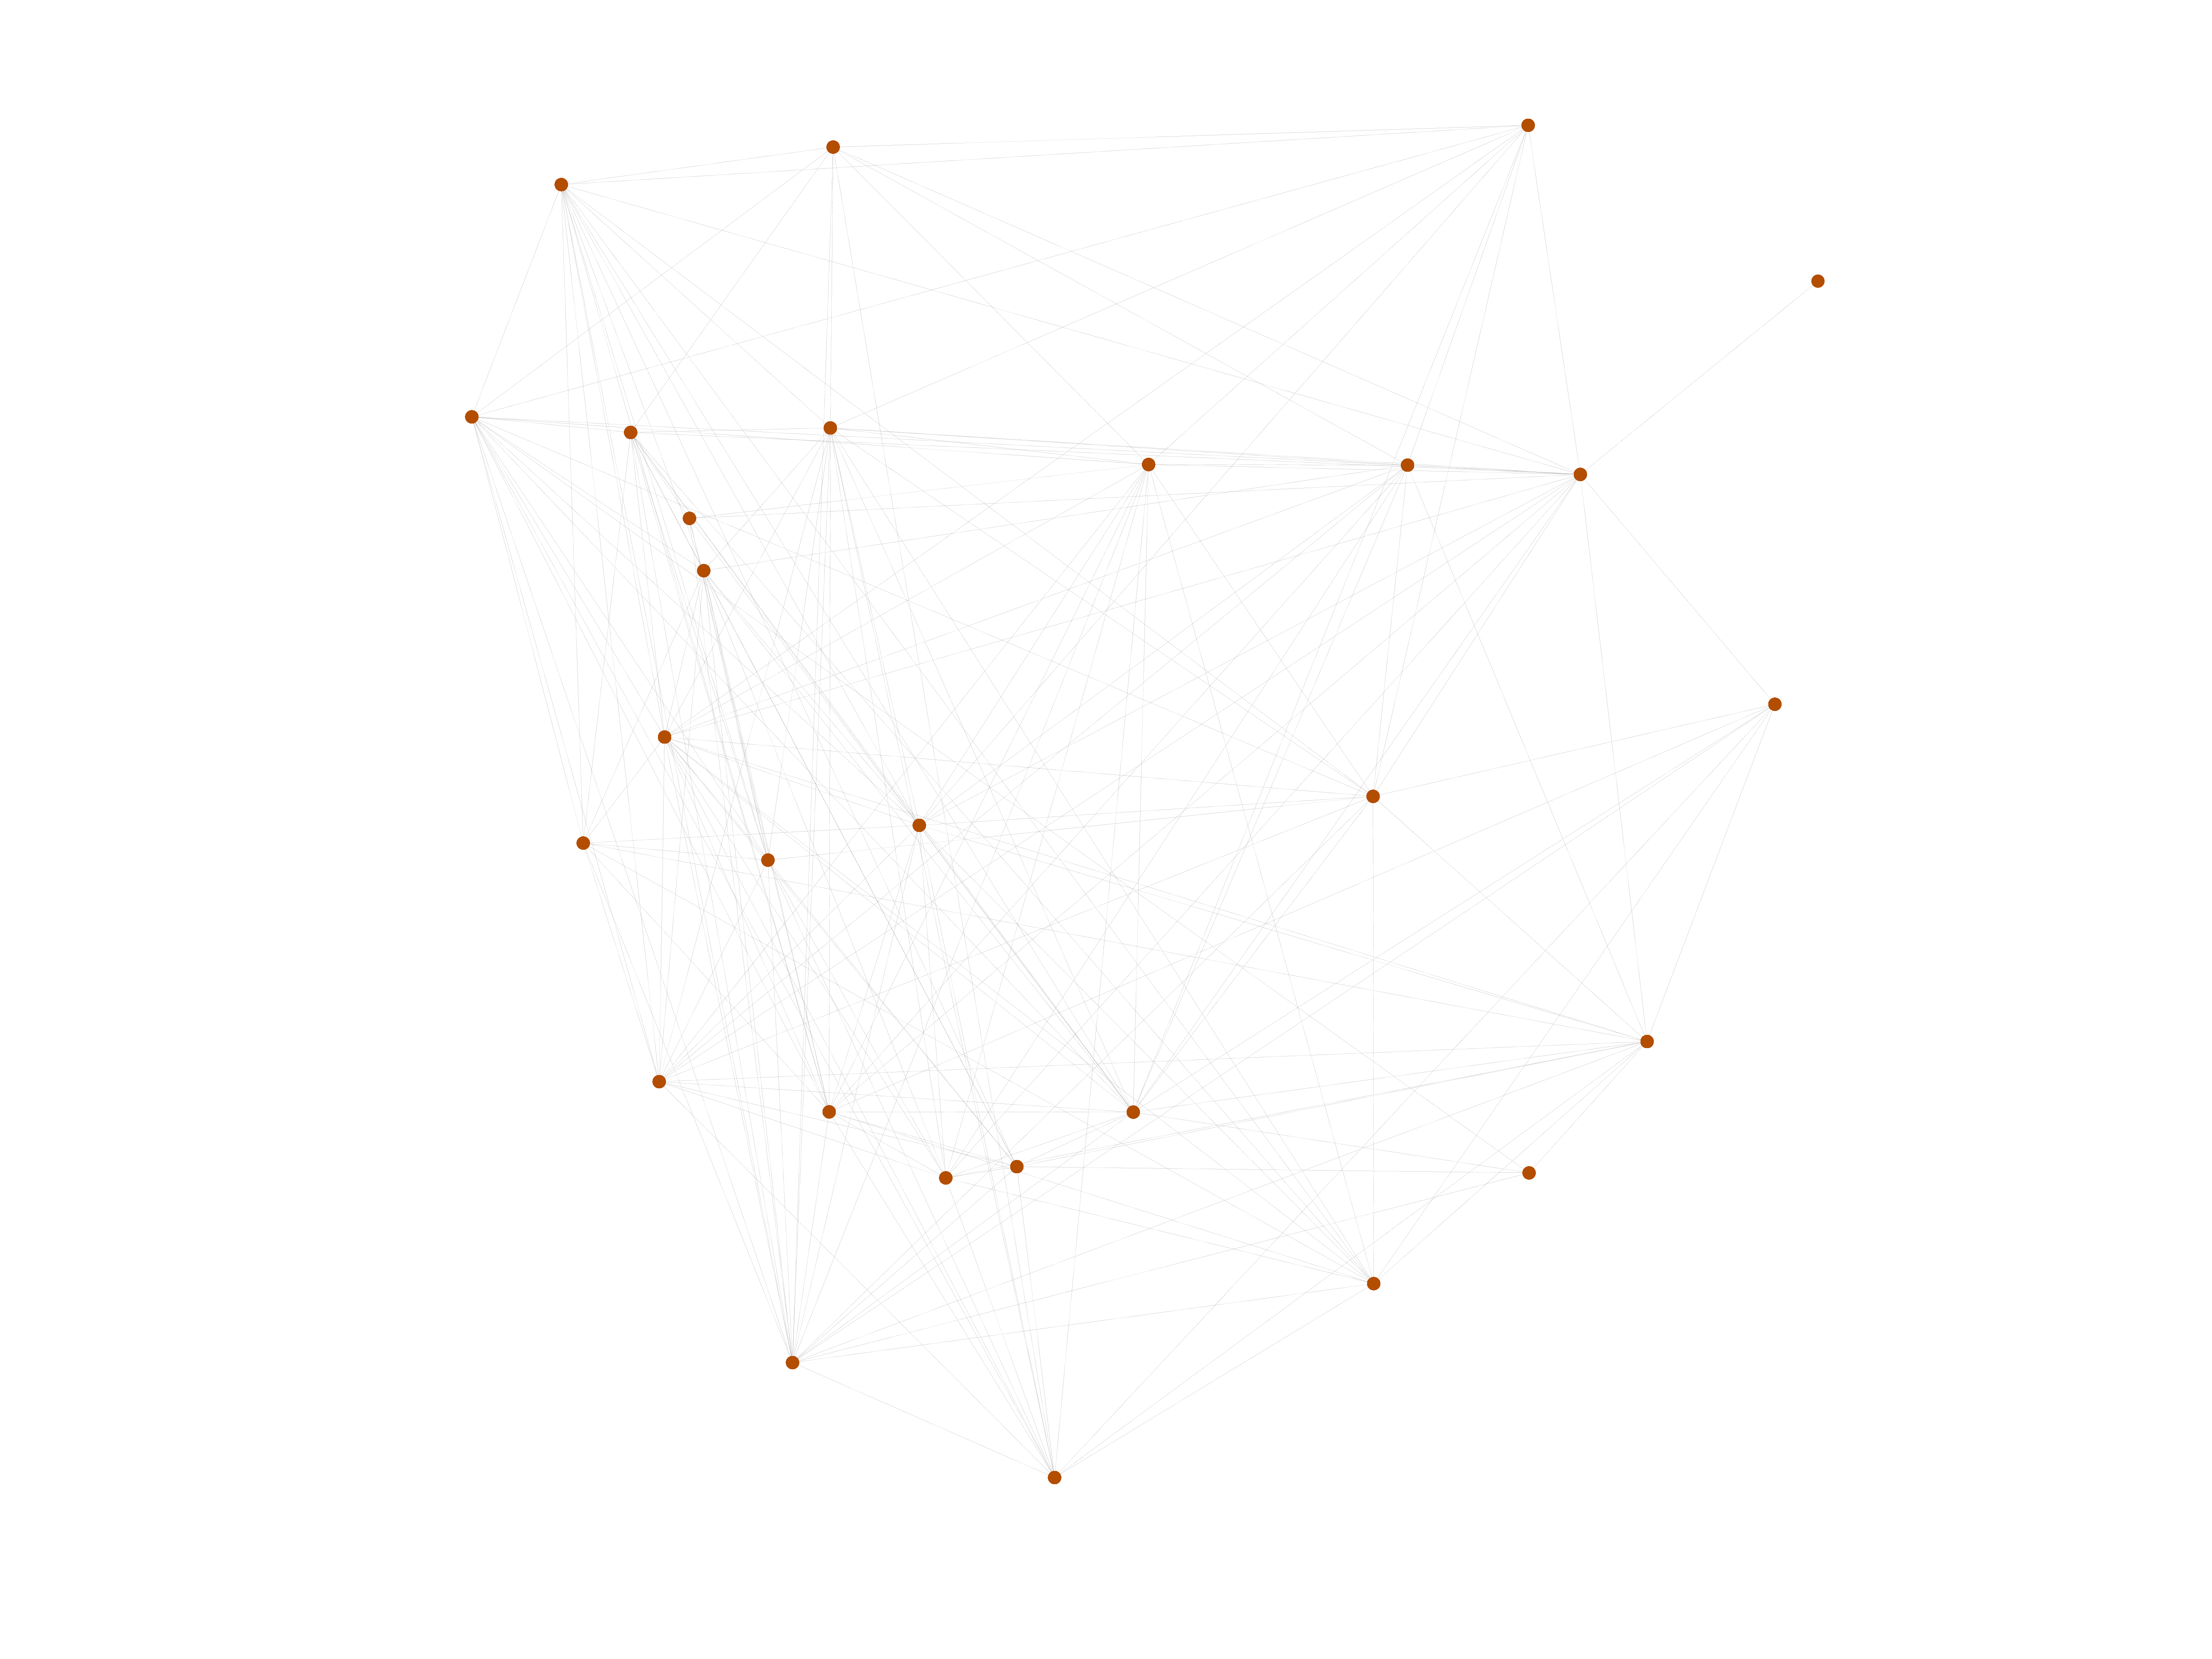
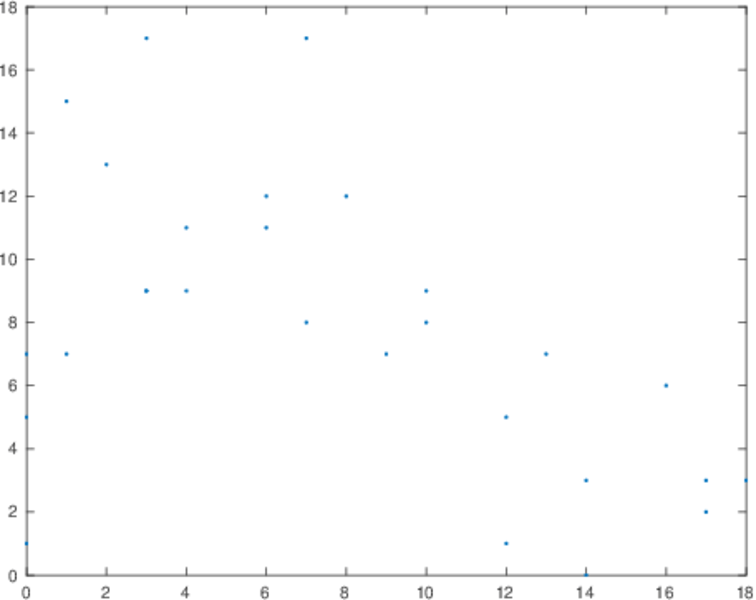
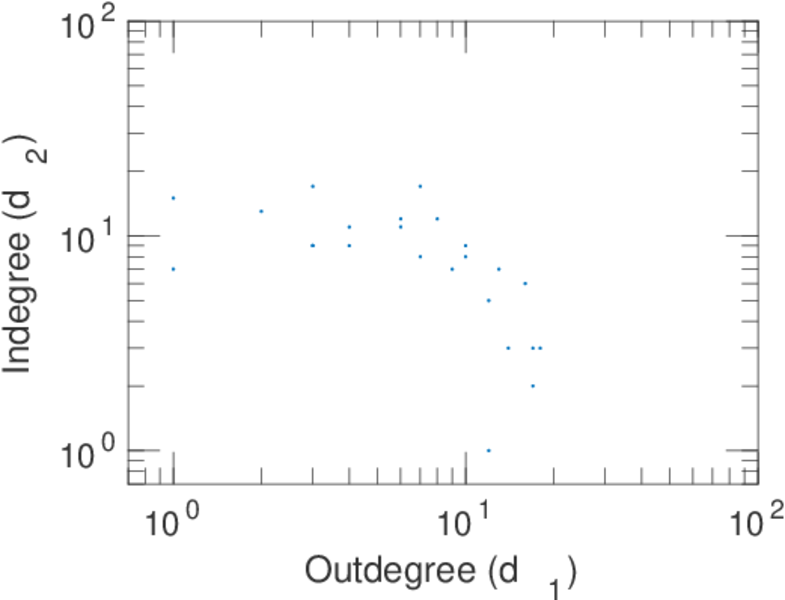
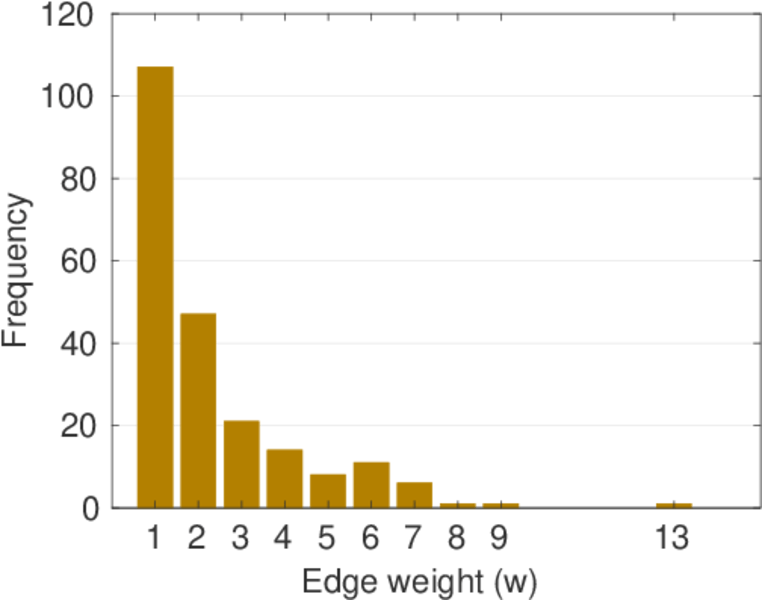
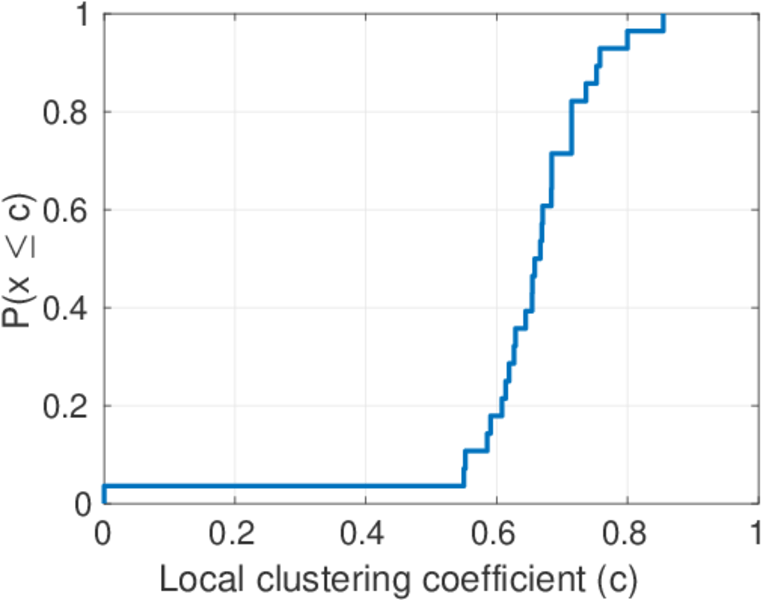
This directed network describes the dominance behavior observed between dairy cattle (Bos taurus) at the Iberia Livestock Experiment Station in Jenerette, Louisiana, USA. A node represents a cow and an edge represents the dominance of the left cow over the right cow. The edge weights indicate how often this besting behavior was observed.
| Code | MA
| |
| Internal name | moreno_cattle
| |
| Name | Cattle | |
| Data source | http://moreno.ss.uci.edu/data.html#cattle | |
| Availability | Dataset is available for download | |
| Consistency check | Dataset passed all tests | |
| Category | Animal network | |
| Dataset timestamp | 1955 | |
| Node meaning | Cattle | |
| Edge meaning | Dominance | |
| Network format | Unipartite, directed | |
| Edge type | Positive weights, no multiple edges | |
| Reciprocal | Contains reciprocal edges | |
| Directed cycles | Contains directed cycles | |
| Loops | Does not contain loops | |
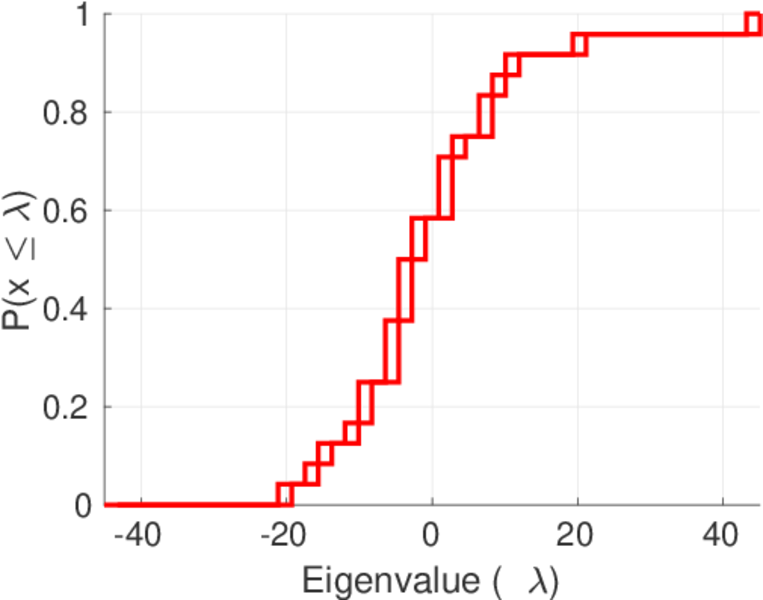
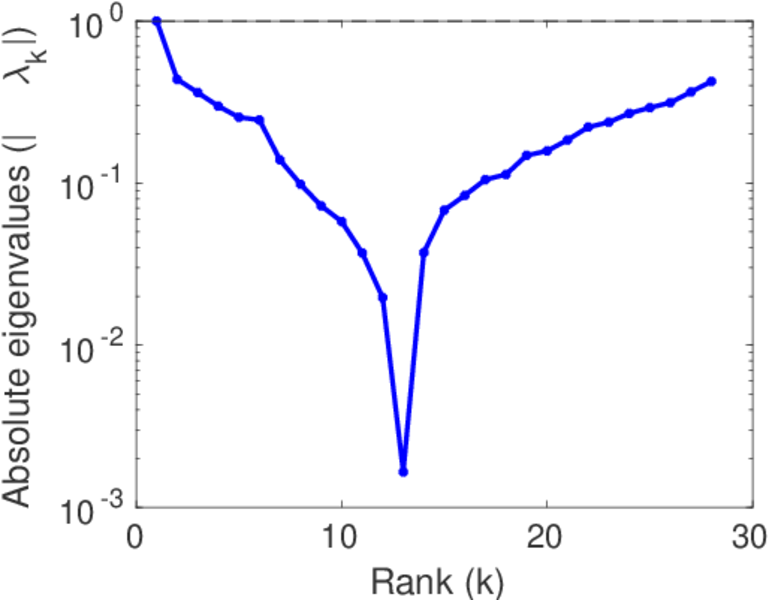
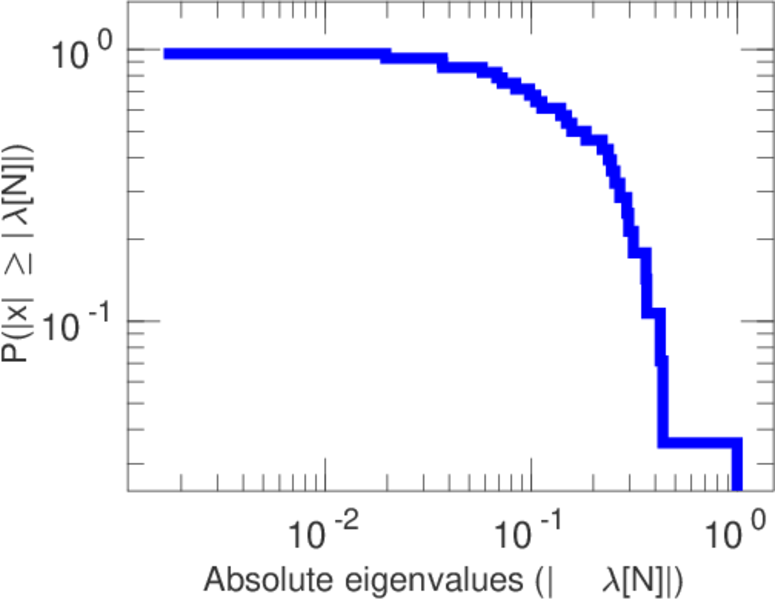
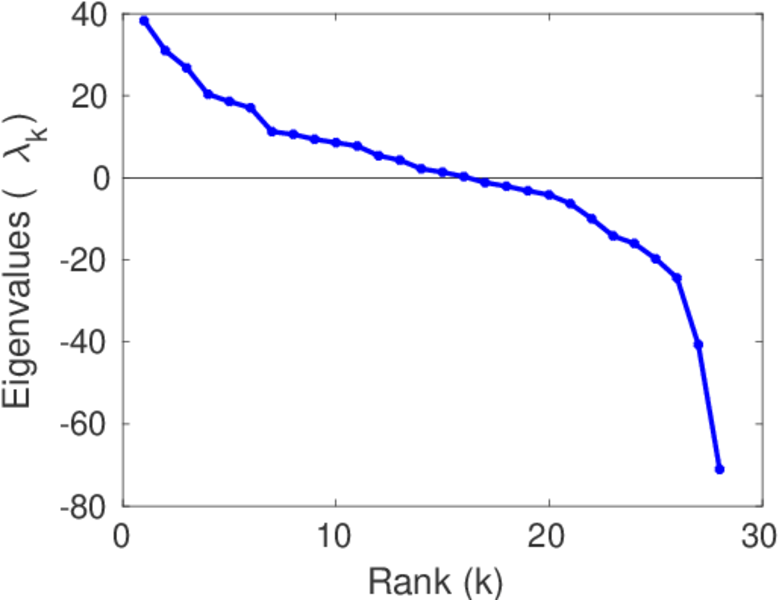
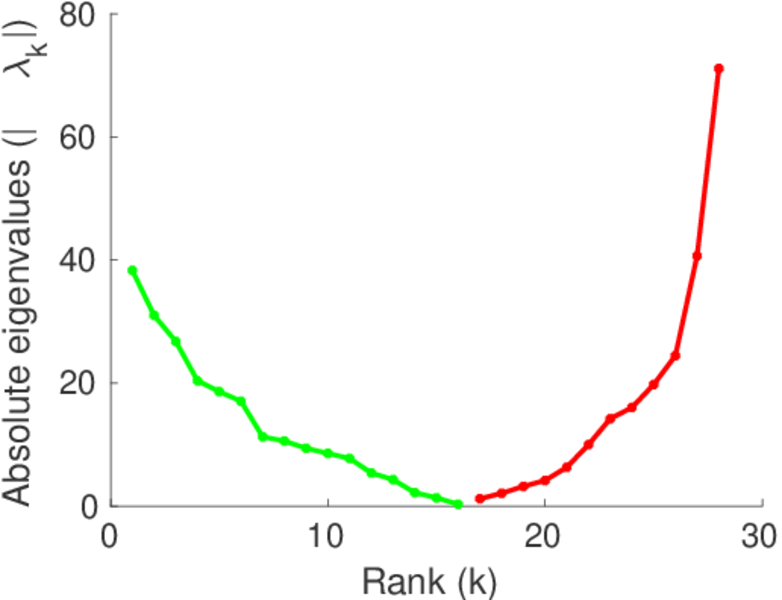
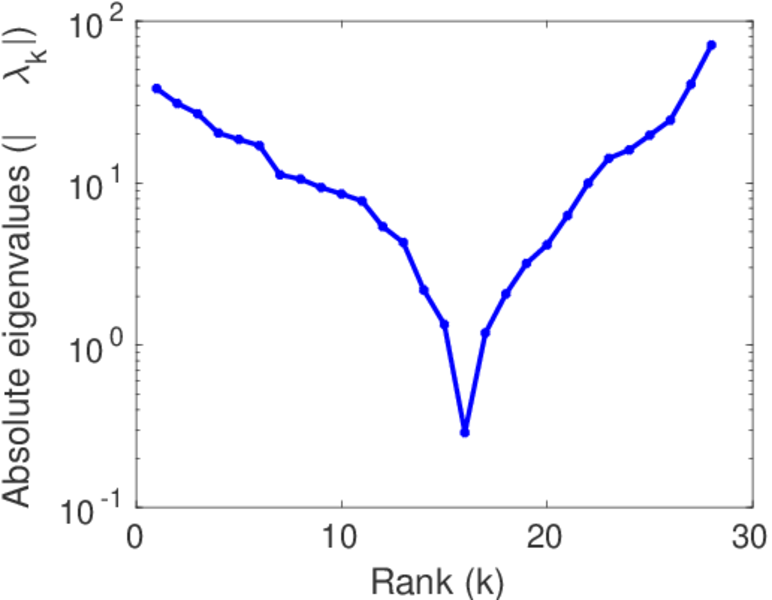
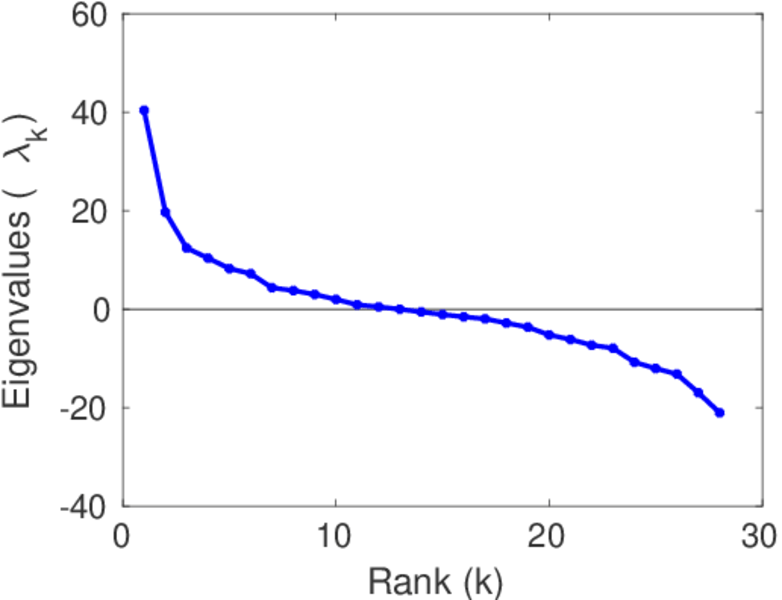
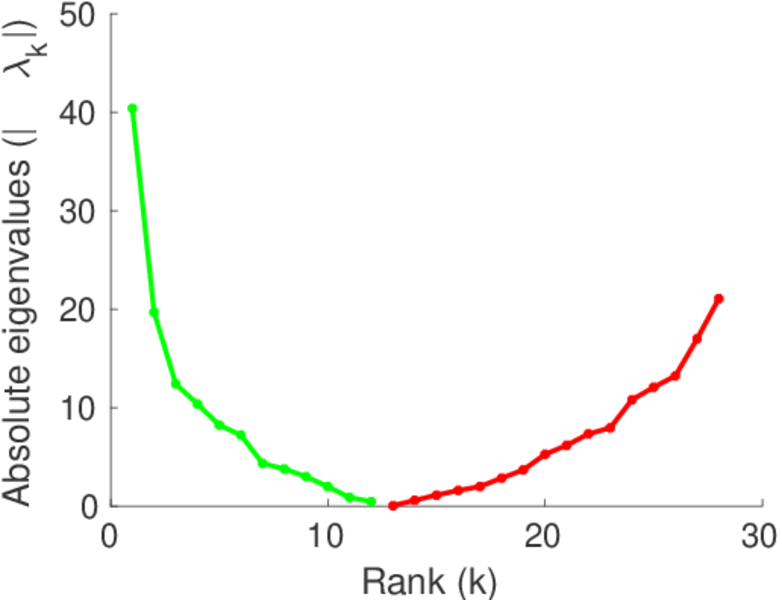
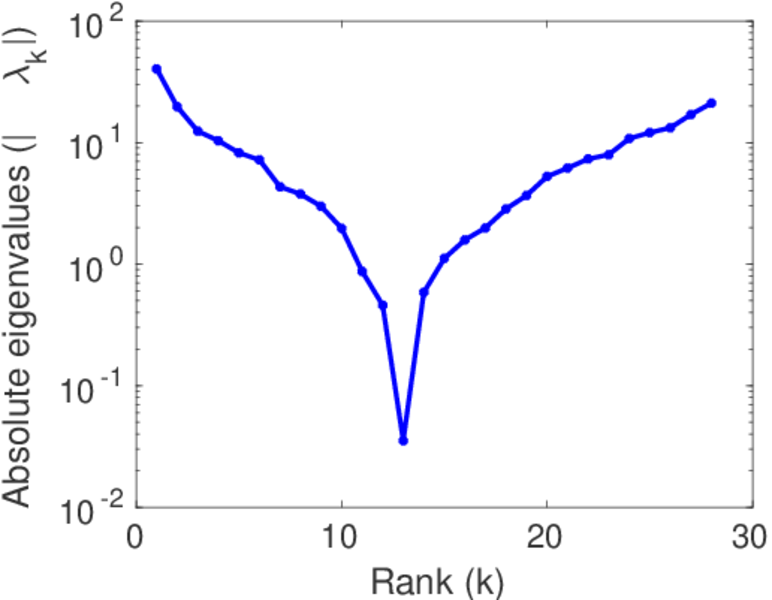
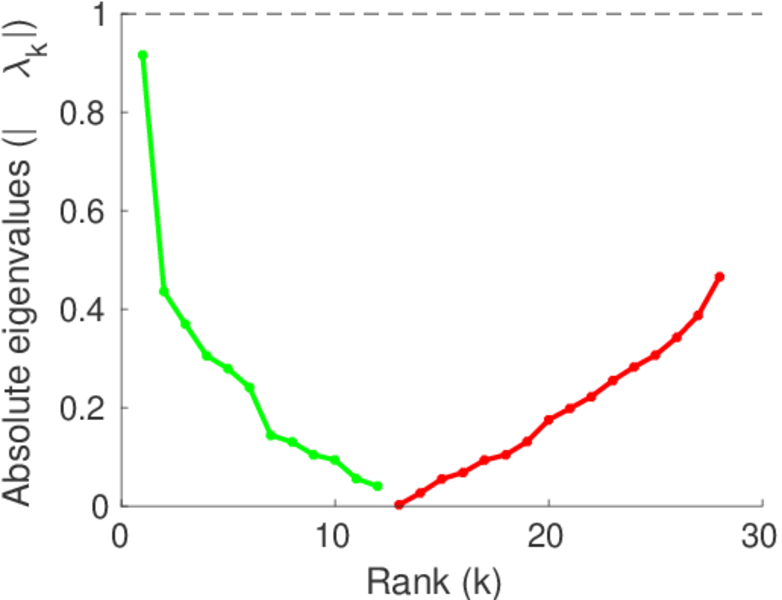
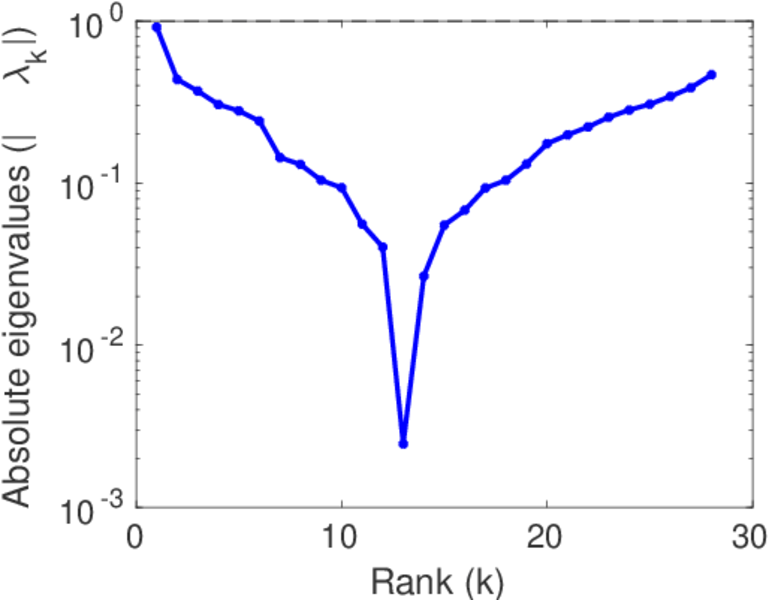
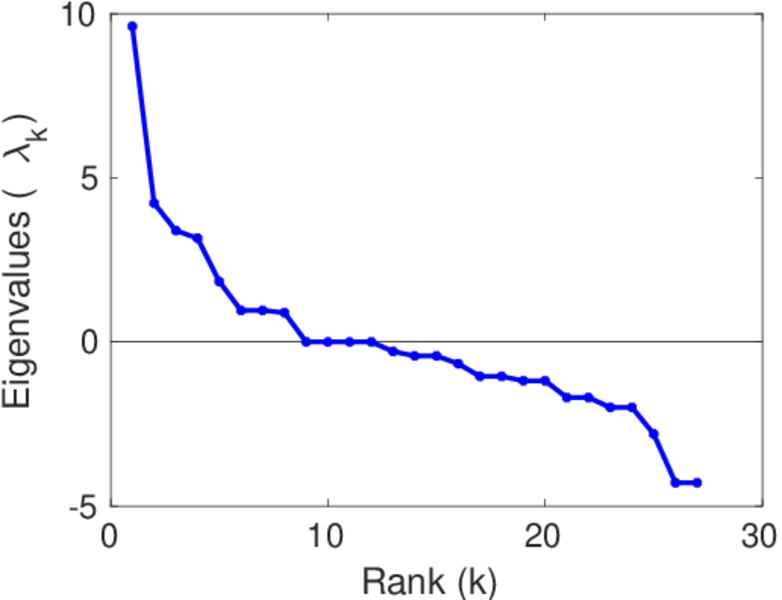
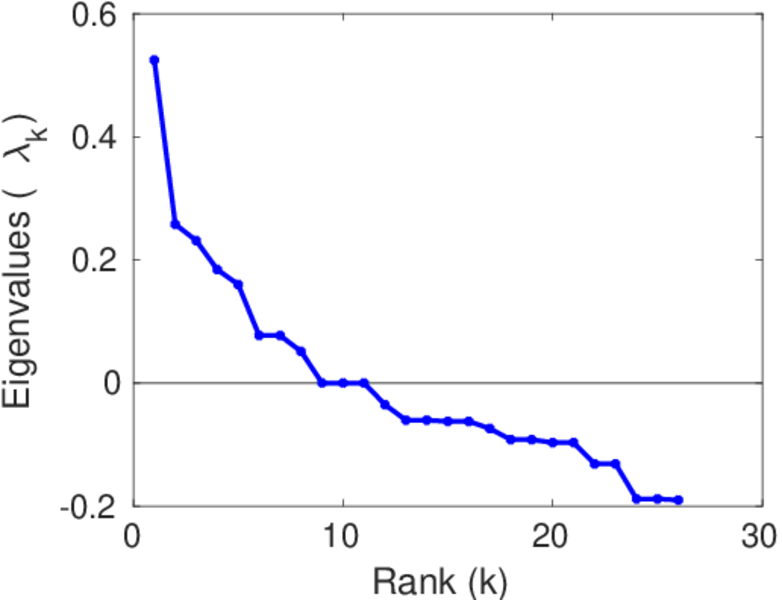
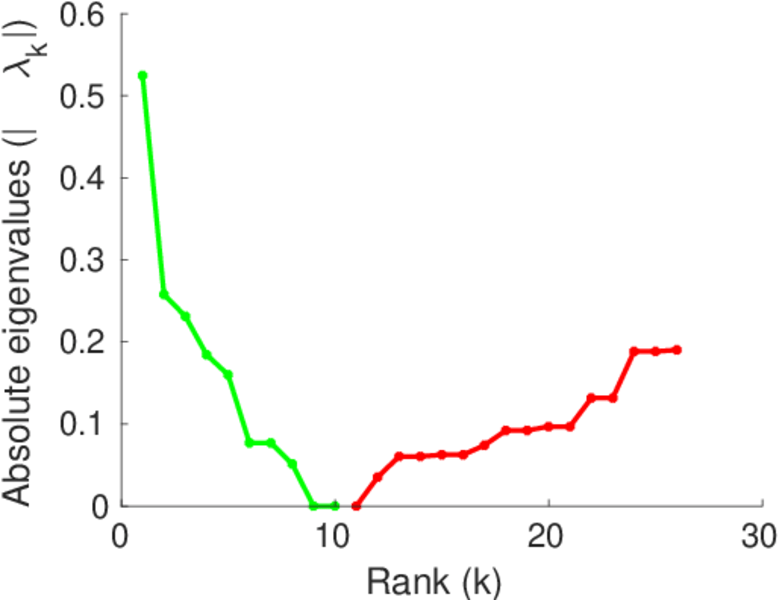
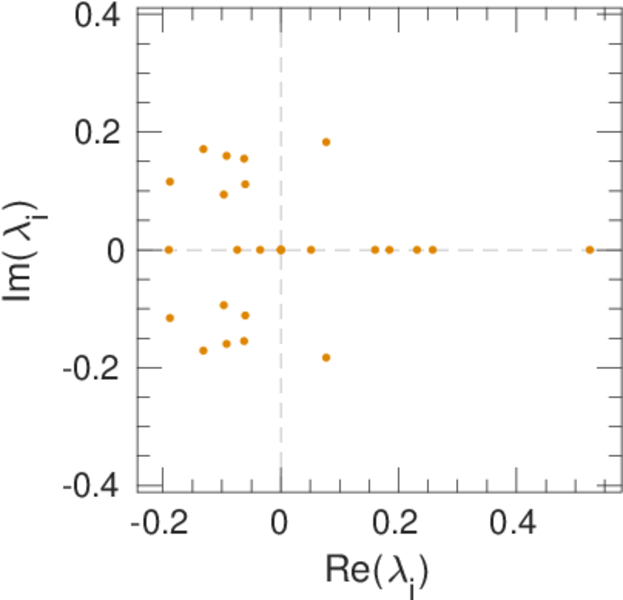
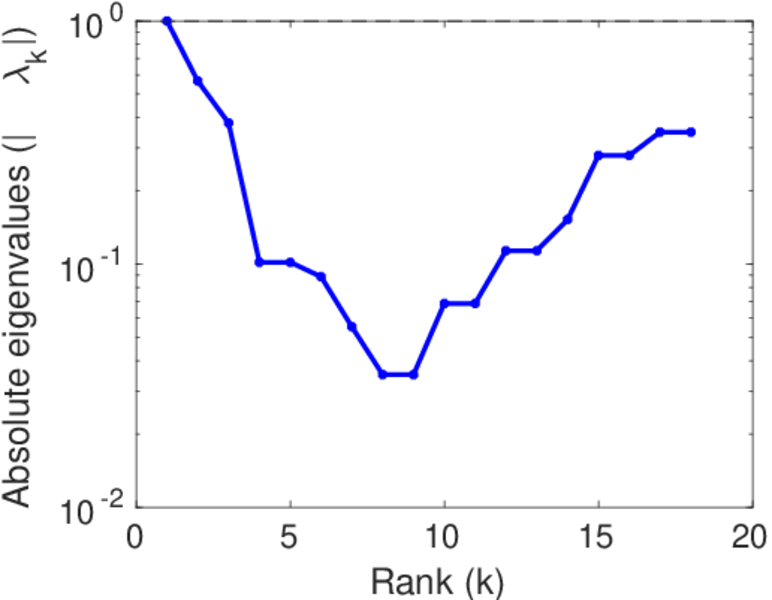
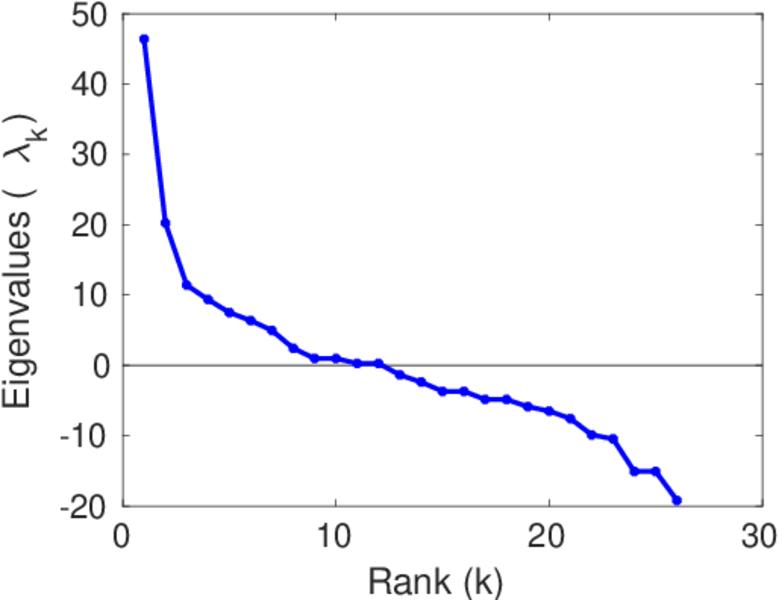
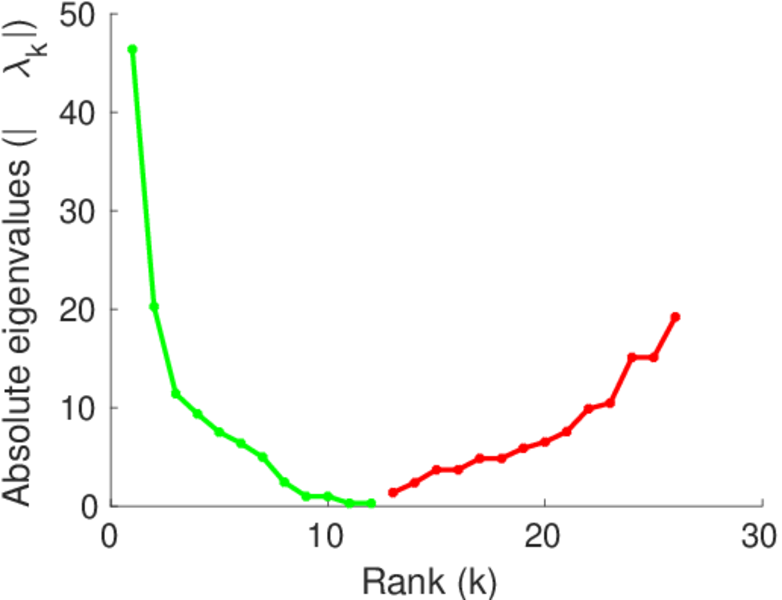
| Skew-symmetry | Inverted edges can be interpreted as negated edges |


| [1] | Jérôme Kunegis. KONECT – The Koblenz Network Collection. In Proc. Int. Conf. on World Wide Web Companion, pages 1343–1350, 2013. [ http ] |
| [2] | Martin W. Schein and Milton H. Fohrman. Social dominance relationships in a herd of dairy cattle. The Br. J. of Anim. Behav., 3(2):45–55, 1955. |