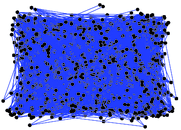
Adolescent health
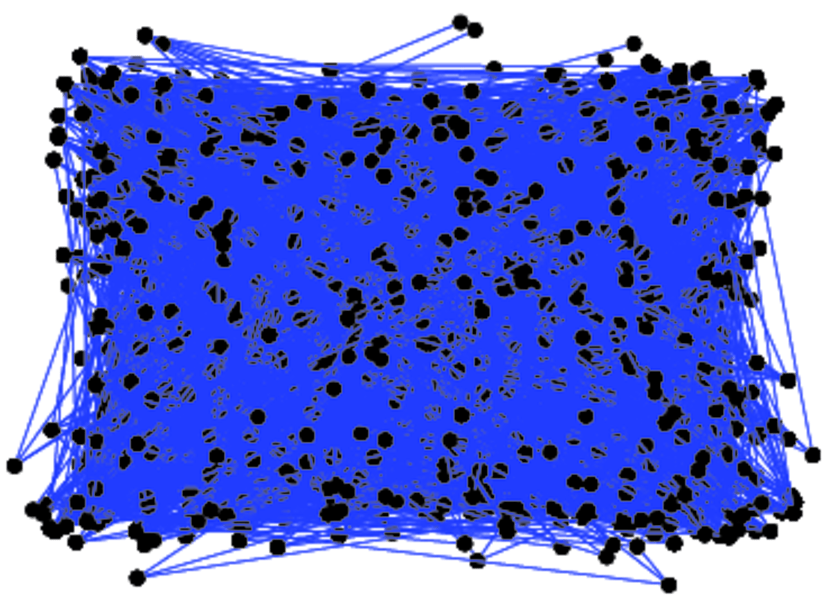
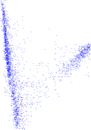
This directed network was created from a survey that took place in 1994/1995.
Each student was asked to list his 5 best female and his 5 male friends. A node
represents a student and an edge between two students shows that the left
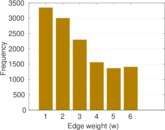
student chose the right student as a friend. Higher edge weights indicate more
interactions and a edge weight shows that there is no common activity at all.
Metadata
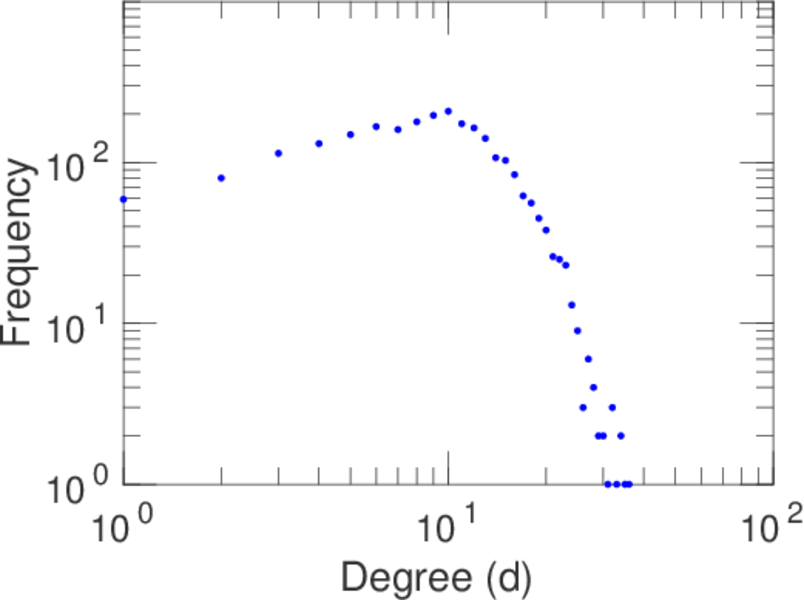
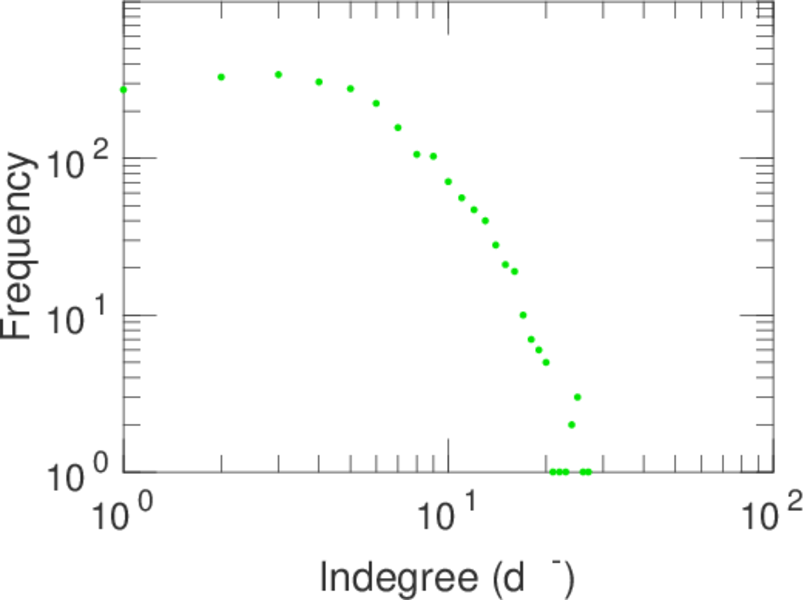
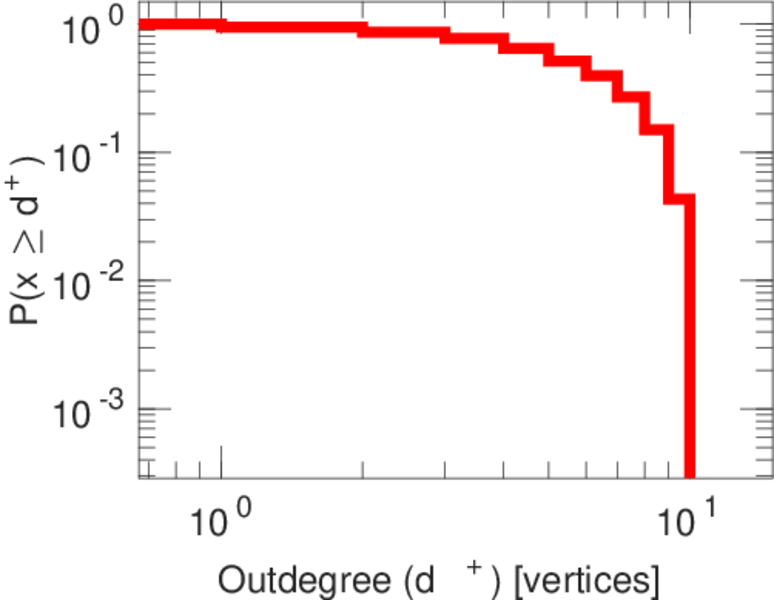
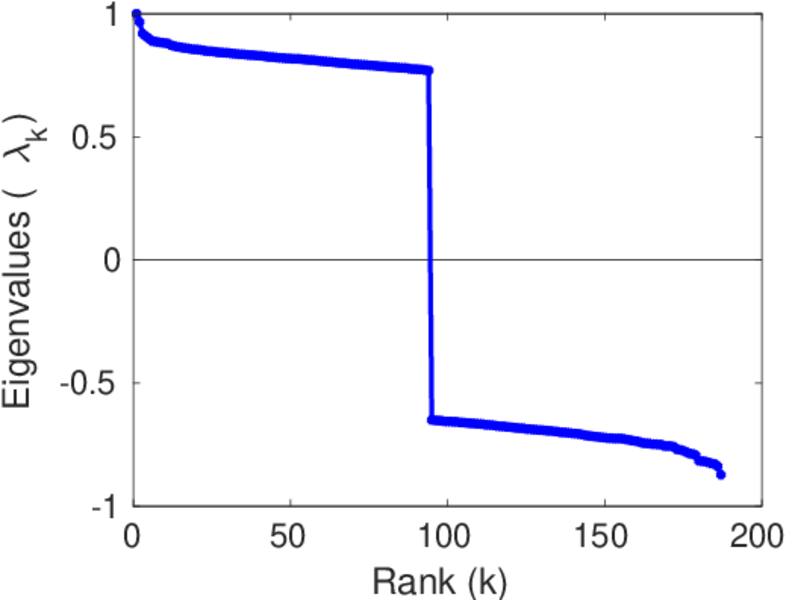
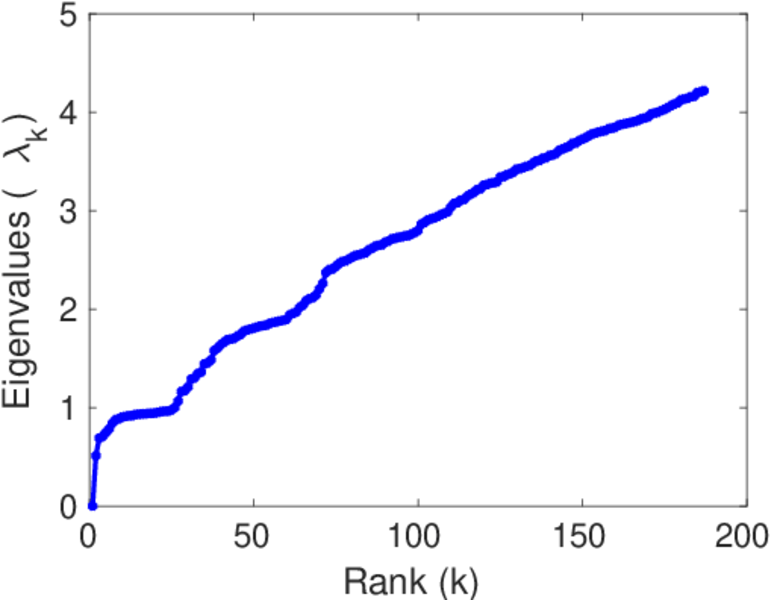
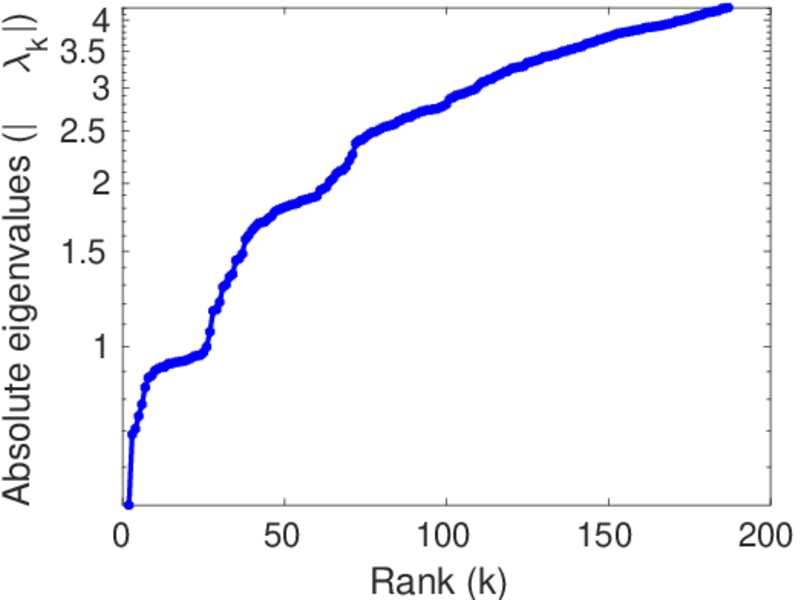
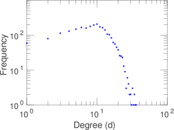
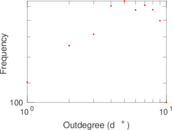
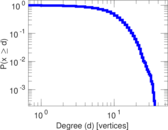
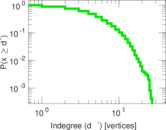
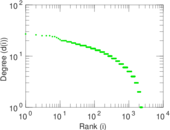
Statistics
| Size | n = | 2,539
|
| Volume | m = | 12,969
|
| Loop count | l = | 0
|
| Wedge count | s = | 99,247
|
| Claw count | z = | 740,457
|
| Cross count | x = | 2,920,116
|
| Triangle count | t = | 4,694
|
| Square count | q = | 17,977
|
| 4-Tour count | T4 = | 561,714
|
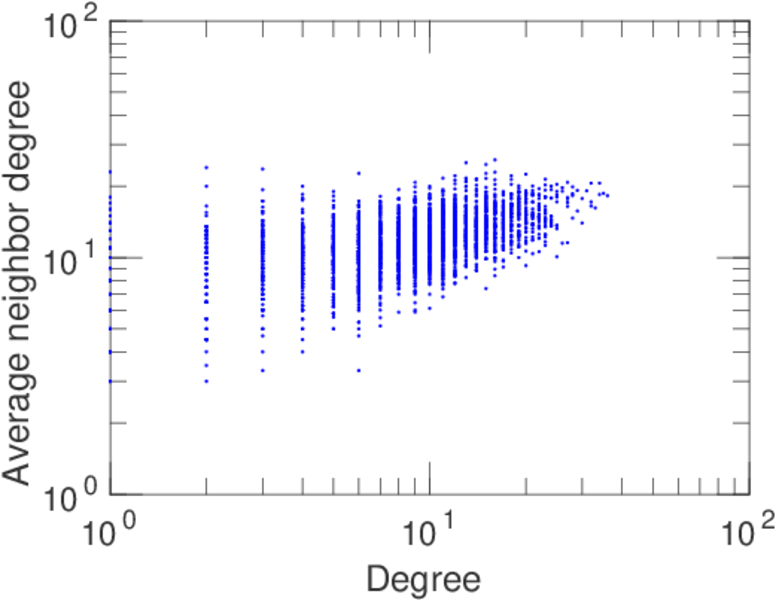
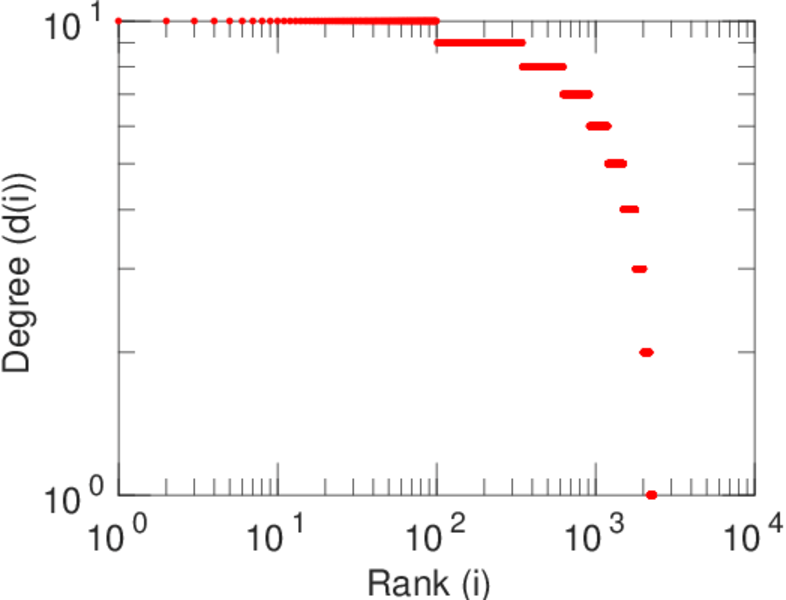
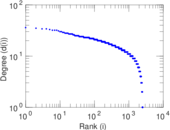
| Maximum degree | dmax = | 36
|
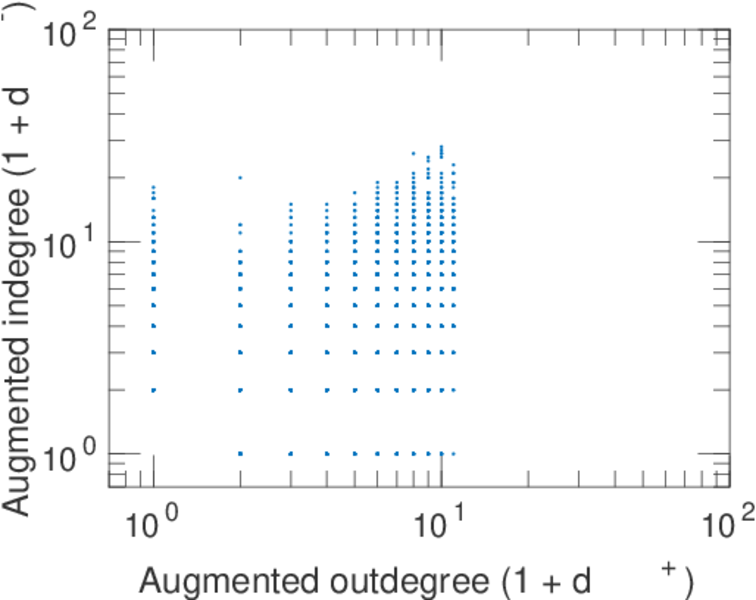
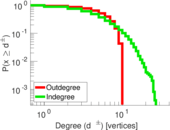
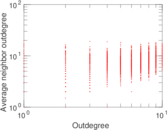
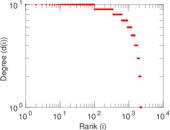
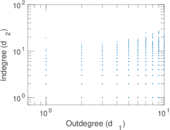
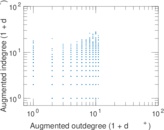
| Maximum outdegree | d+max = | 10
|
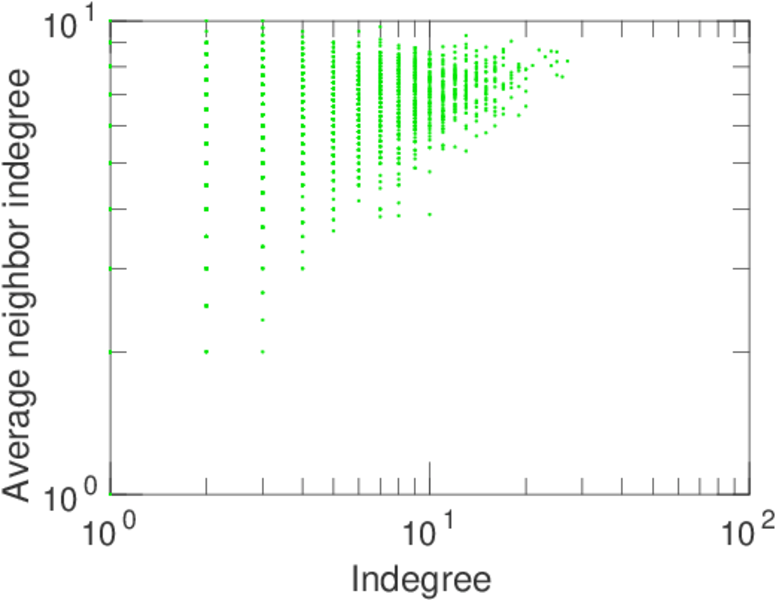
| Maximum indegree | d−max = | 27
|
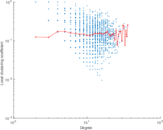
| Average degree | d = | 10.215 8
|
| Fill | p = | 0.002 012 58
|
| Size of LCC | N = | 2,539
|
| Size of LSCC | Ns = | 2,155
|
| Relative size of LSCC | Nrs = | 0.848 759
|
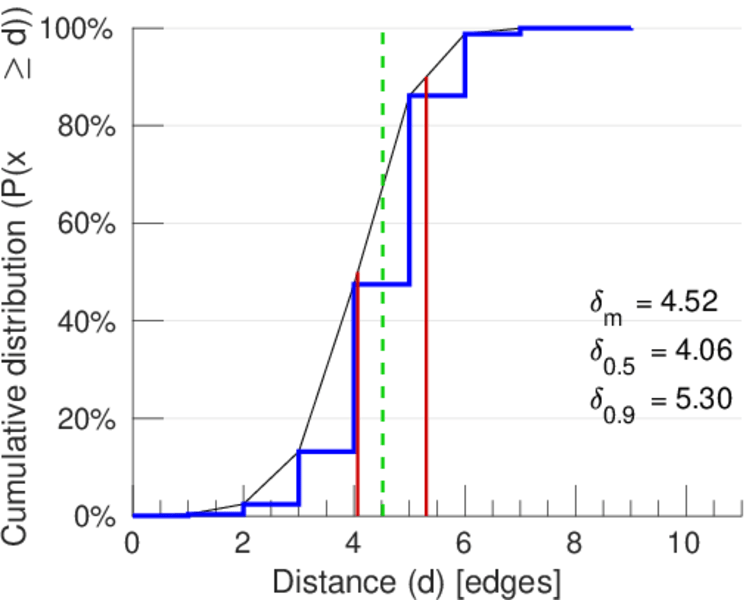
| Diameter | δ = | 10
|
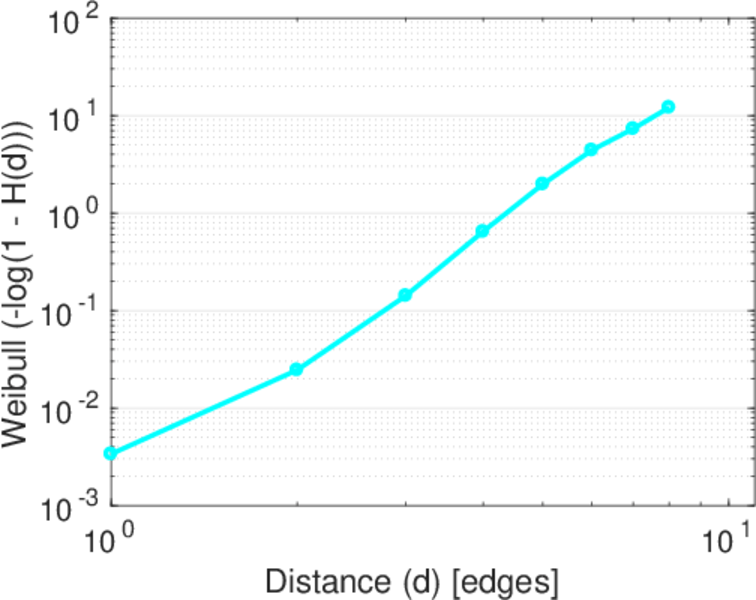
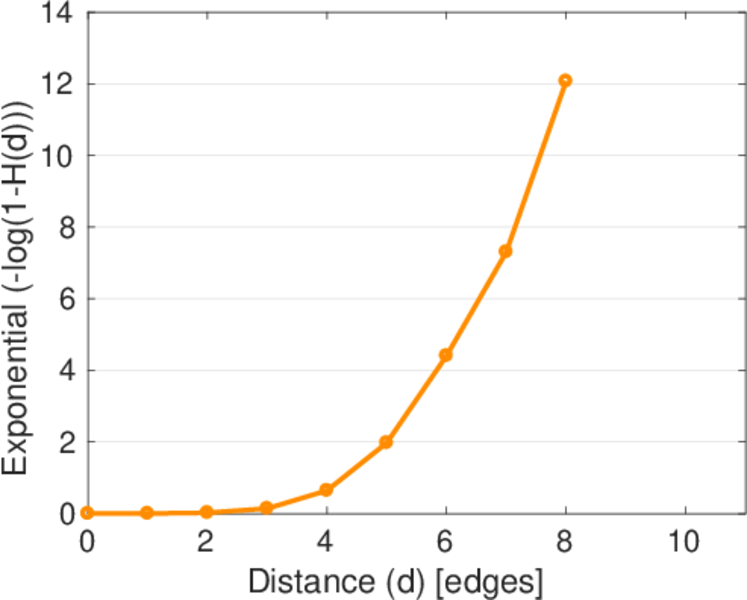
| 50-Percentile effective diameter | δ0.5 = | 4.064 73
|
| 90-Percentile effective diameter | δ0.9 = | 5.304 82
|
| Median distance | δM = | 5
|
| Mean distance | δm = | 4.516 47
|
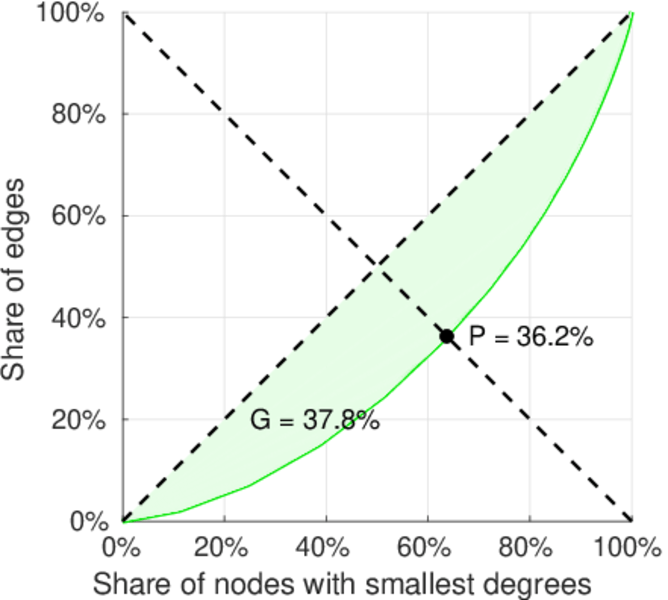
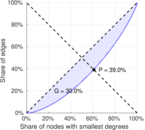
| Gini coefficient | G = | 0.299 855
|
| Balanced inequality ratio | P = | 0.389 699
|
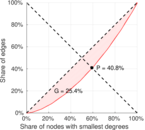
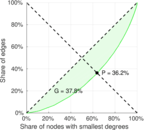
| Outdegree balanced inequality ratio | P+ = | 0.407 819
|
| Indegree balanced inequality ratio | P− = | 0.361 786
|
| Relative edge distribution entropy | Her = | 0.981 136
|
| Power law exponent | γ = | 1.514 12
|
| Tail power law exponent | γt = | 8.251 00
|
| Tail power law exponent with p | γ3 = | 8.251 00
|
| p-value | p = | 0.430 000
|
| Outdegree tail power law exponent with p | γ3,o = | 8.381 00
|
| Outdegree p-value | po = | 0.000 00
|
| Indegree tail power law exponent with p | γ3,i = | 7.081 00
|
| Indegree p-value | pi = | 0.448 000
|
| Degree assortativity | ρ = | +0.251 286
|
| Degree assortativity p-value | pρ = | 1.605 64 × 10−298
|
| In/outdegree correlation | ρ± = | +0.260 294
|
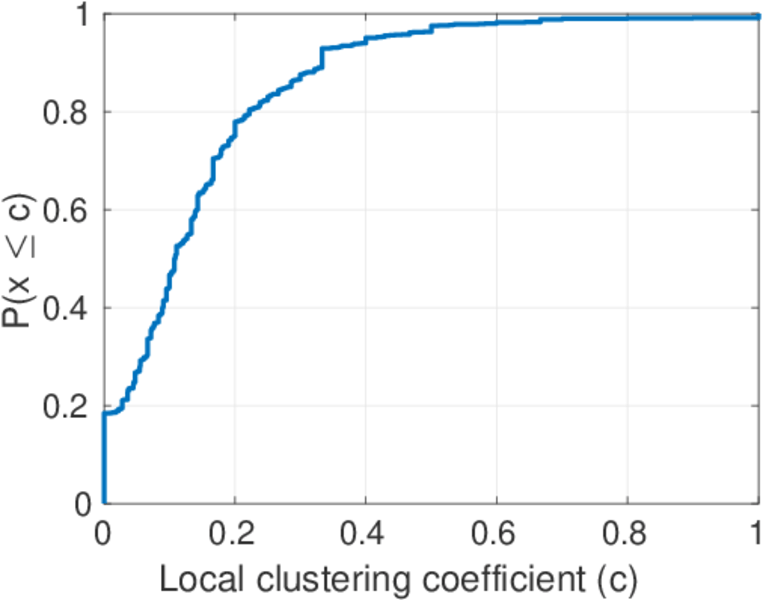
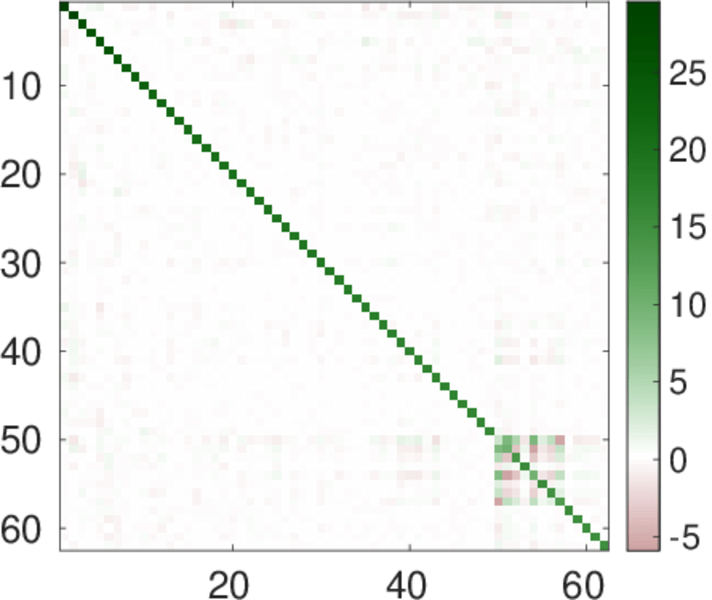
| Clustering coefficient | c = | 0.141 888
|
| Directed clustering coefficient | c± = | 0.149 544
|
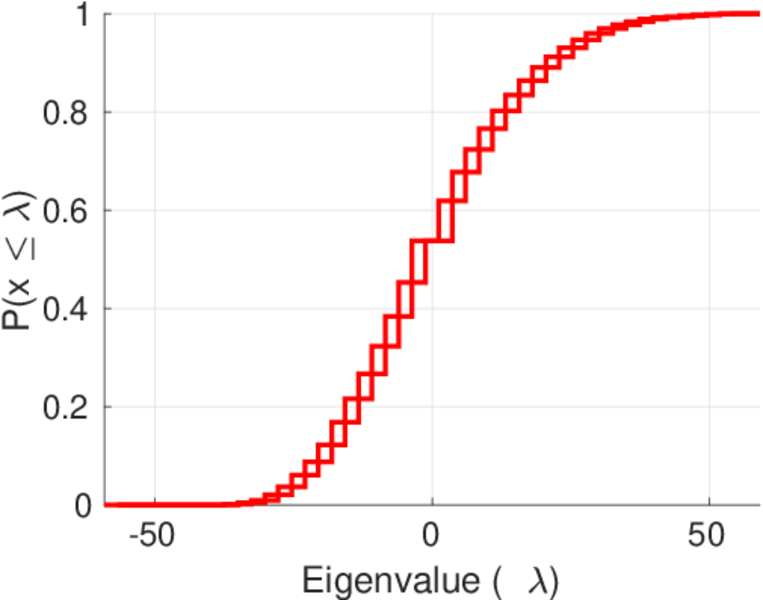
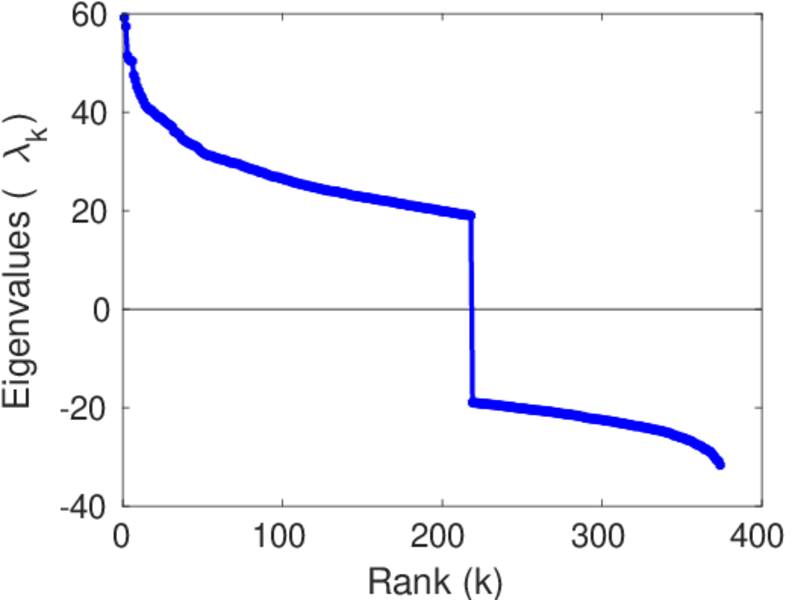
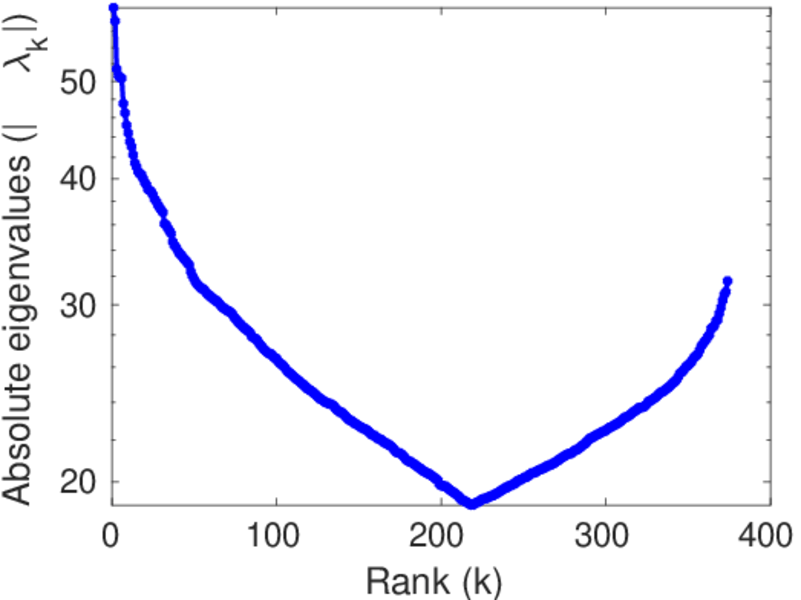
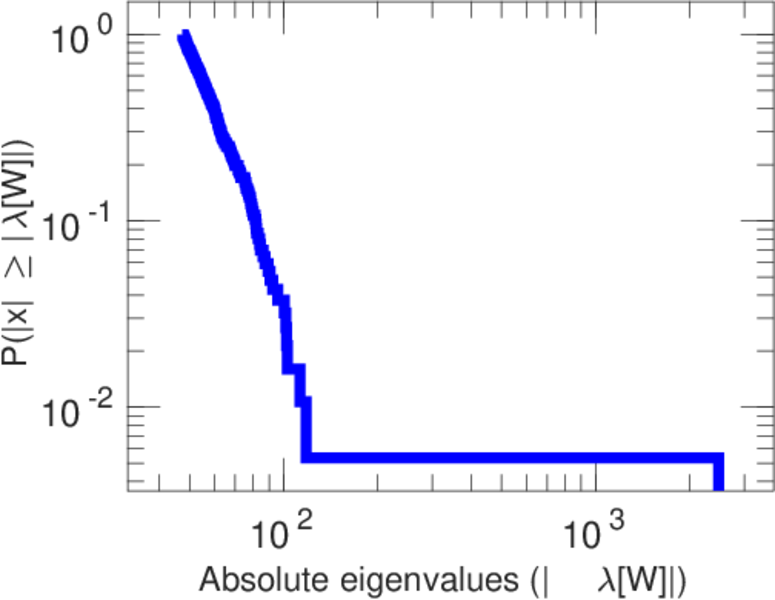
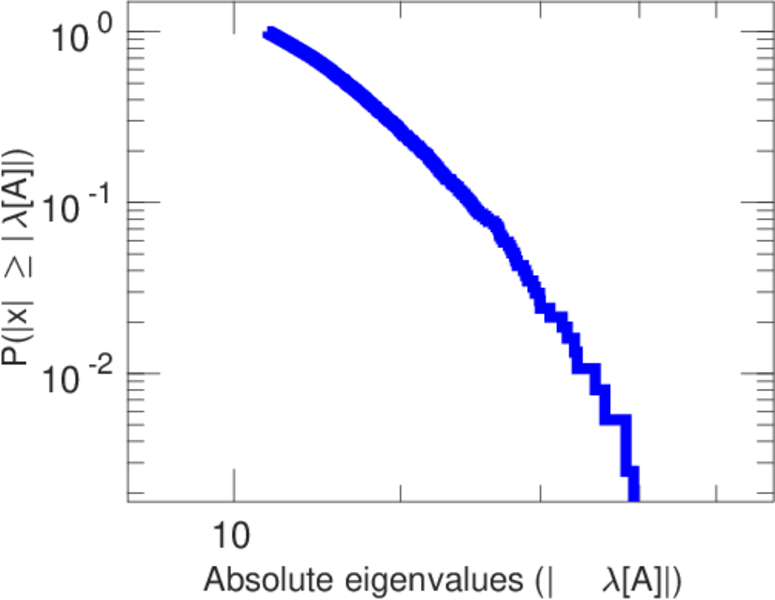
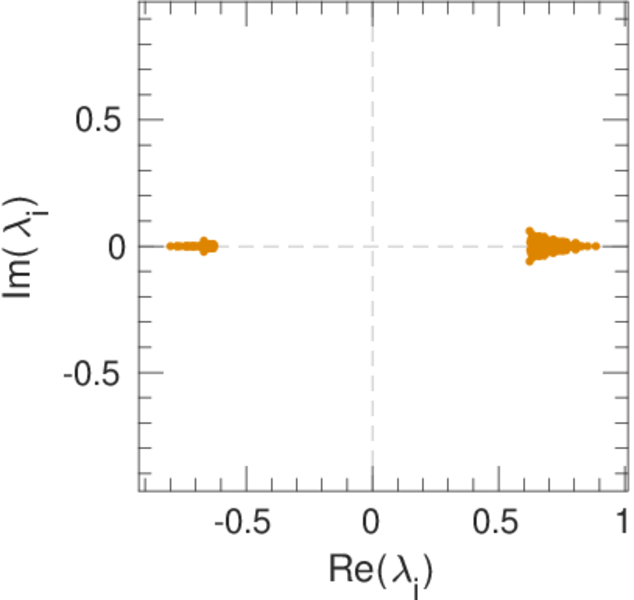
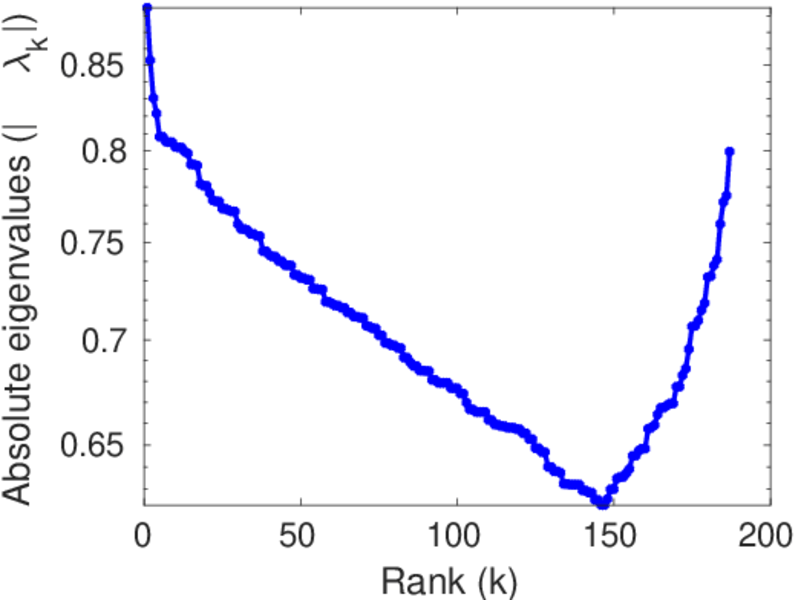
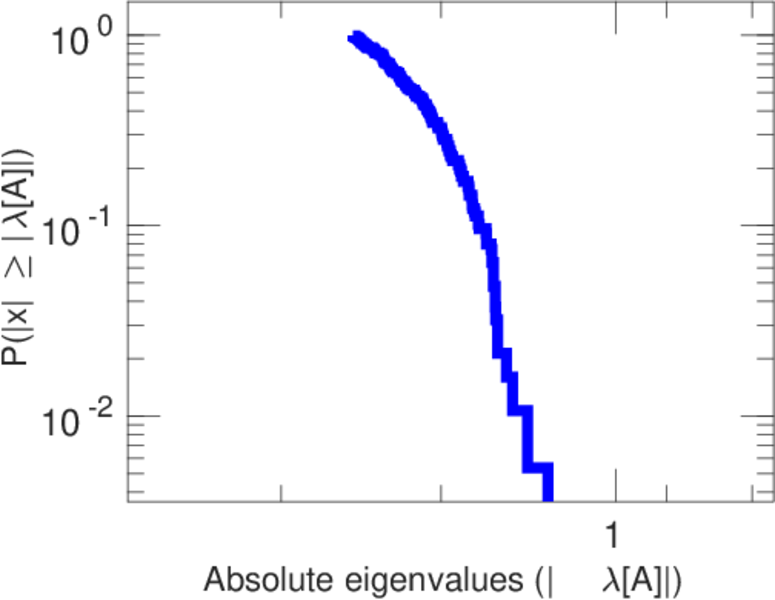
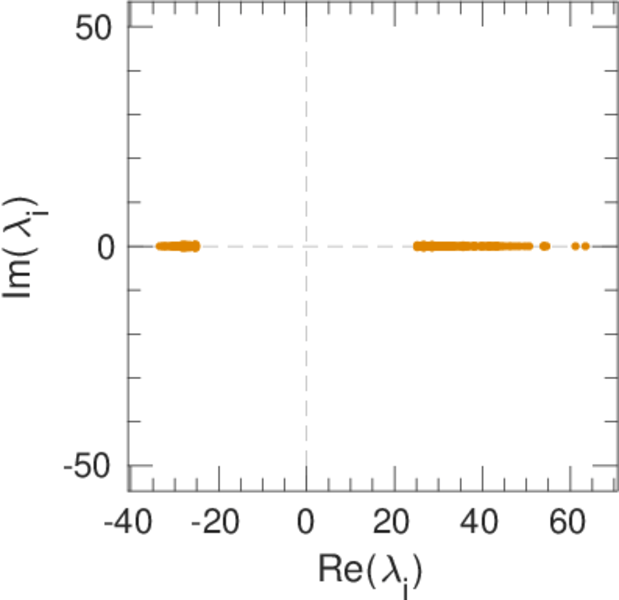
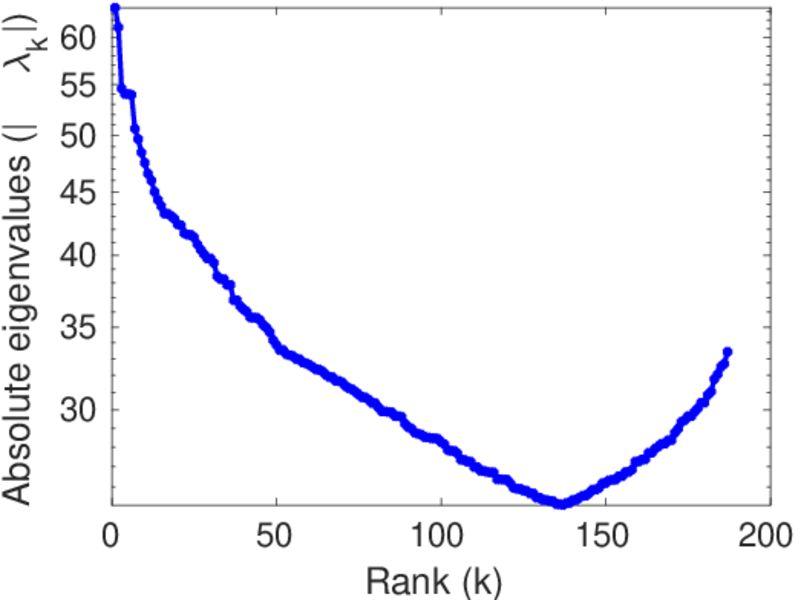
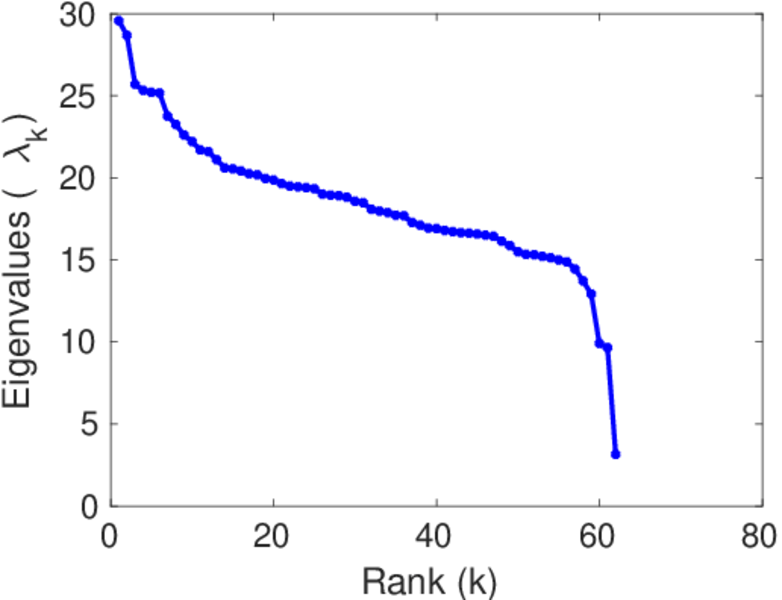
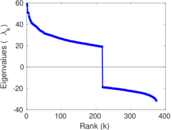
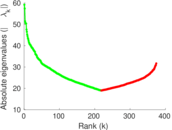
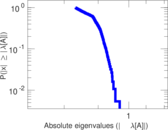
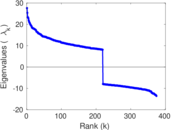
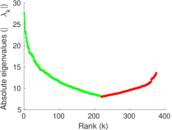
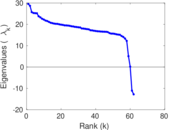
| Spectral norm | α = | 59.167 9
|
| Operator 2-norm | ν = | 31.946 0
|
| Cyclic eigenvalue | π = | 27.584 2
|
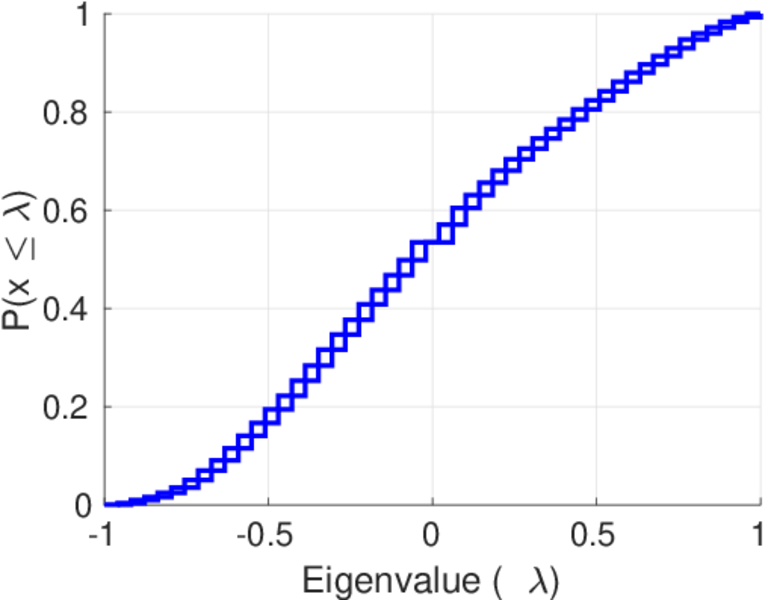
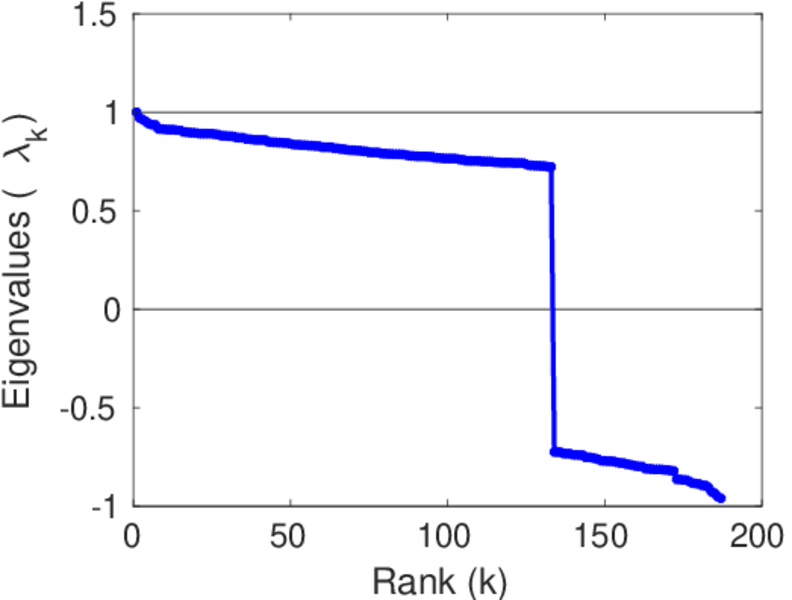
| Algebraic connectivity | a = | 0.510 714
|
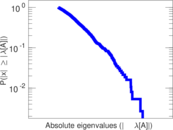
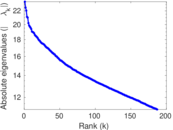
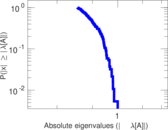
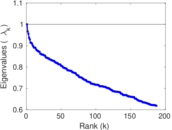
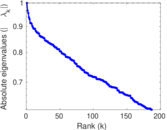
| Spectral separation | |λ1[A] / λ2[A]| = | 1.030 89
|
| Reciprocity | y = | 0.387 694
|
| Non-bipartivity | bA = | 0.548 498
|
| Normalized non-bipartivity | bN = | 0.216 902
|
| Algebraic non-bipartivity | χ = | 0.319 993
|
| Spectral bipartite frustration | bK = | 0.009 713 80
|
| Controllability | C = | 299
|
| Relative controllability | Cr = | 0.117 763
|
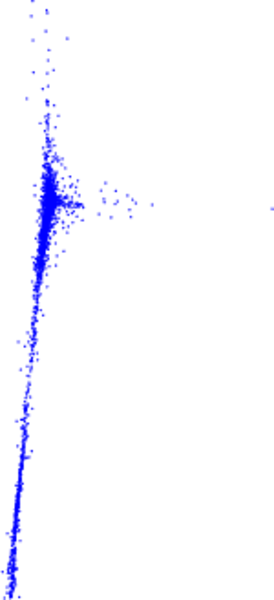
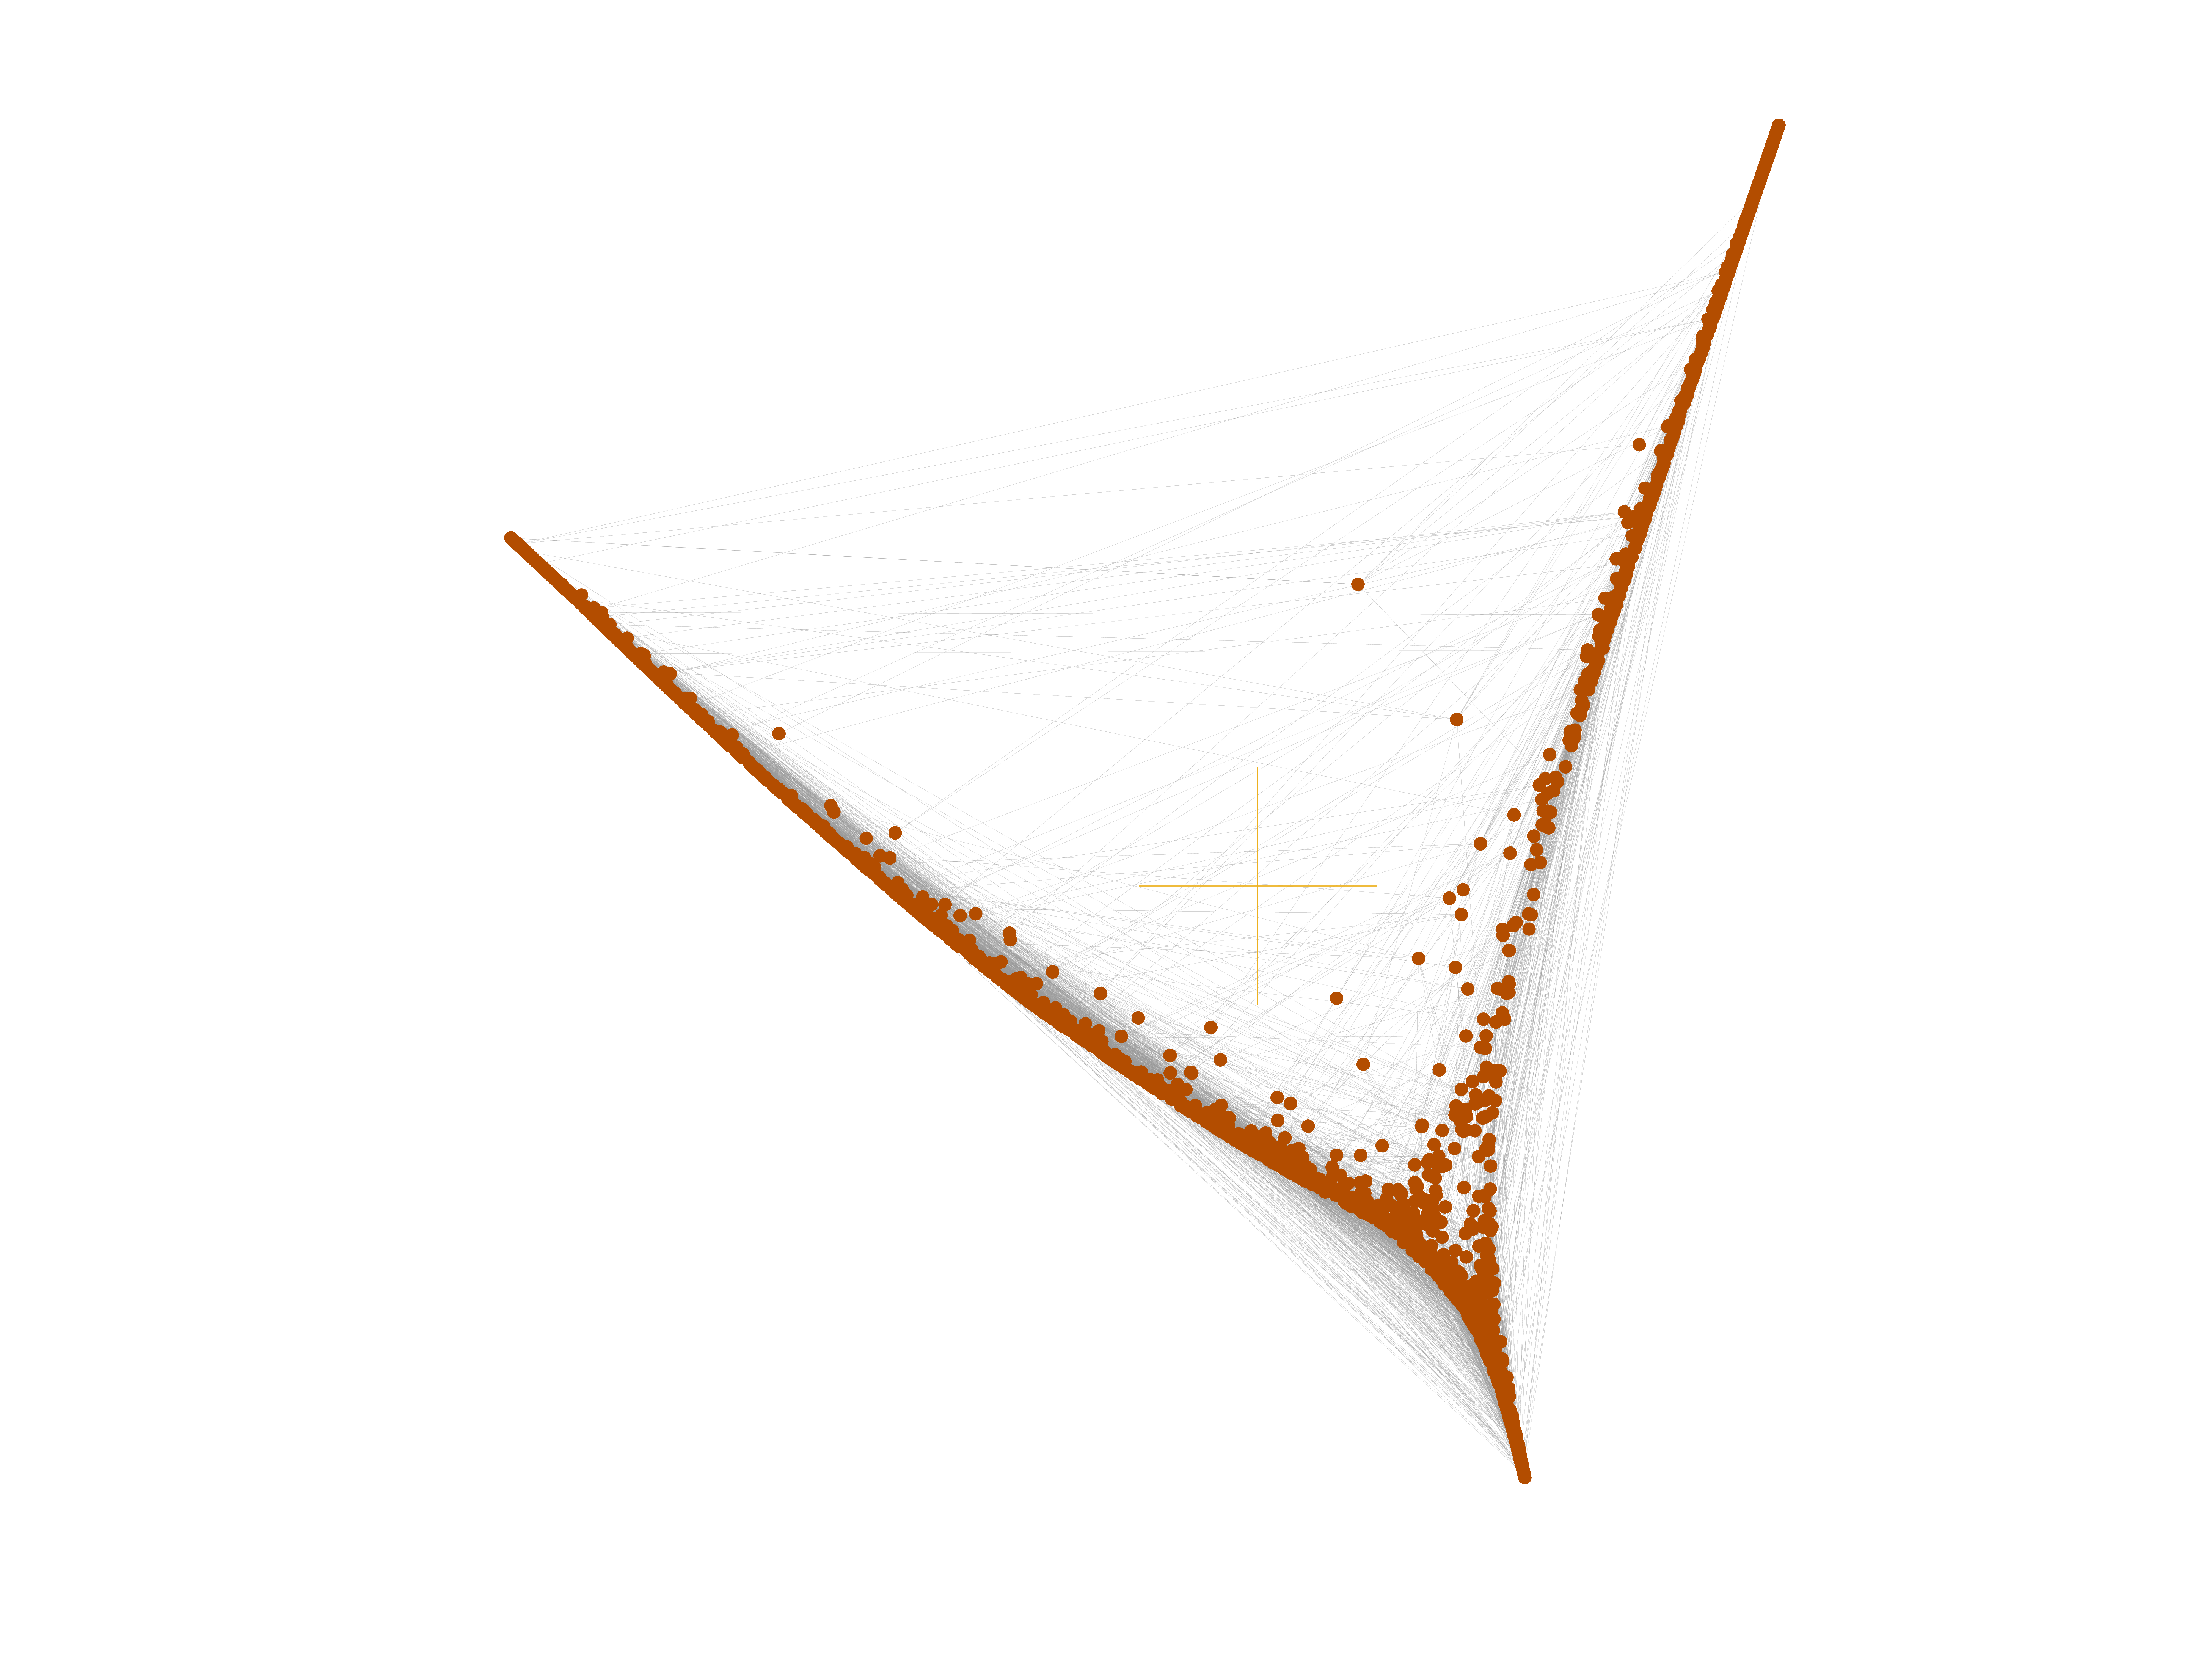
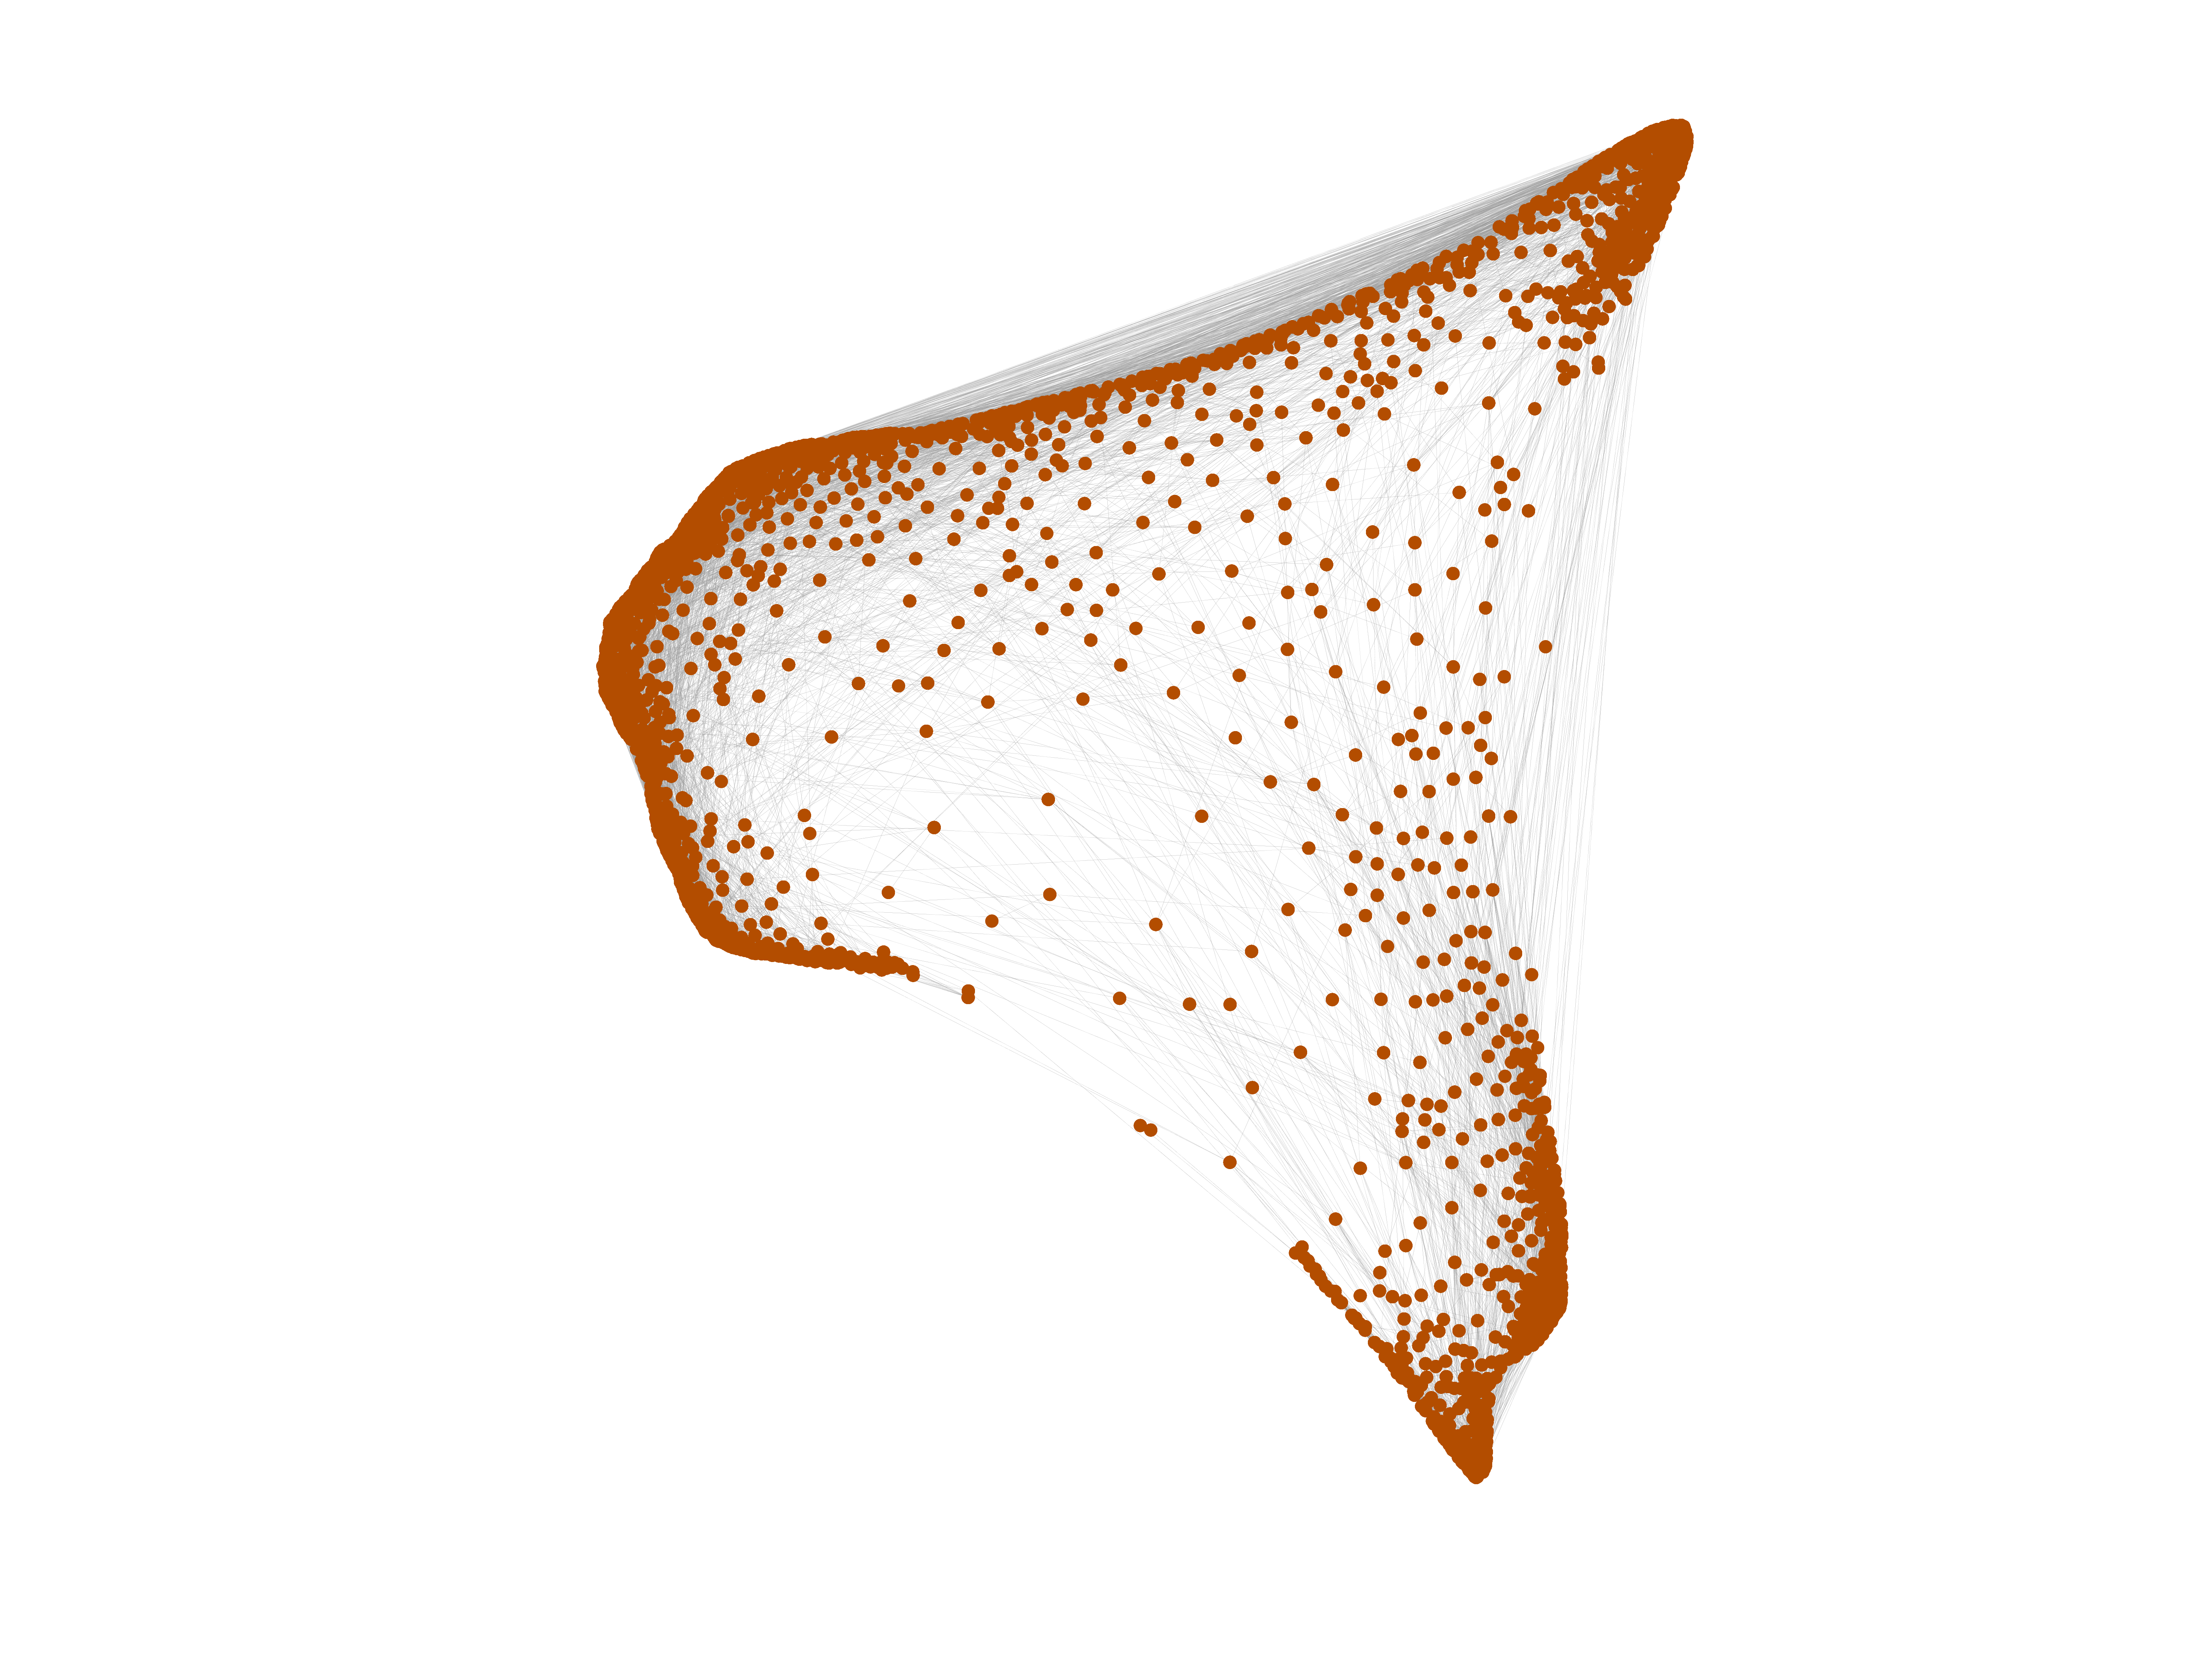
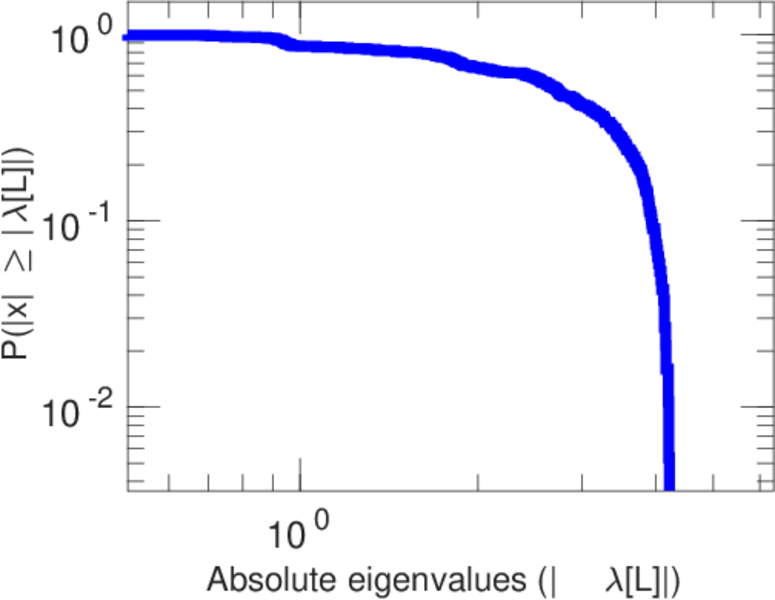
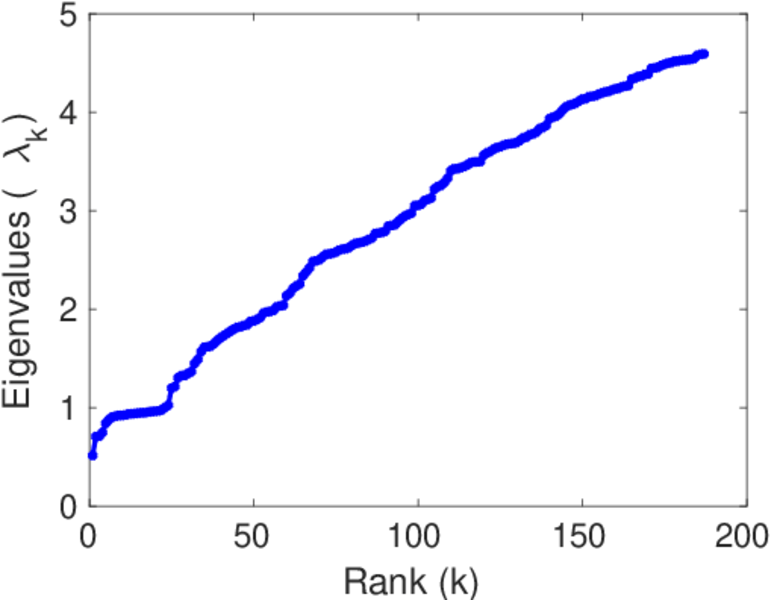
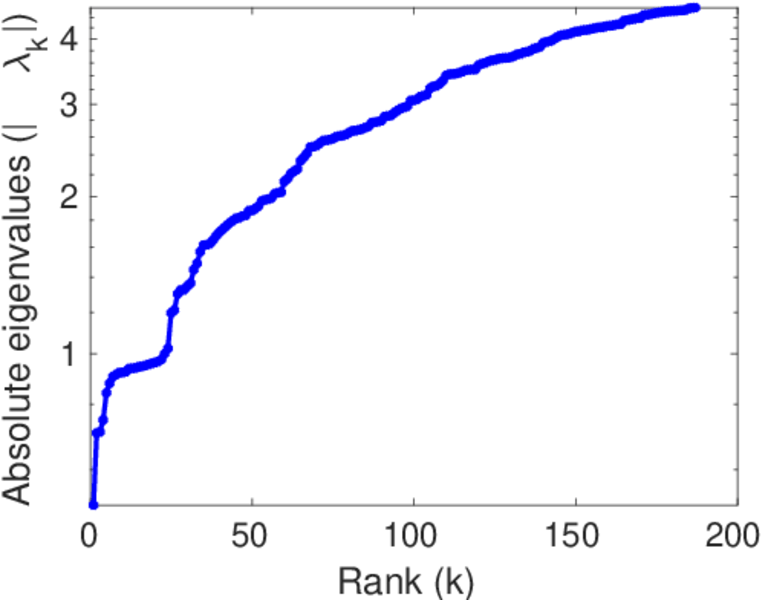
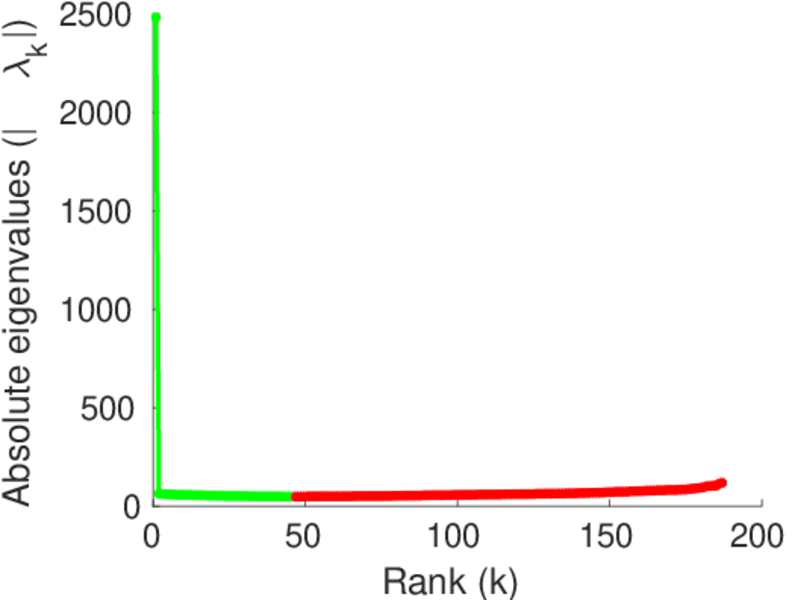
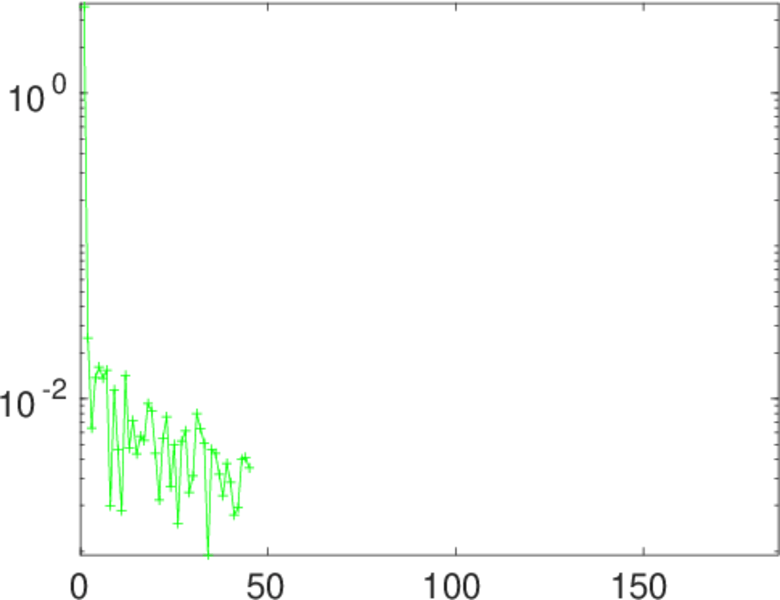
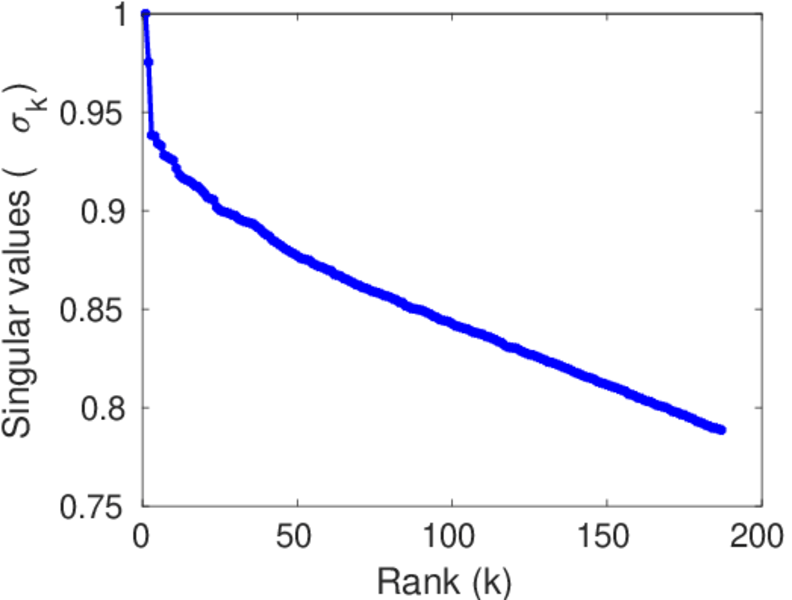
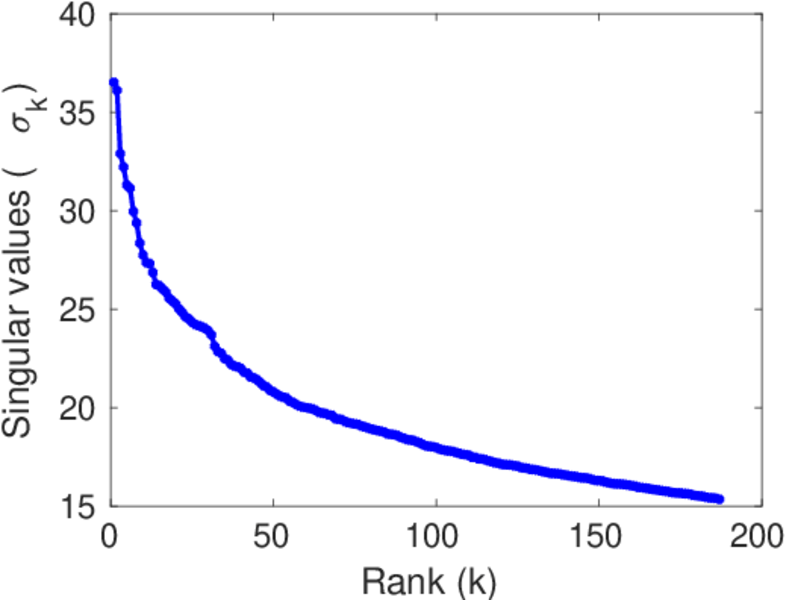
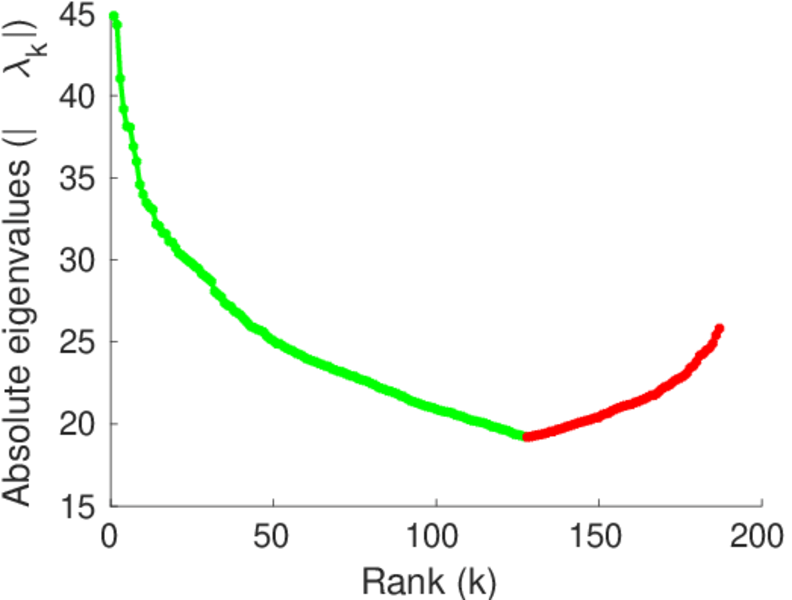
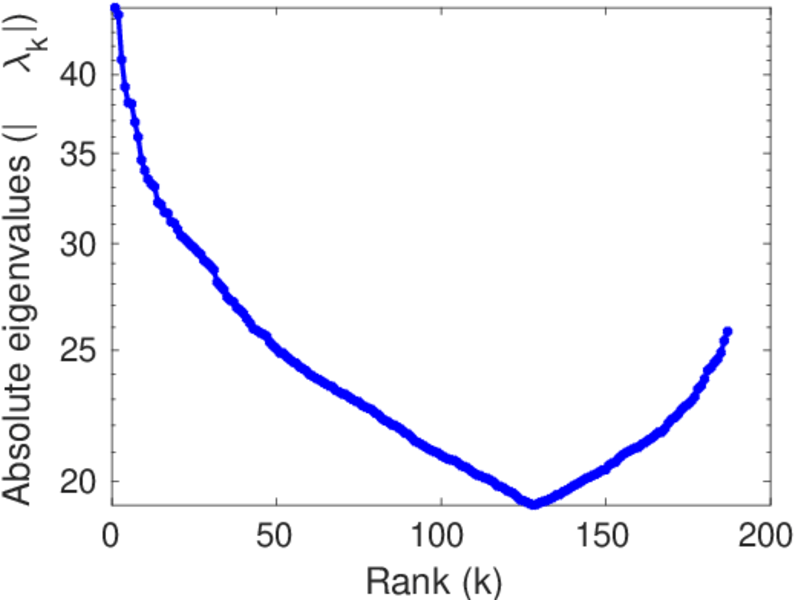
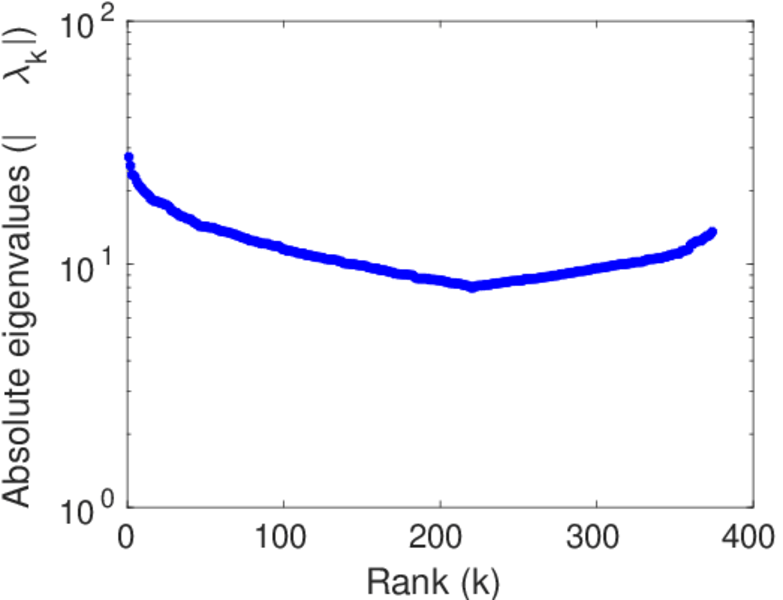
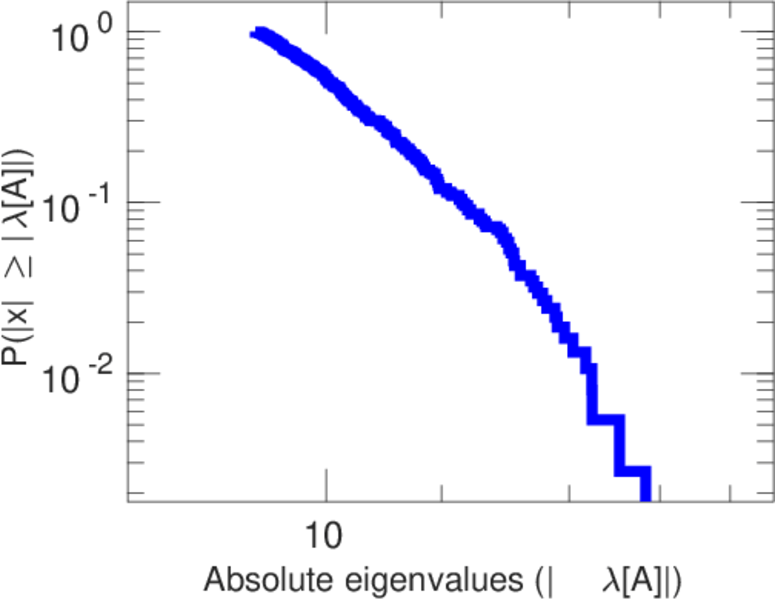
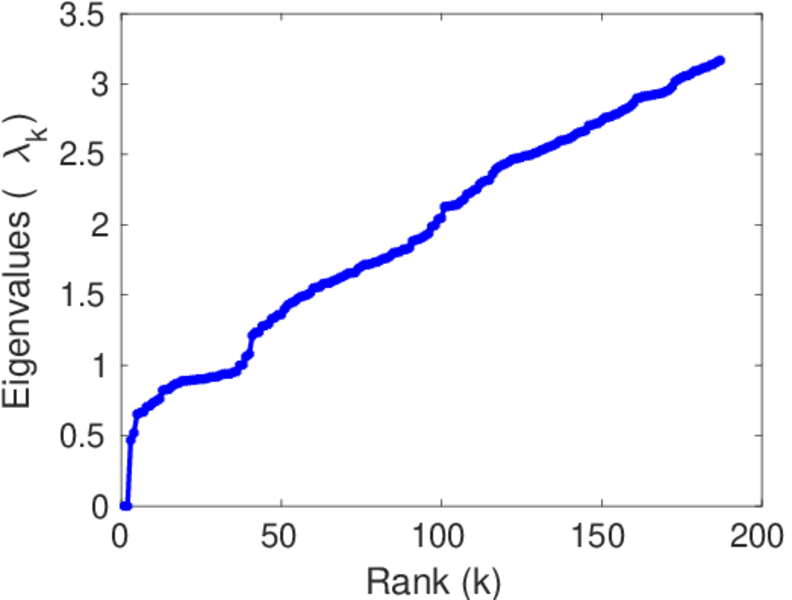
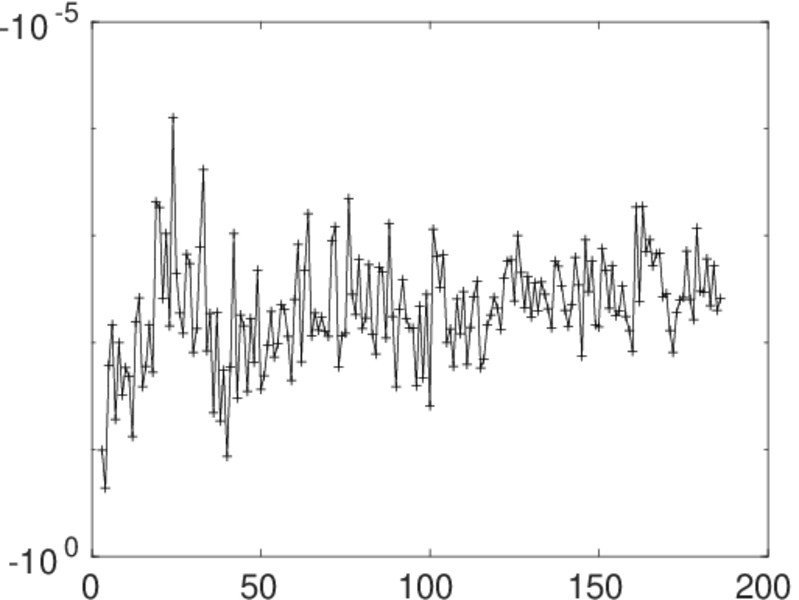
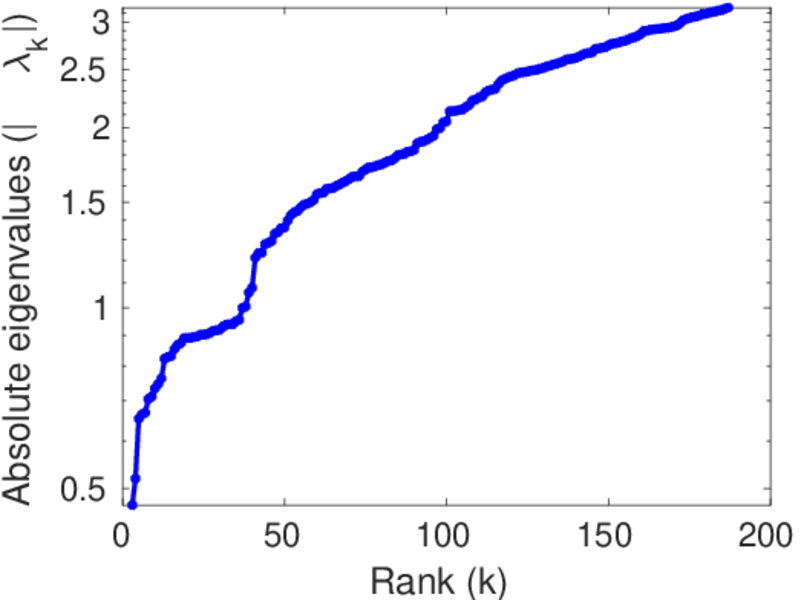
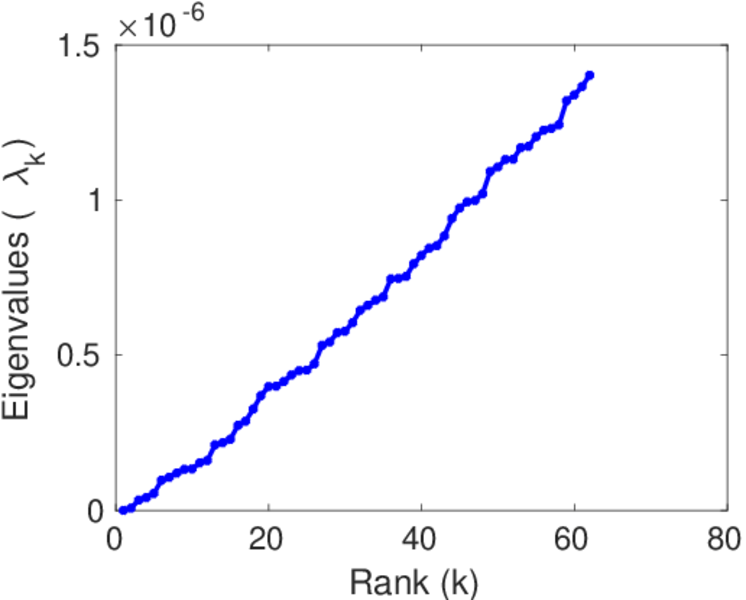
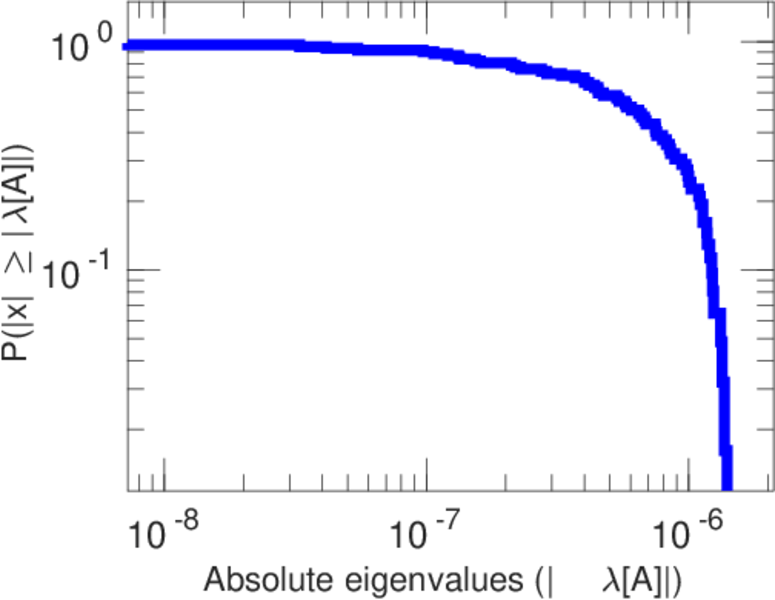
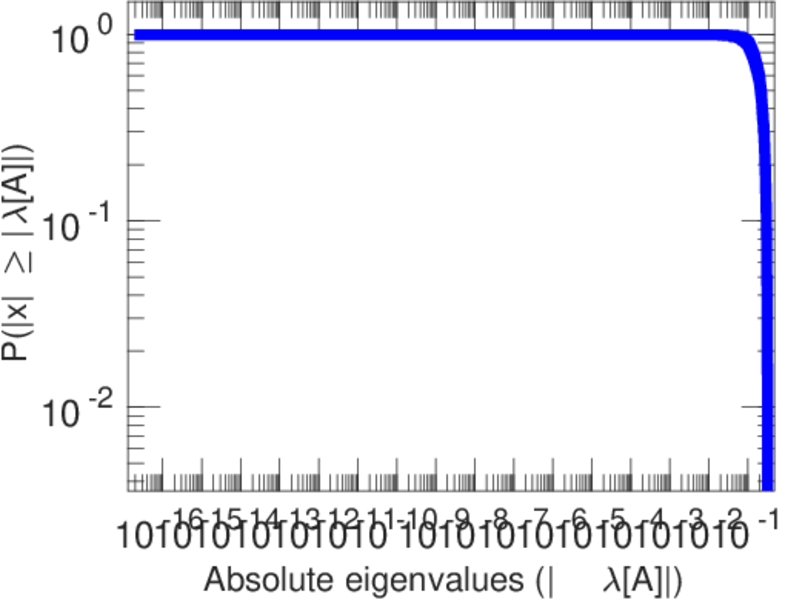
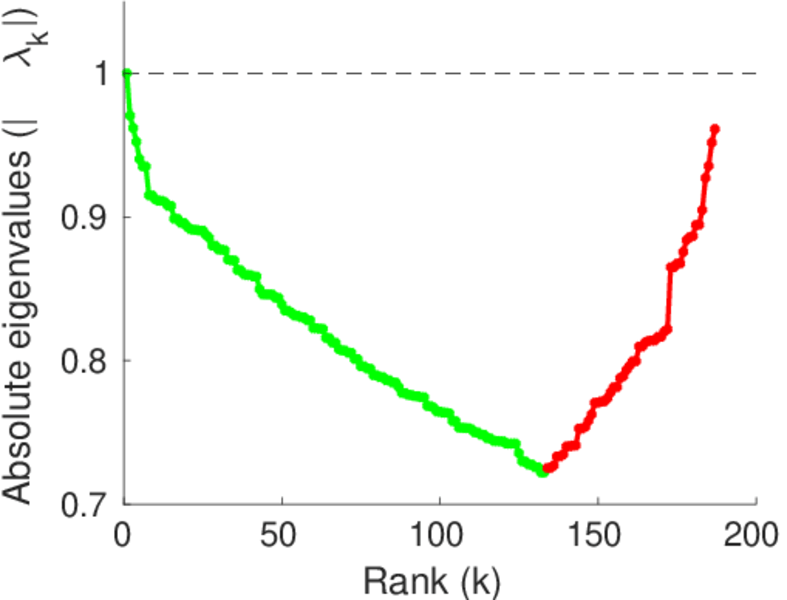
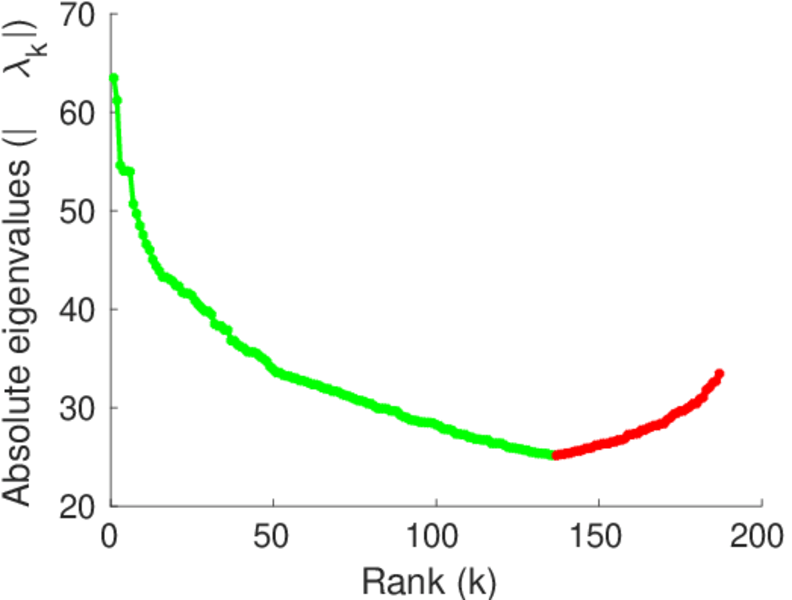
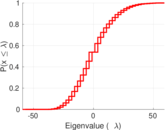
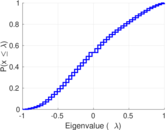
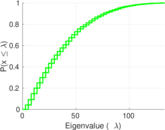
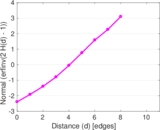
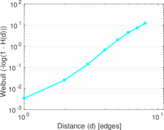
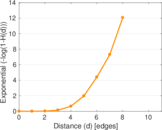
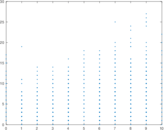
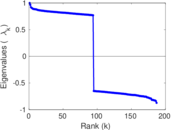
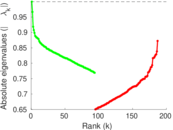
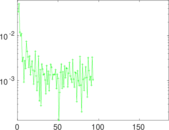
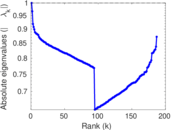
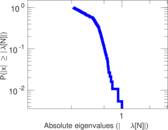
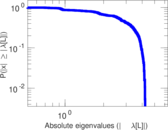
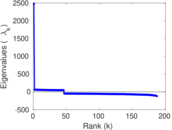
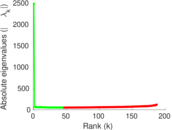
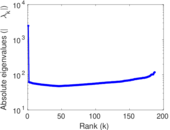
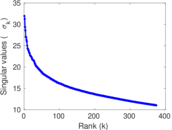
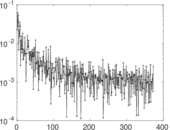
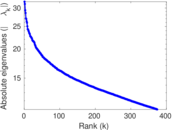
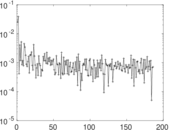
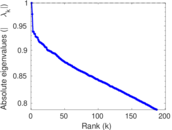
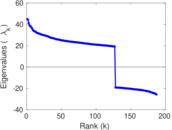
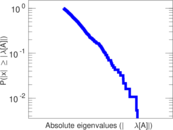
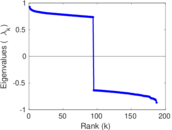
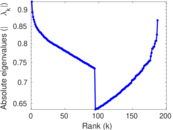
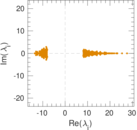
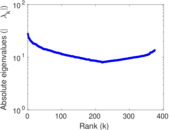
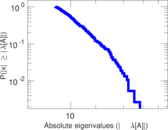
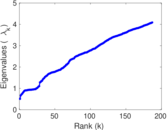
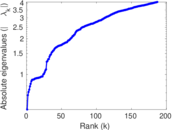
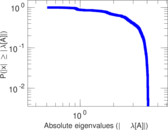
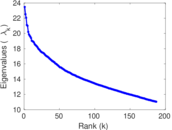
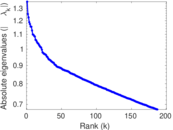
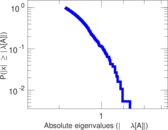
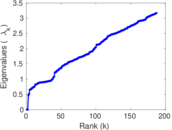
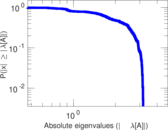
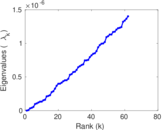
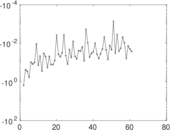
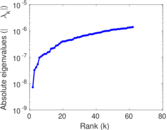
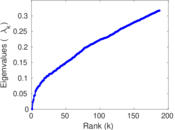
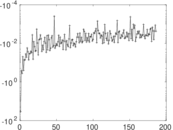
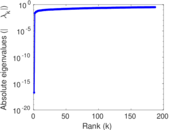
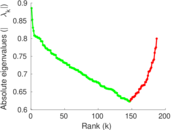
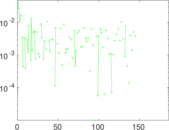
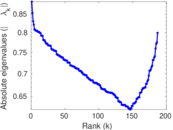
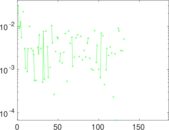
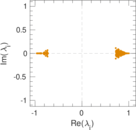
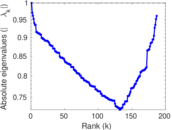
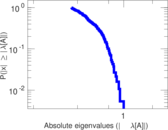
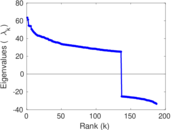
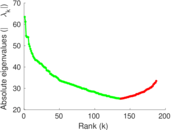
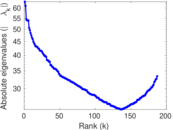
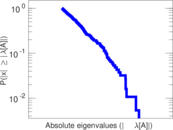
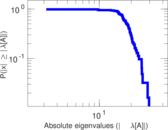
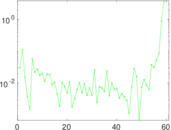
Plots


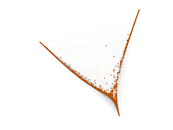


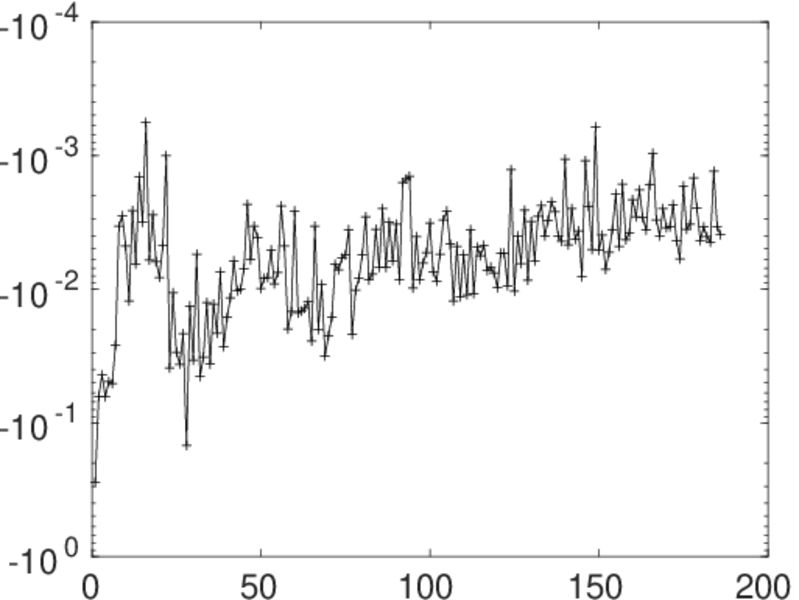
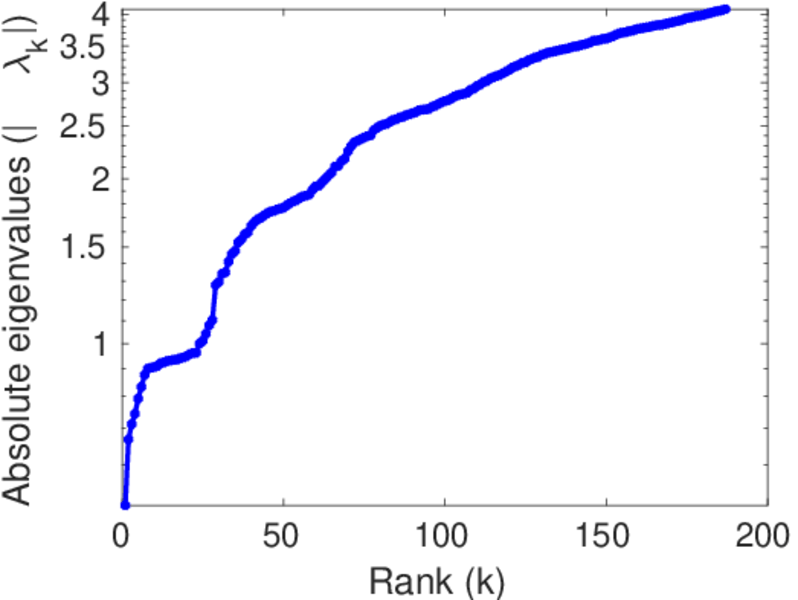
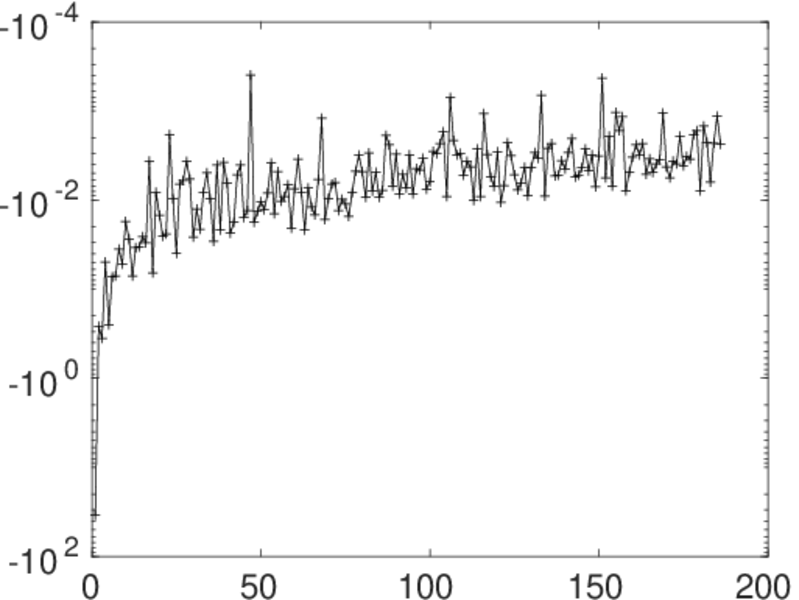
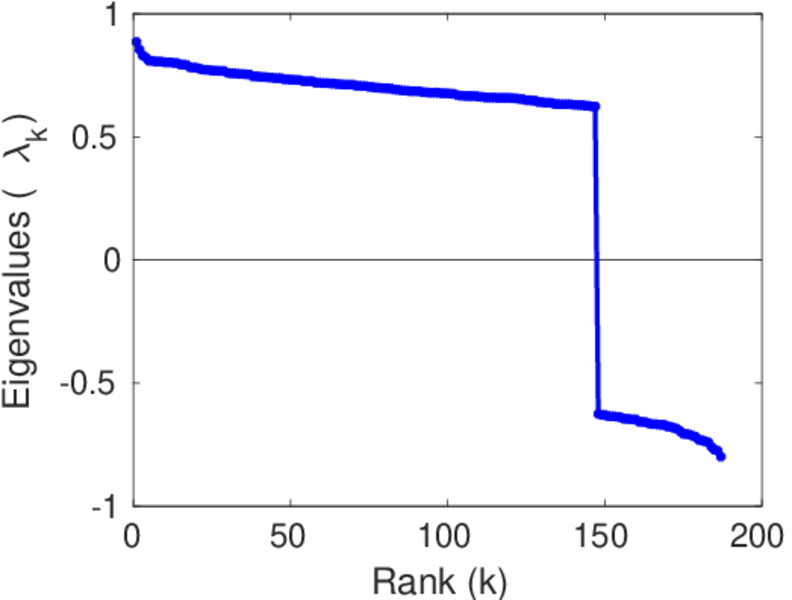
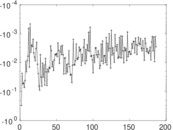
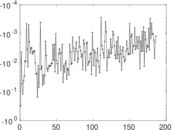
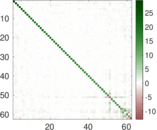
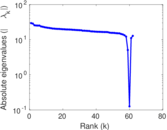
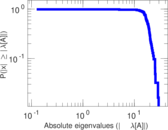
Matrix decompositions plots


Downloads
References
|
[1]
|
Jérôme Kunegis.
KONECT – The Koblenz Network Collection.
In Proc. Int. Conf. on World Wide Web Companion, pages
1343–1350, 2013.
[ http ]
|
|
[2]
|
James Moody.
Peer influence groups: Identifying dense clusters in large networks.
Soc. Netw., 23(4):261–283, 2001.
|
 KONECT ‣ Networks ‣
Buy Me a Coffee
KONECT ‣ Networks ‣
Buy Me a Coffee