 KONECT ‣ Networks ‣
Buy Me a Coffee
KONECT ‣ Networks ‣
Buy Me a Coffee
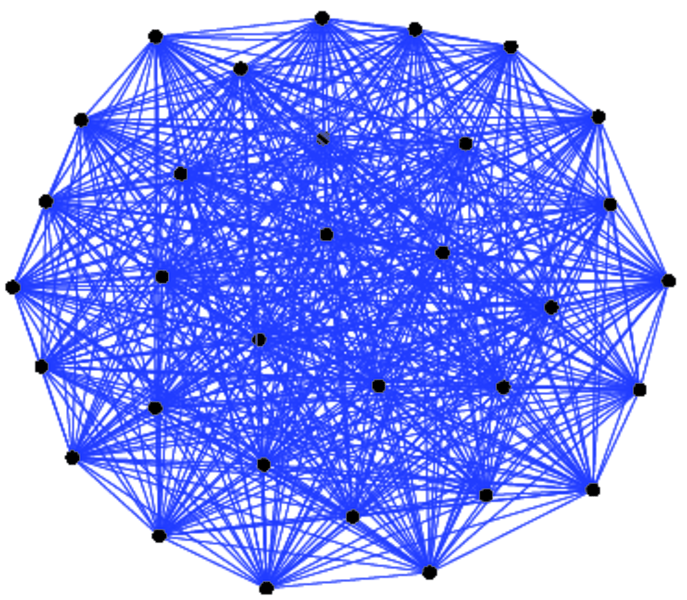
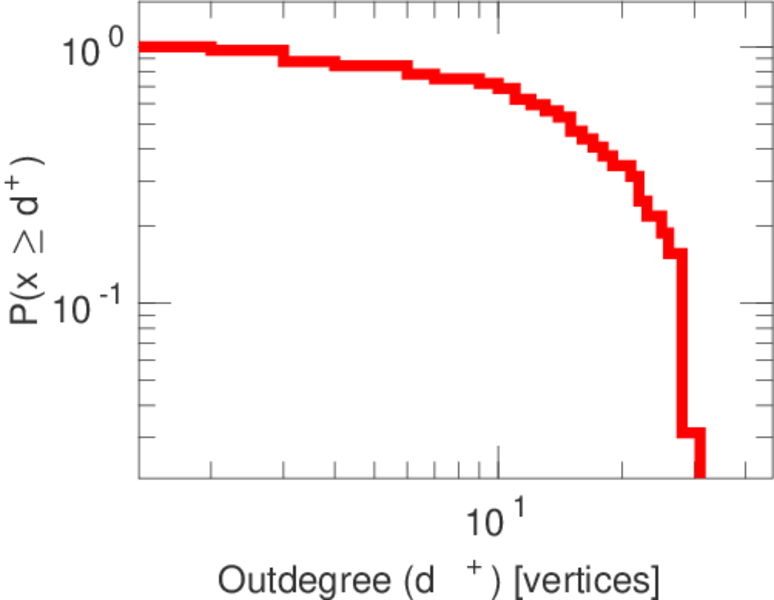
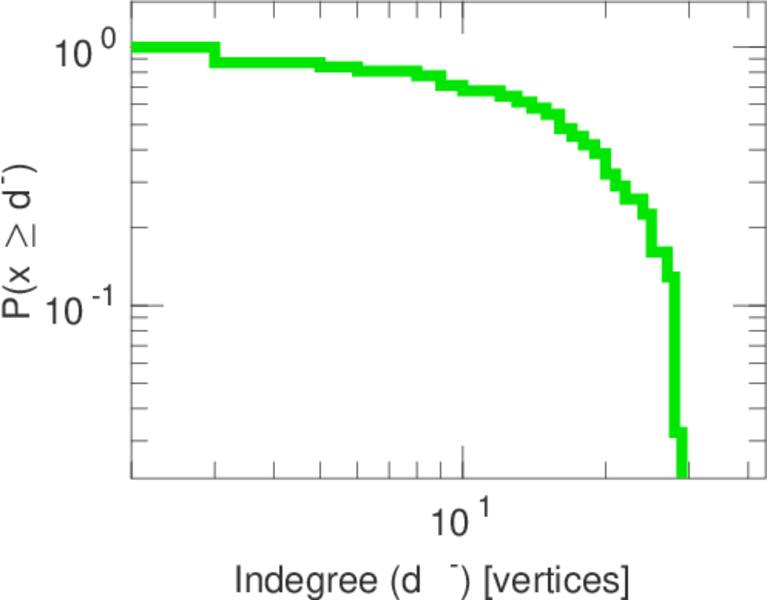
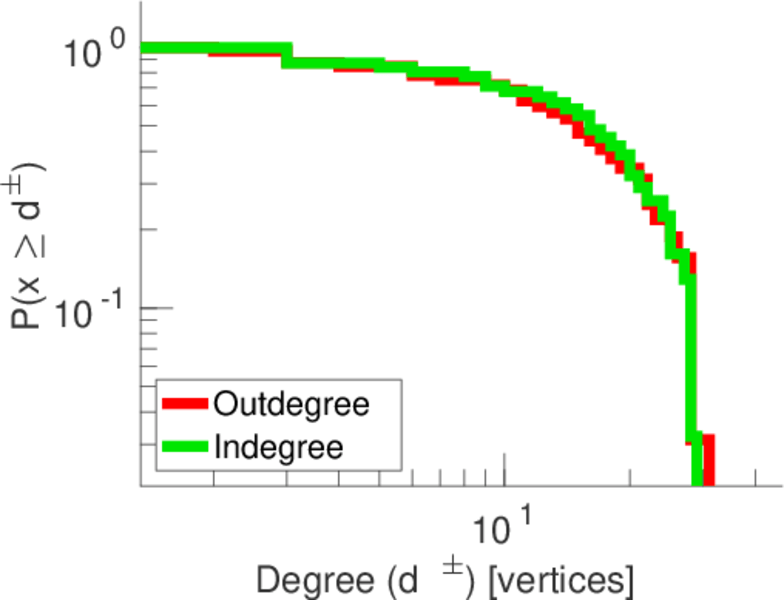
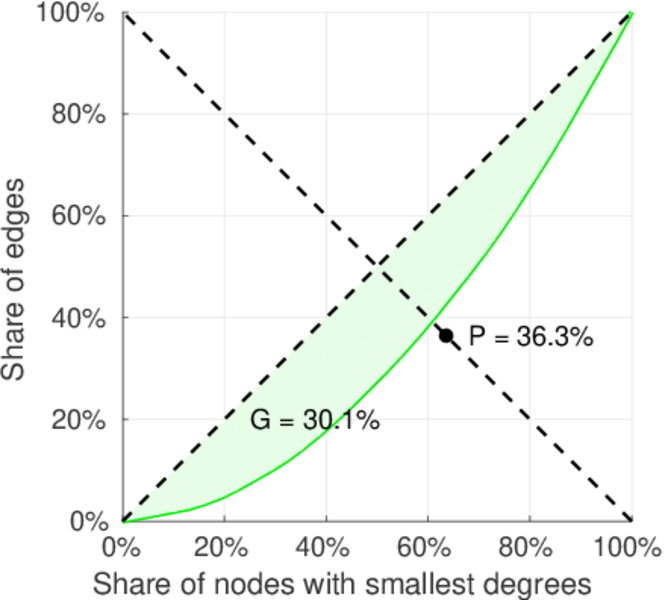
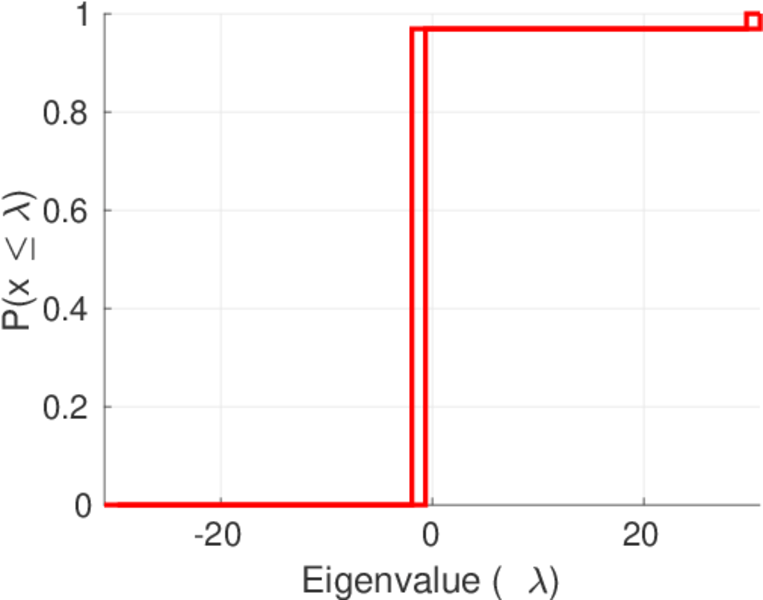
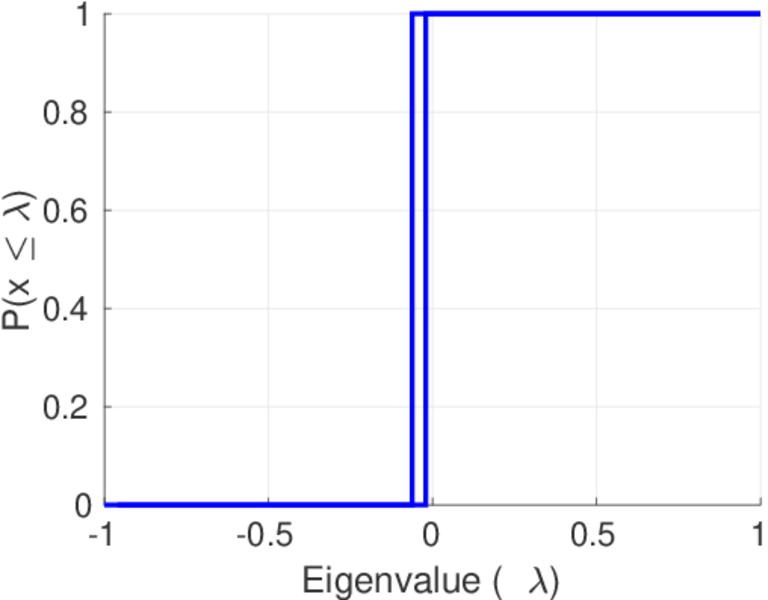
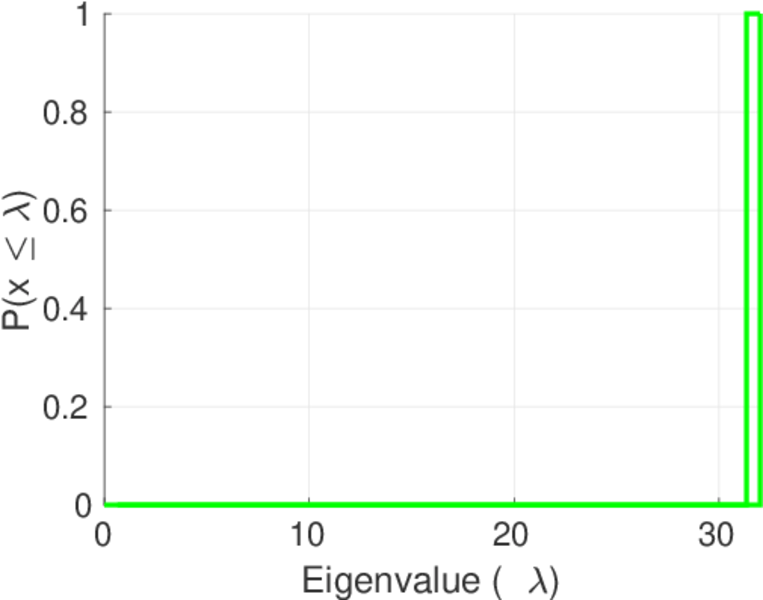
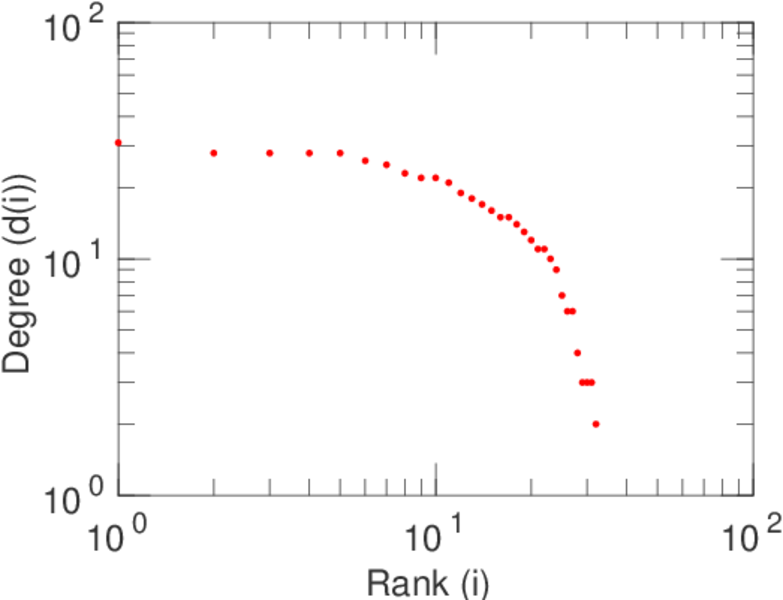
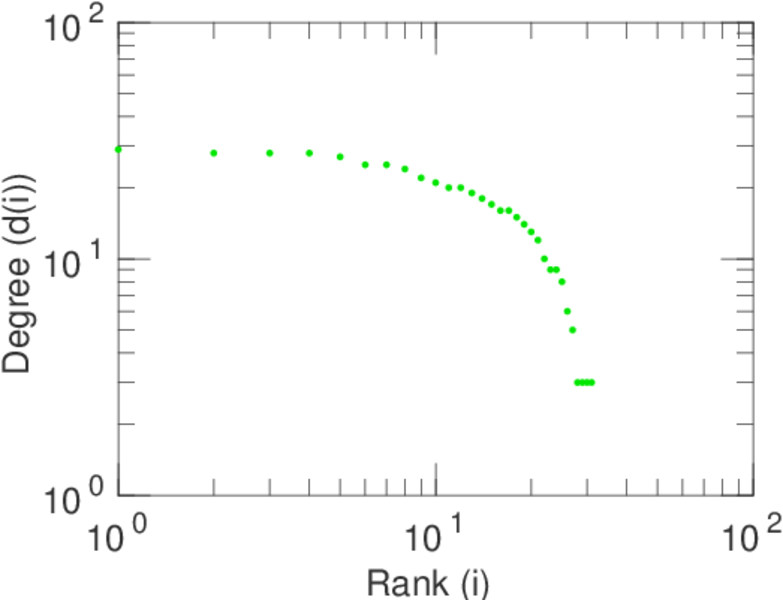
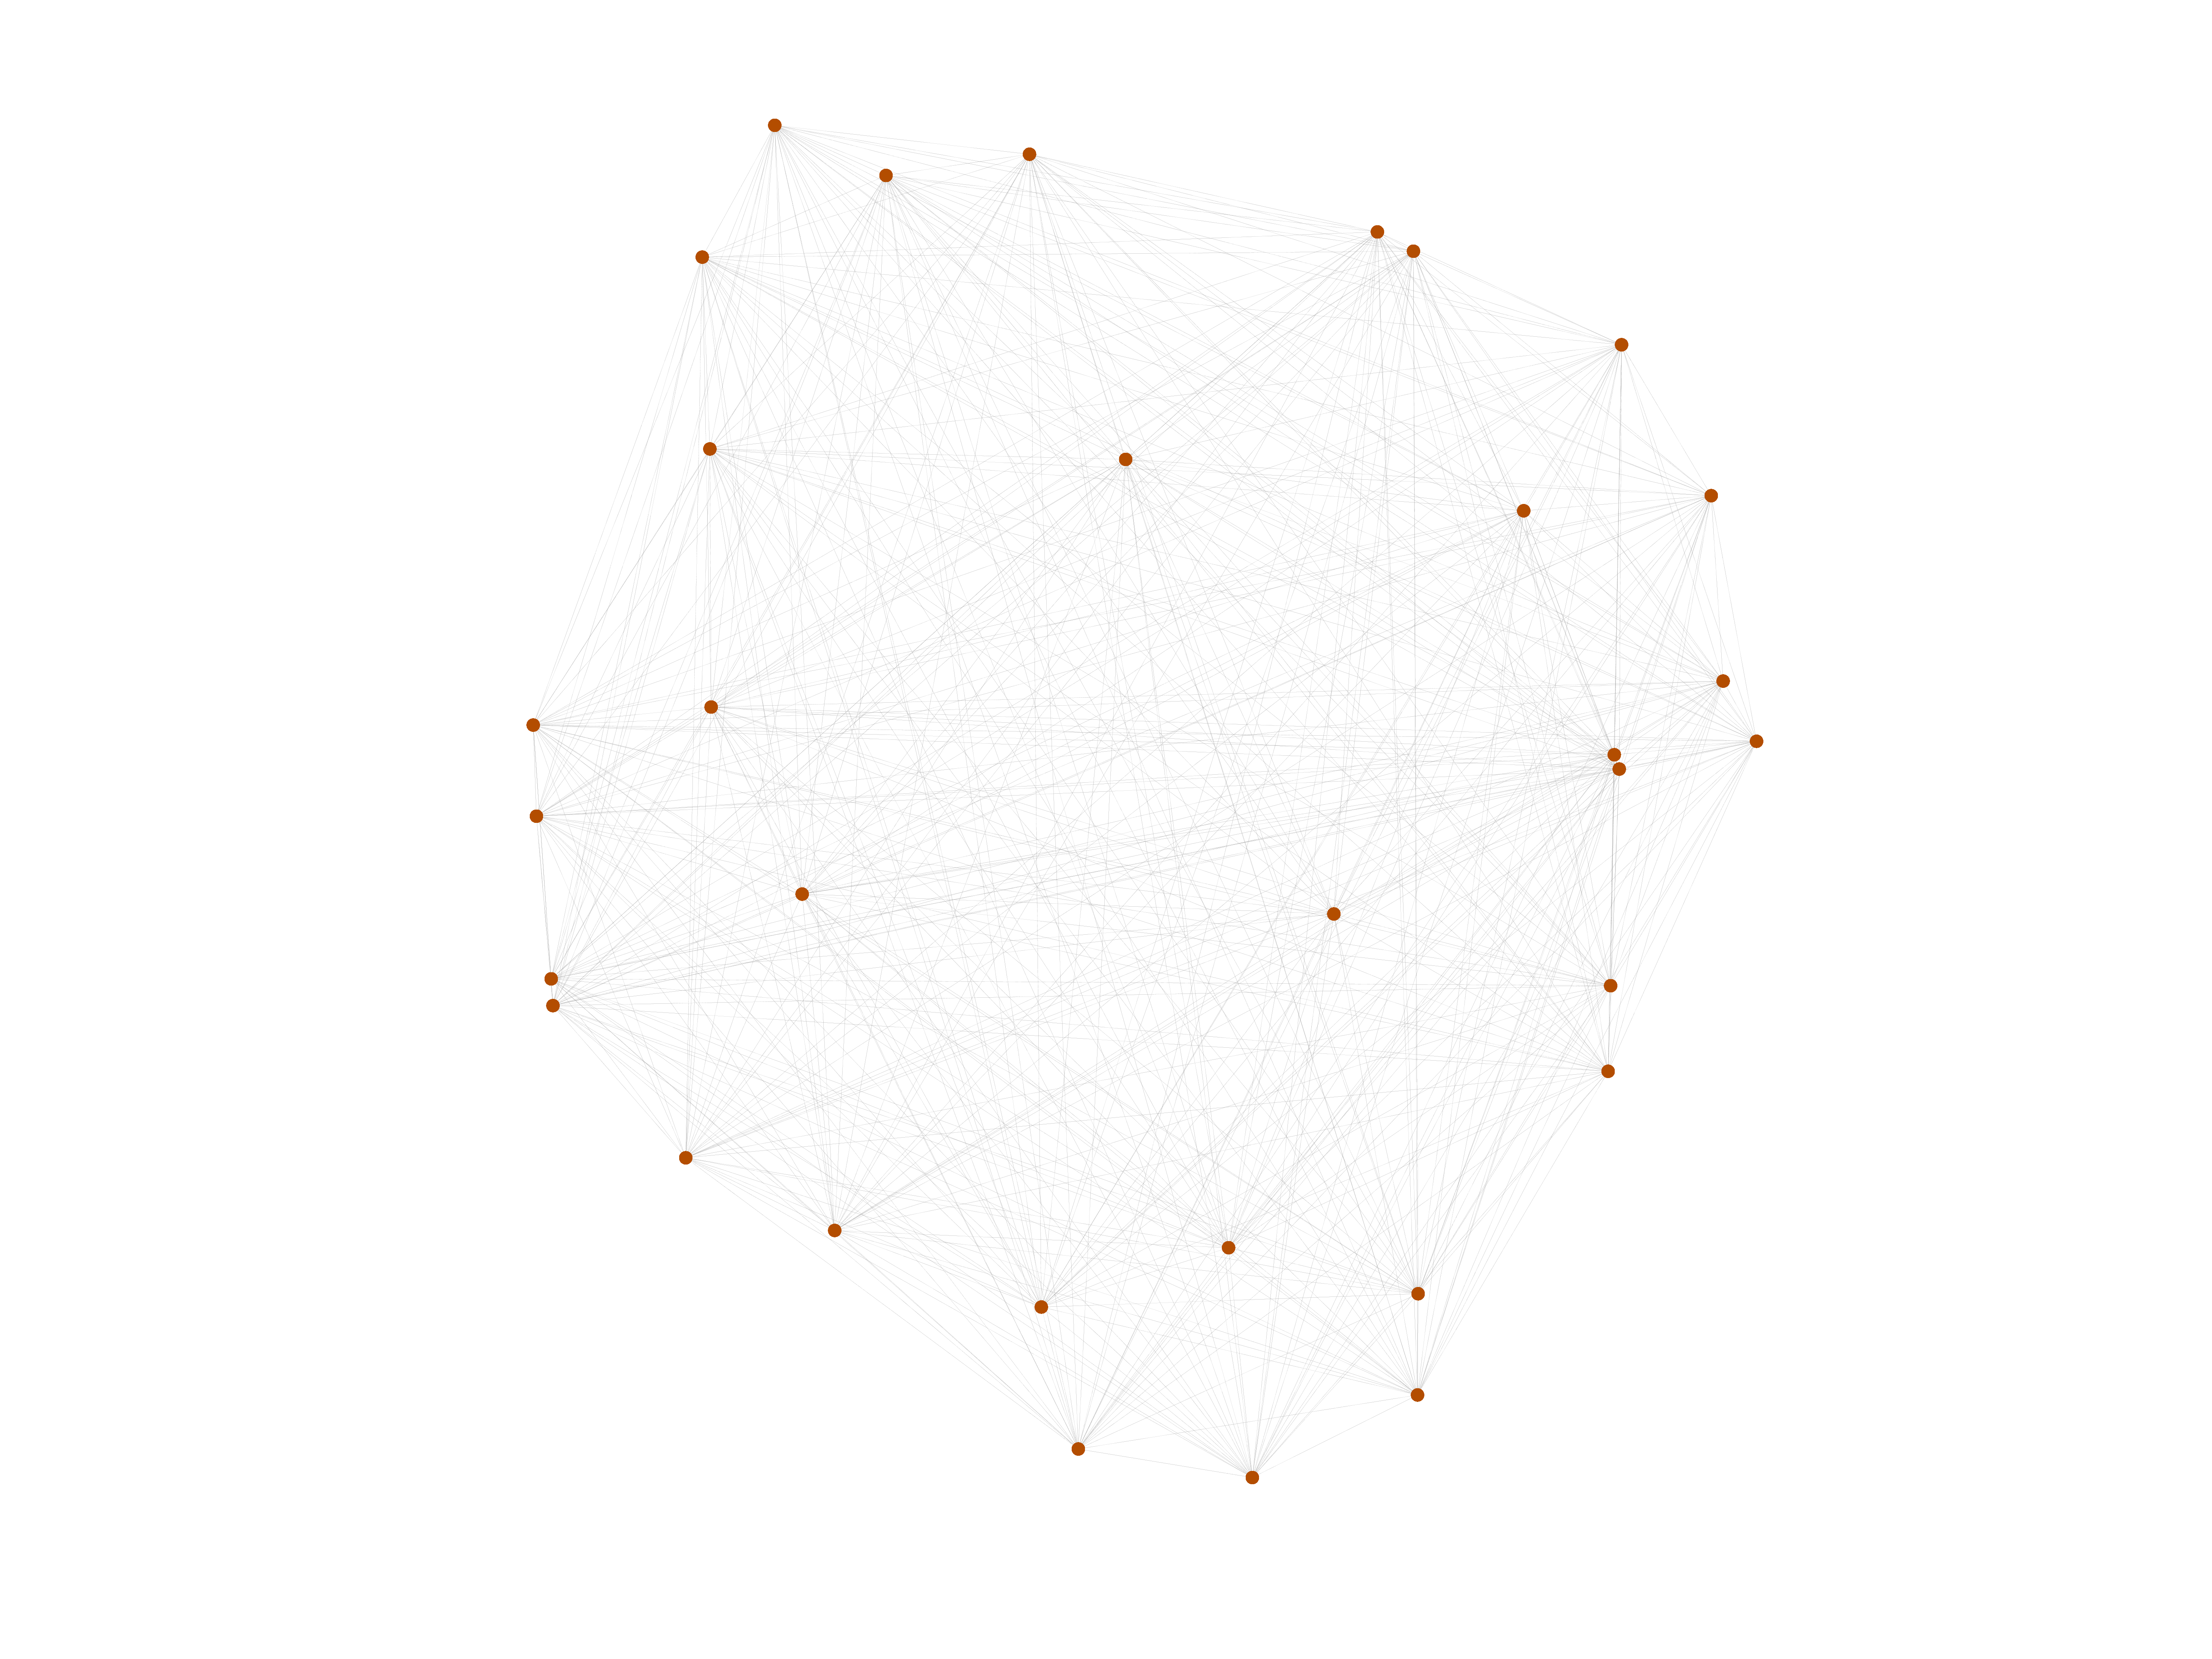
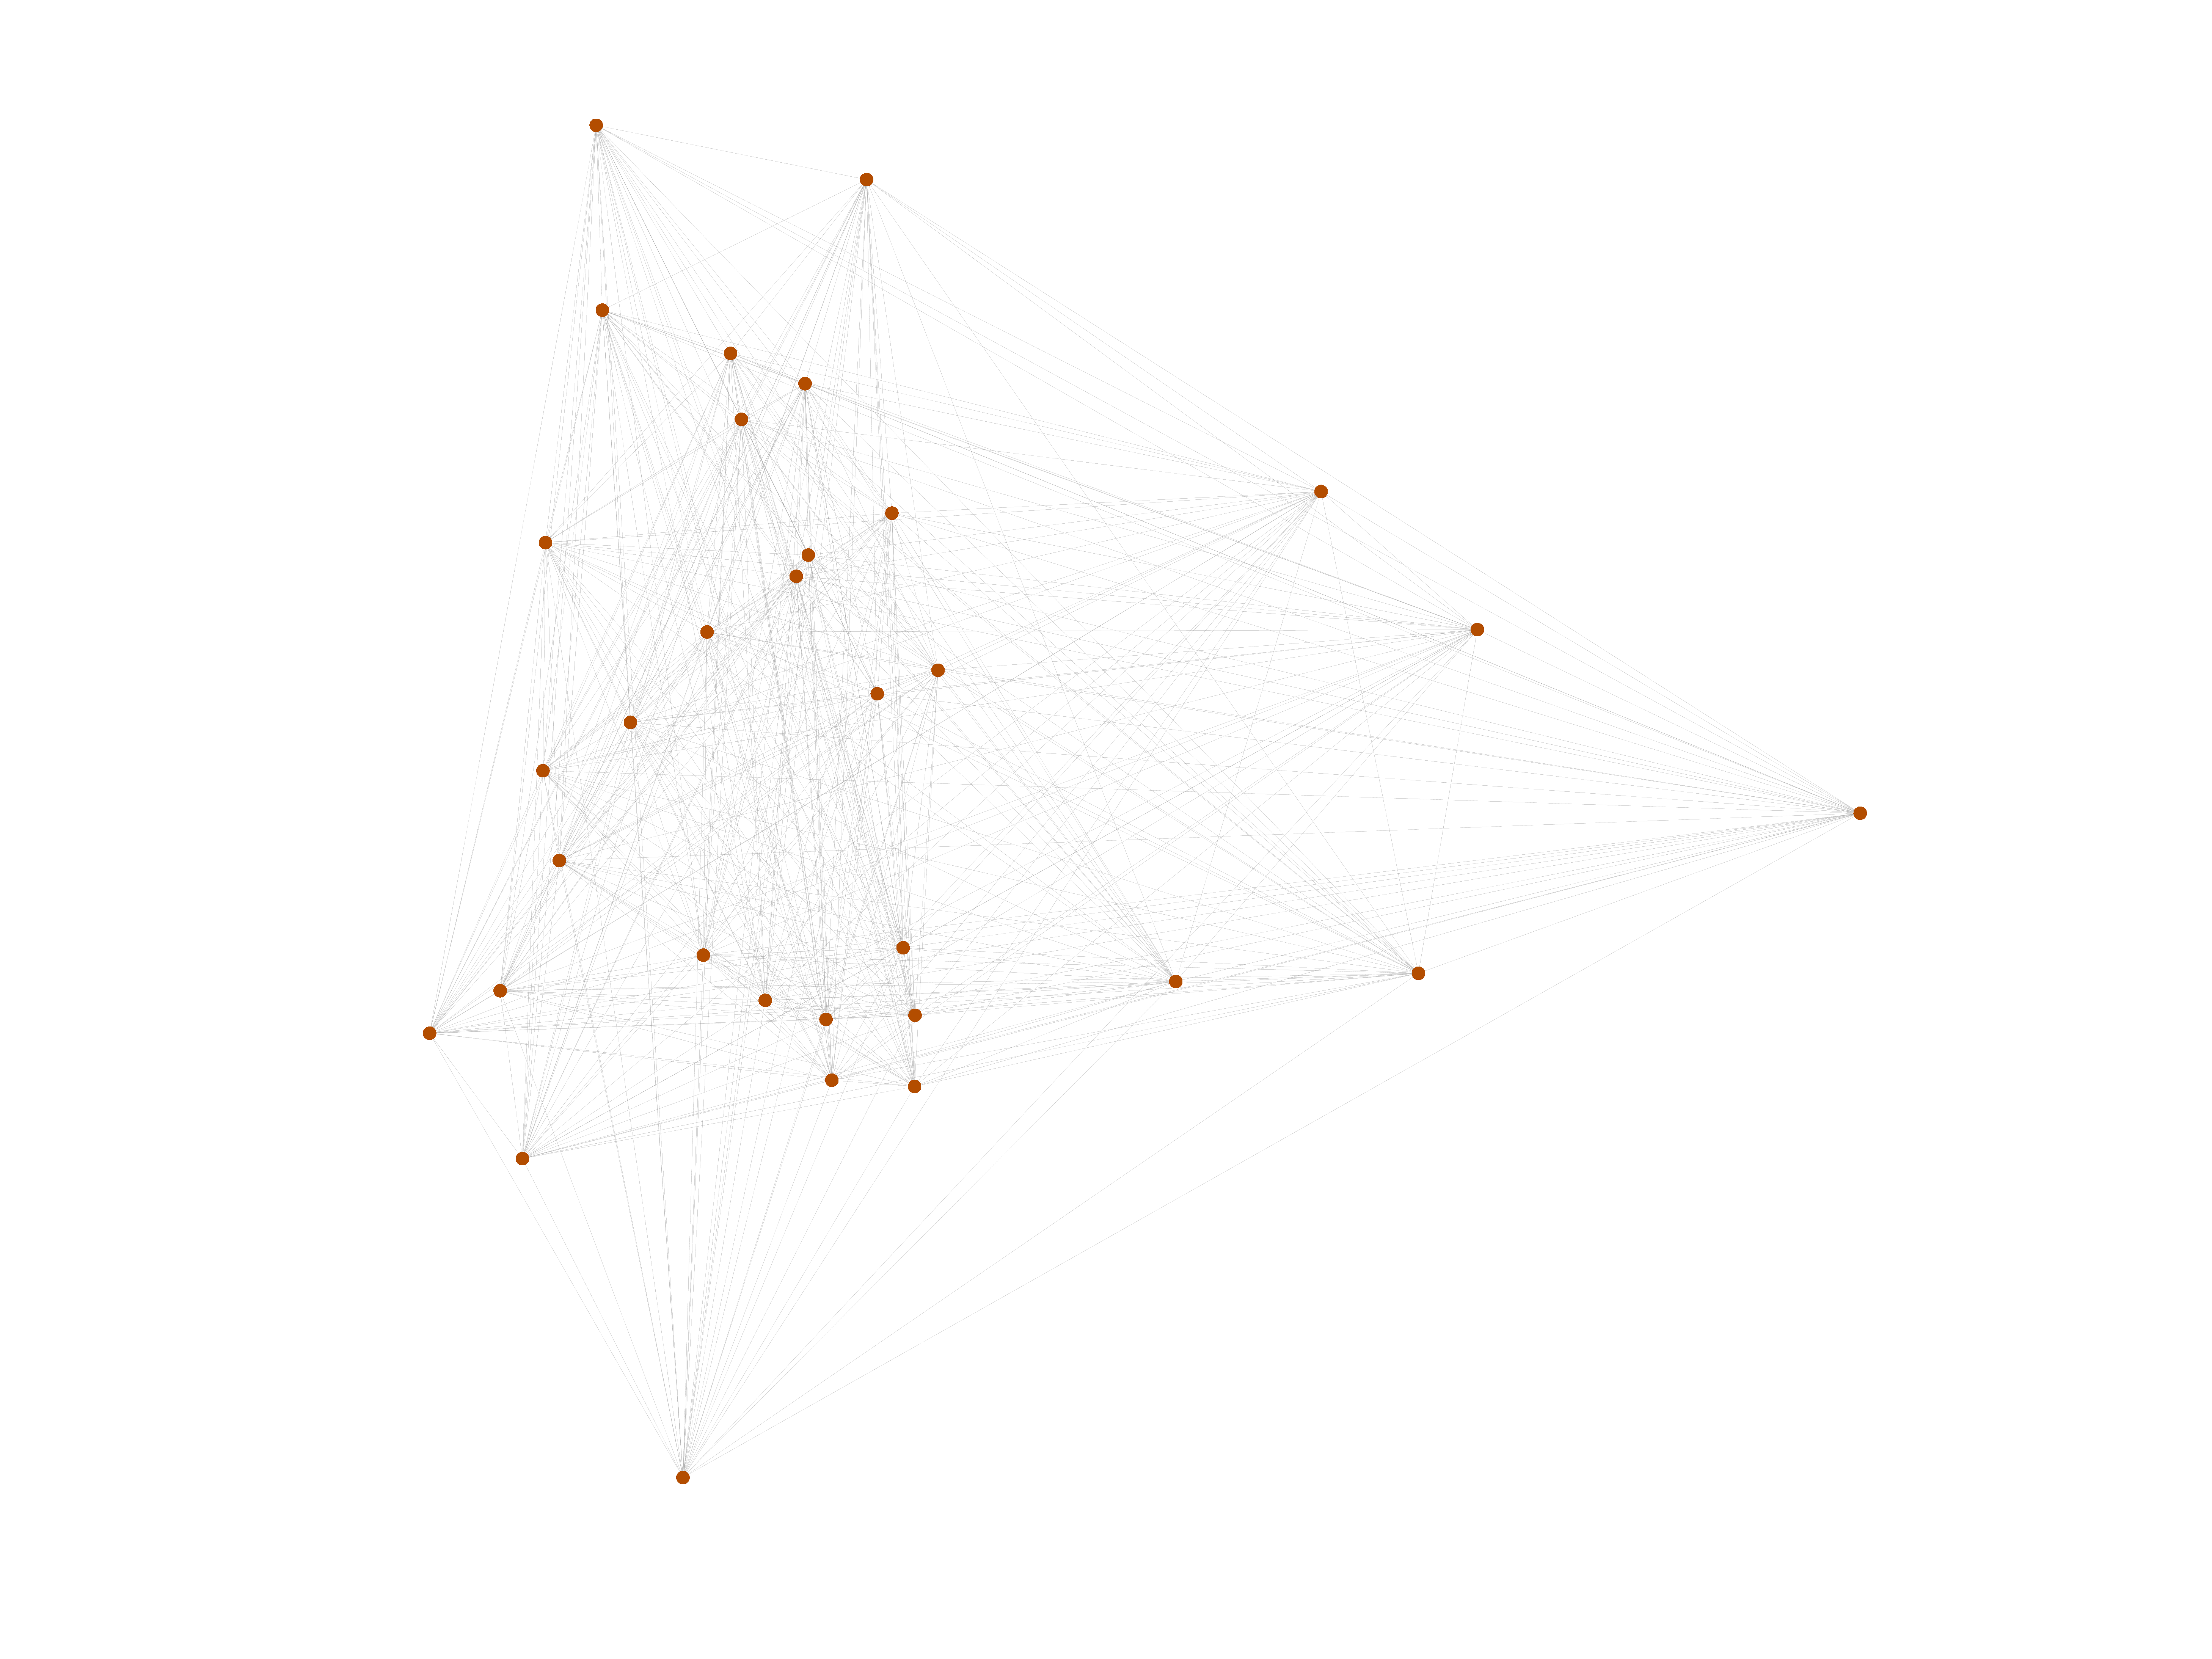
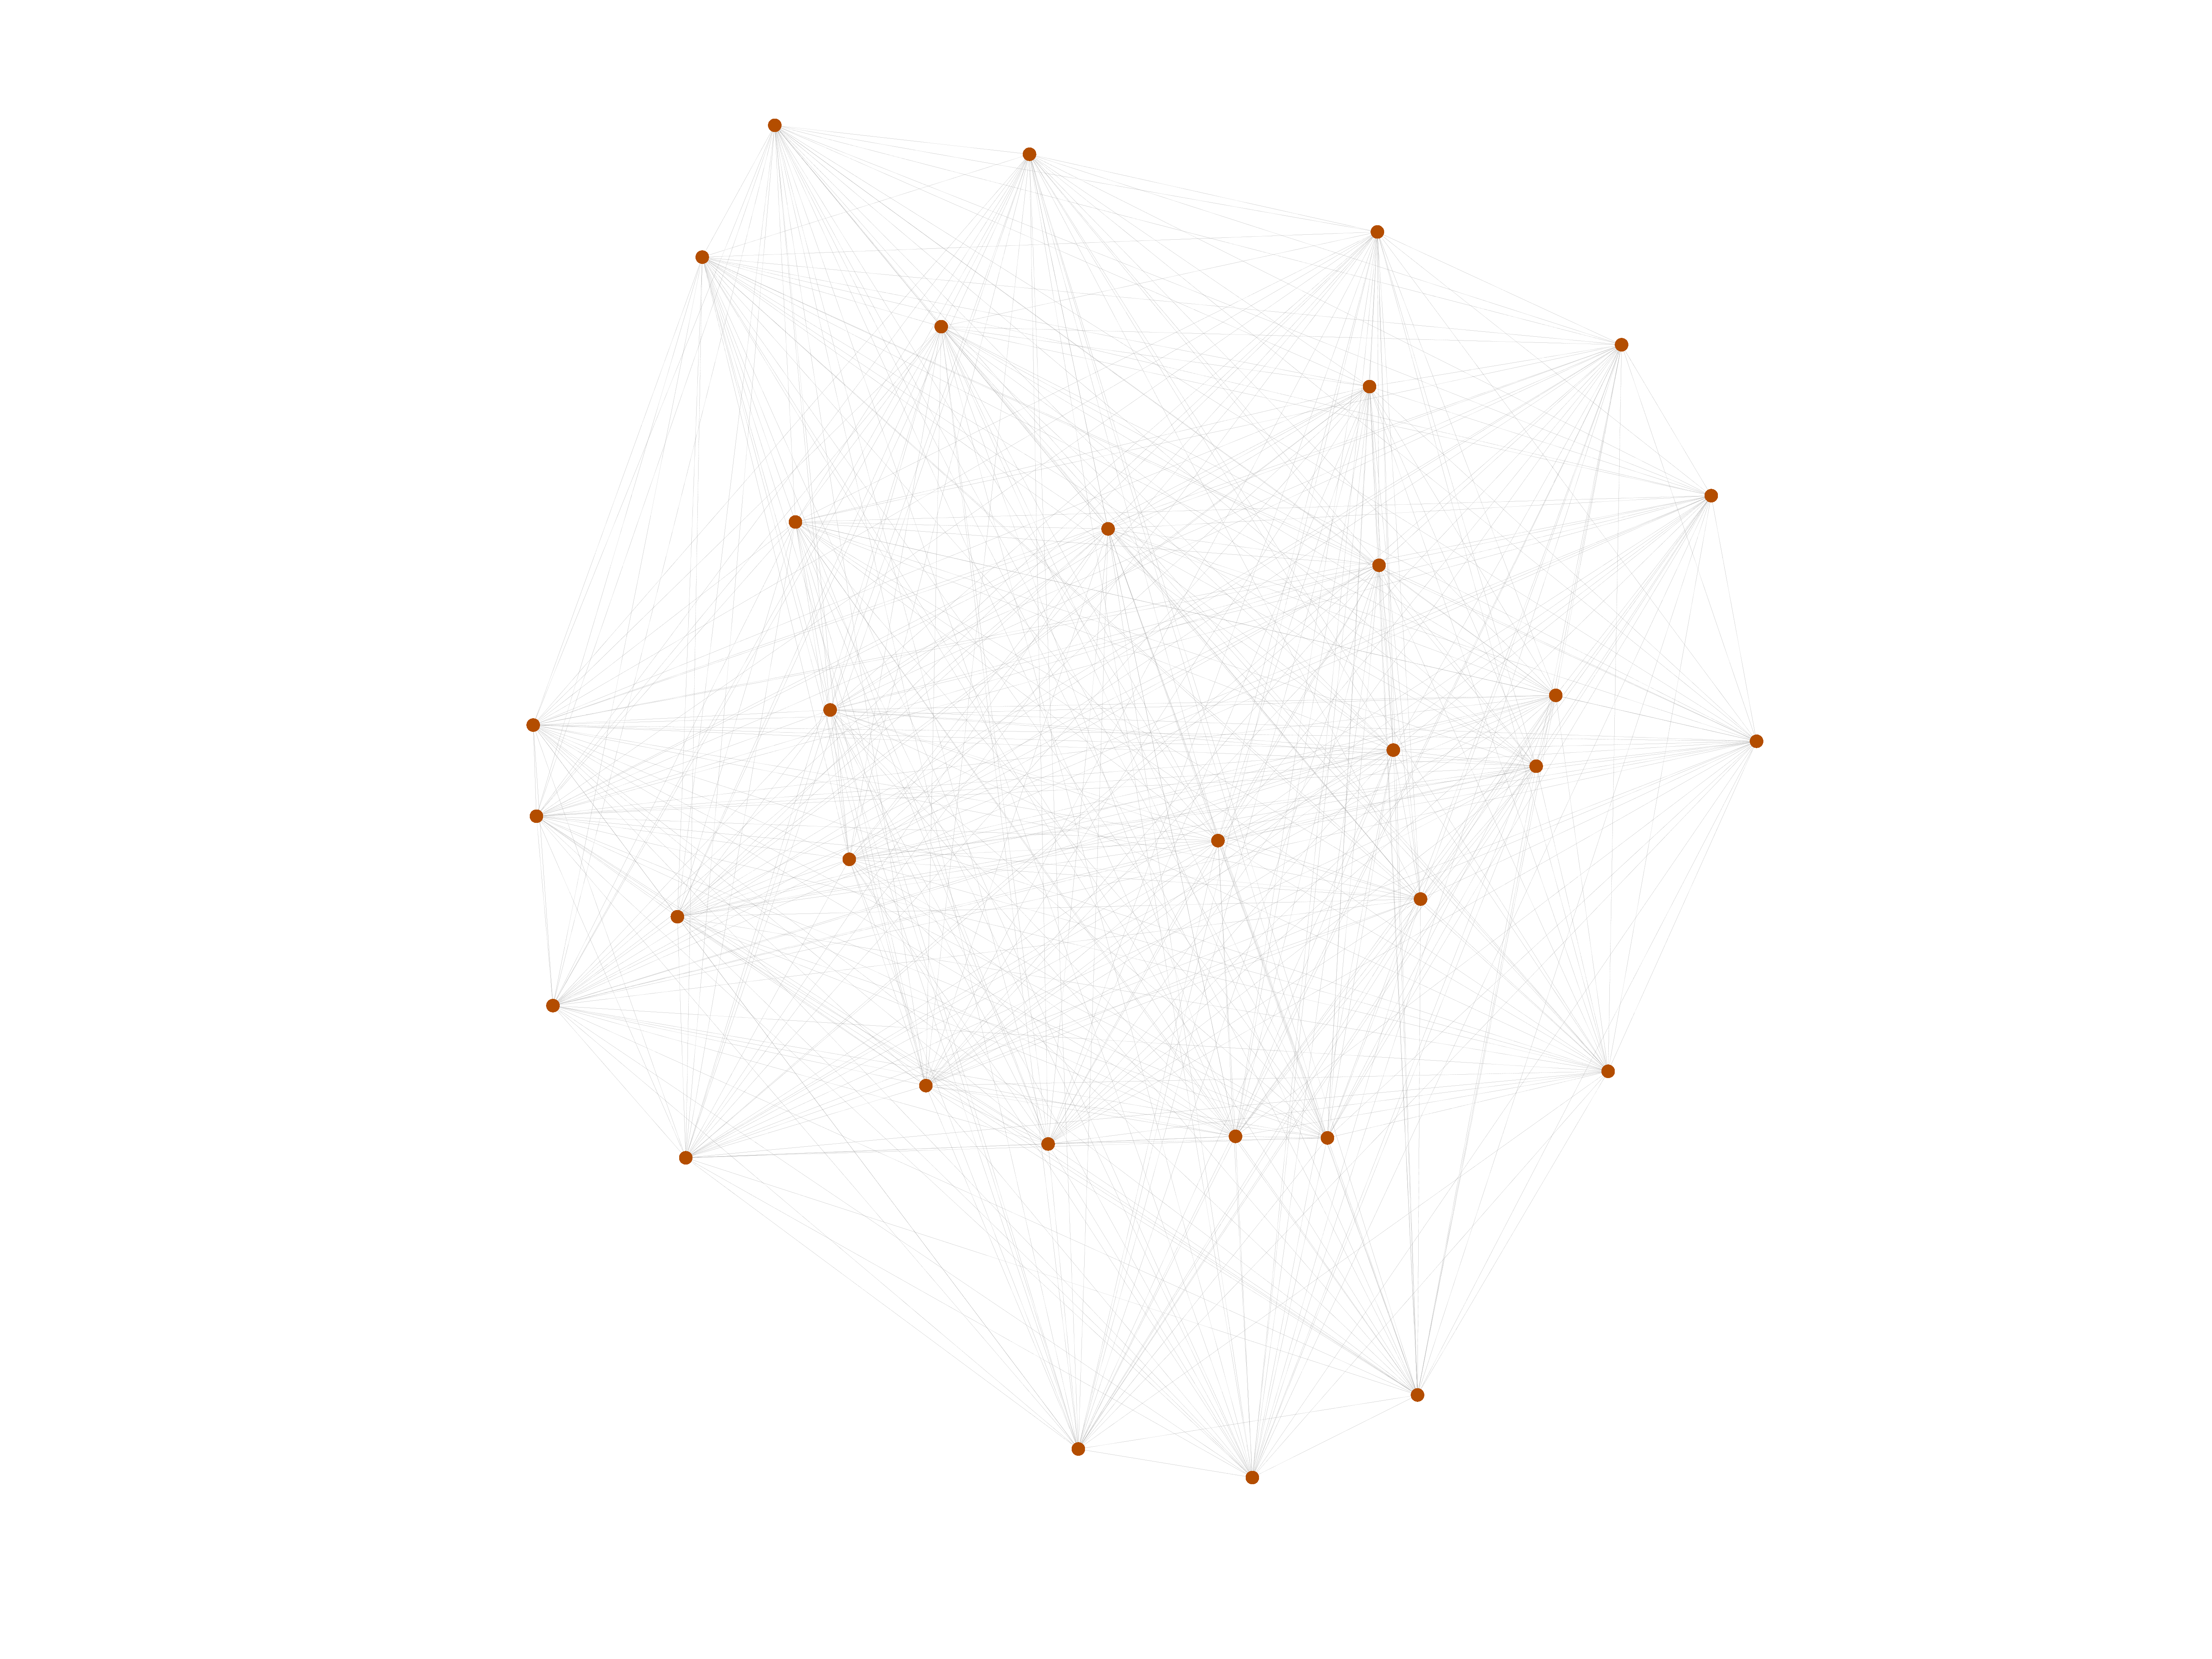
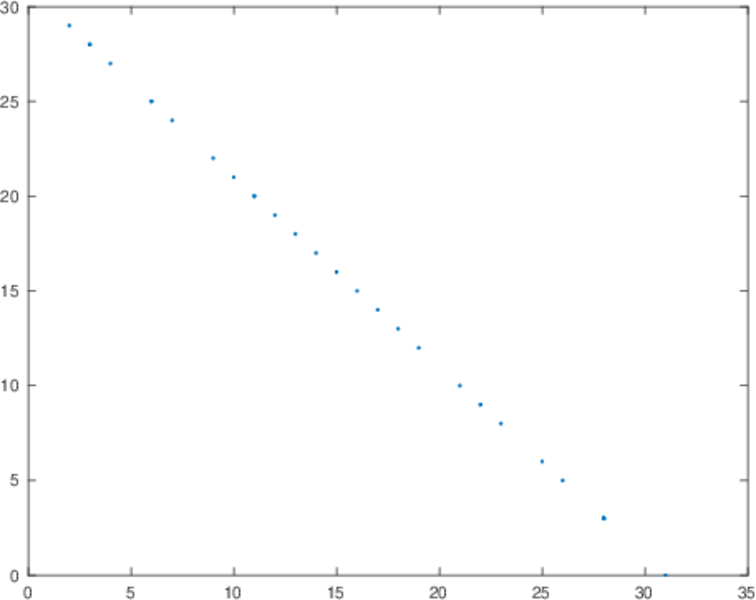
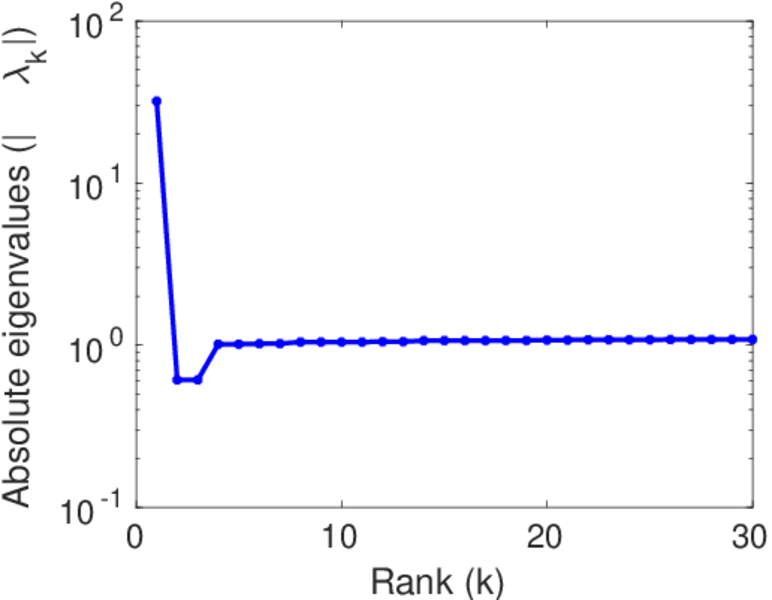
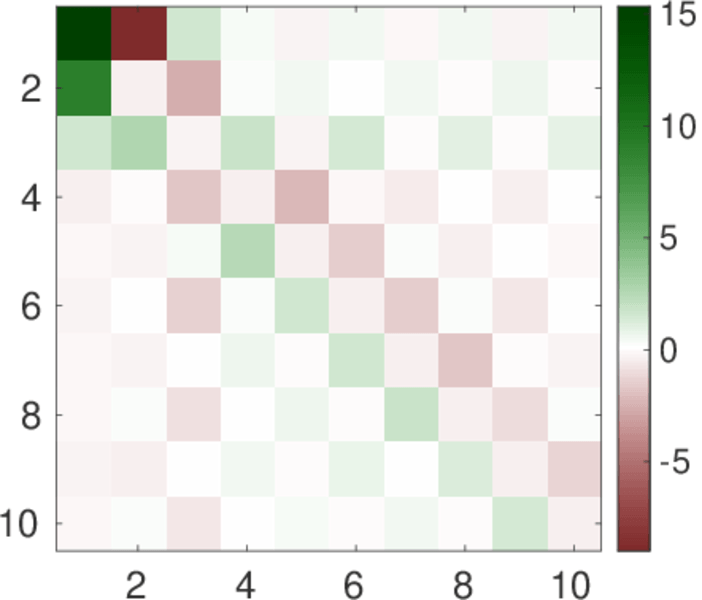
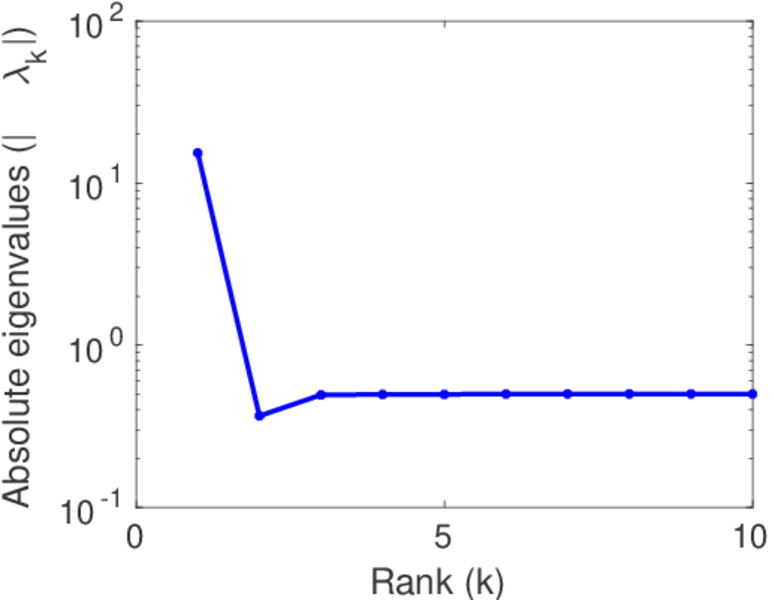
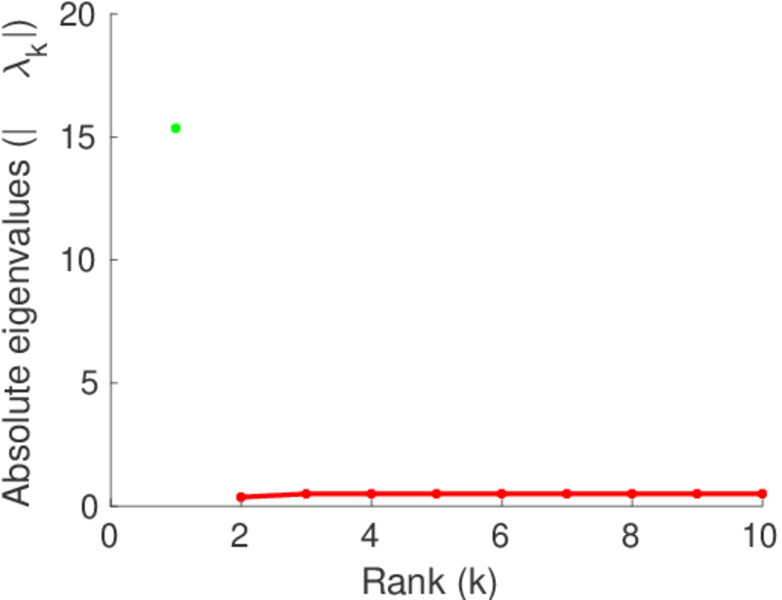
This directed network contains the peck order of 32 white Leghorn hens (Gallus gallus domesticus) observed in 1946. A node represents a hen and an edge represents dominance of the left hen over the right hen.
| Code | Mh
| |
| Internal name | moreno_hens
| |
| Name | Hens | |
| Data source | http://moreno.ss.uci.edu/data.html#hens | |
| Availability | Dataset is available for download | |
| Consistency check | Dataset passed all tests | |
| Category | Animal network | |
| Node meaning | Hen | |
| Edge meaning | Dominance | |
| Network format | Unipartite, directed | |
| Edge type | Unweighted, no multiple edges | |
| Reciprocal | Does not contain reciprocal edges | |
| Directed cycles | Contains directed cycles | |
| Loops | Does not contain loops | |
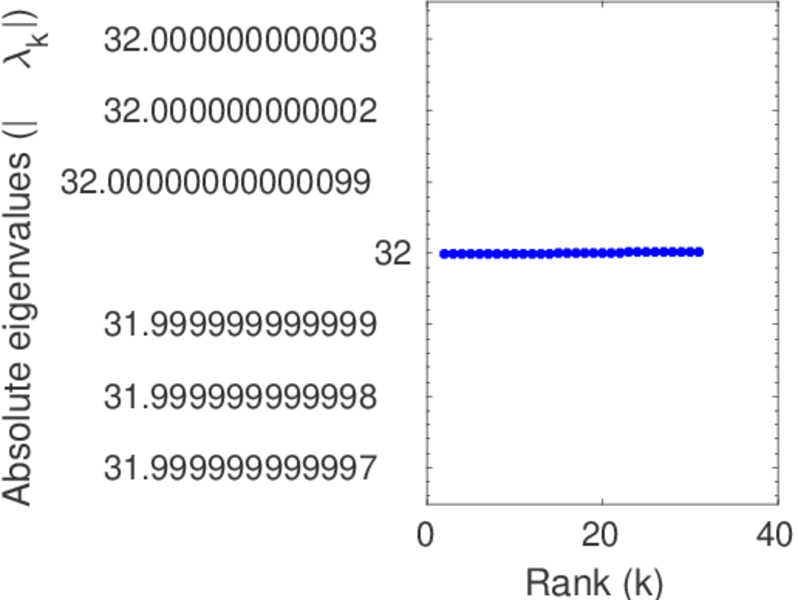
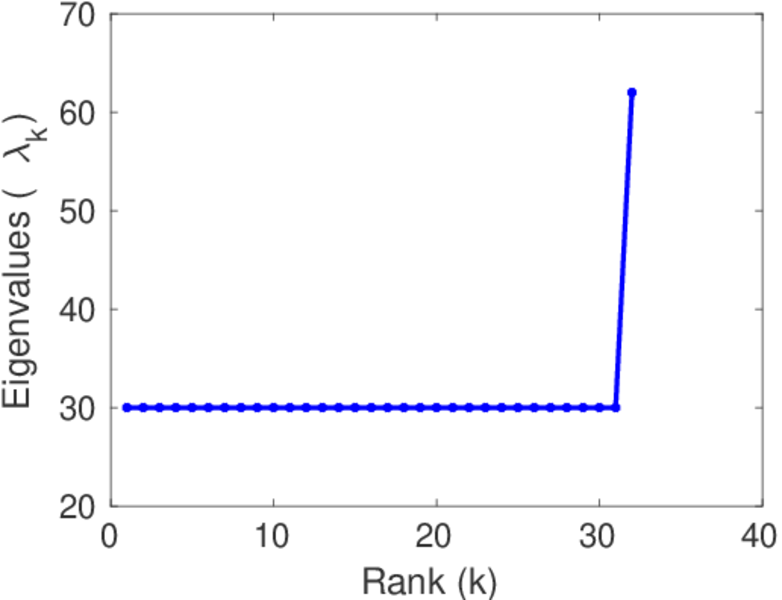
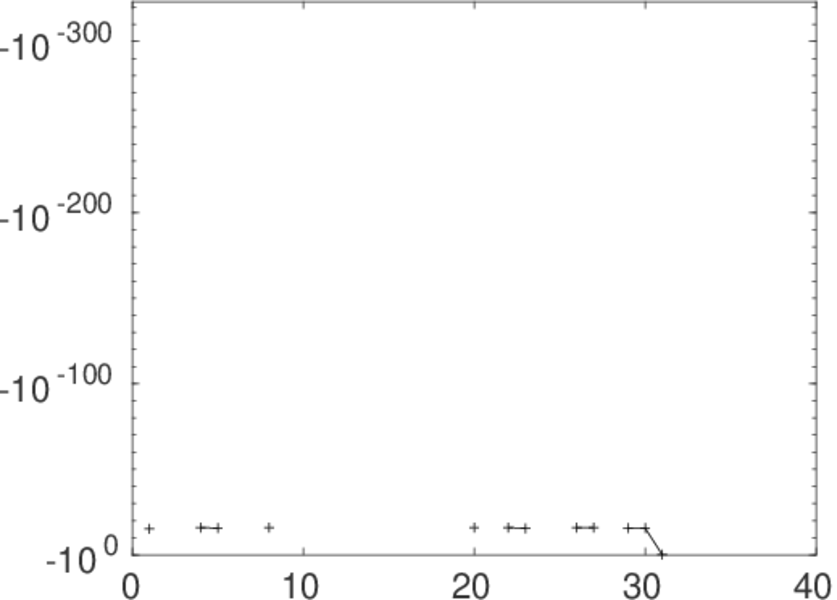
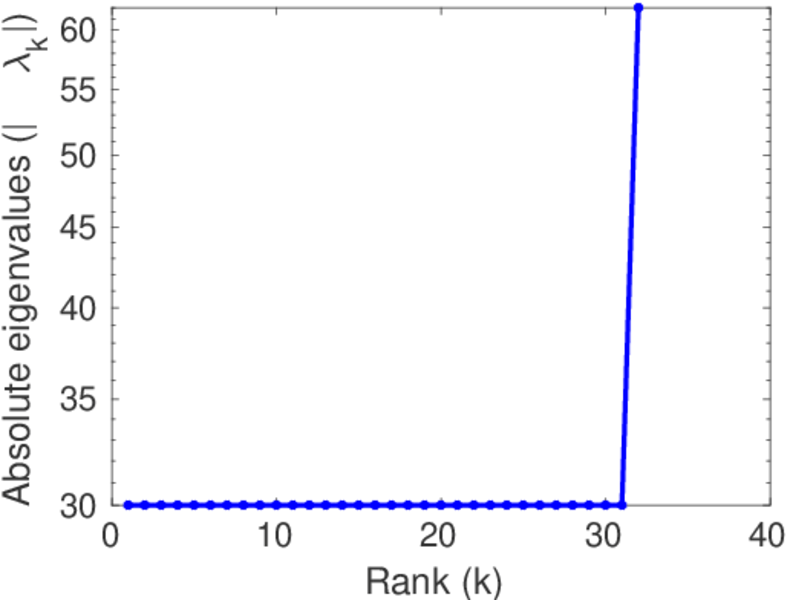
| Skew-symmetry | Inverted edges can be interpreted as negated edges | |
| Tournament | All pairs of nodes are connected by a directed edge |


| [1] | Jérôme Kunegis. KONECT – The Koblenz Network Collection. In Proc. Int. Conf. on World Wide Web Companion, pages 1343–1350, 2013. [ http ] |
| [2] | A. M. Guhl. Social behavior of the domestic fowl. Manhattan, Kansas: Kansas State Coll., Agricultural Experiment Station, Tech. Bull. 73, 1953. |