Highschool

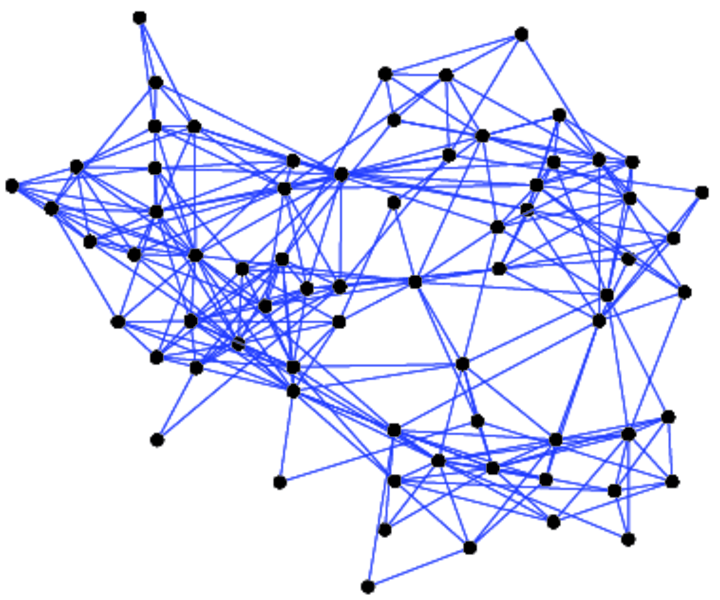
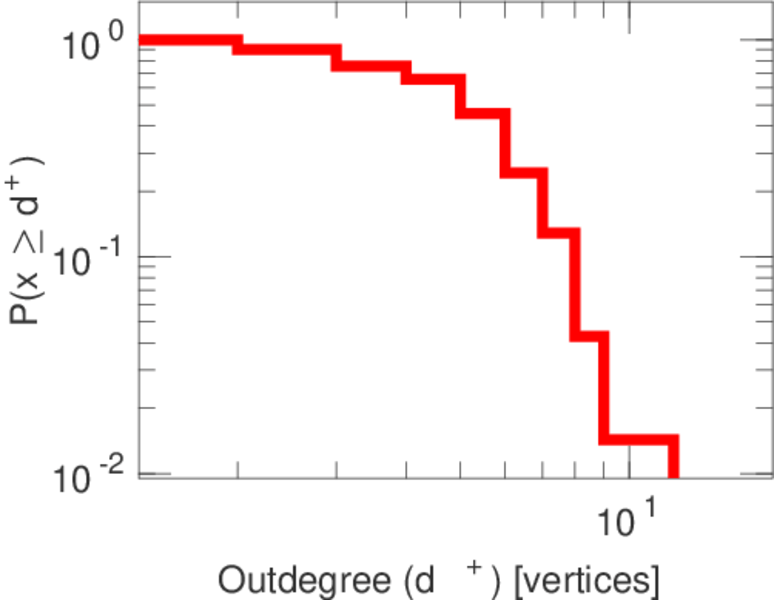
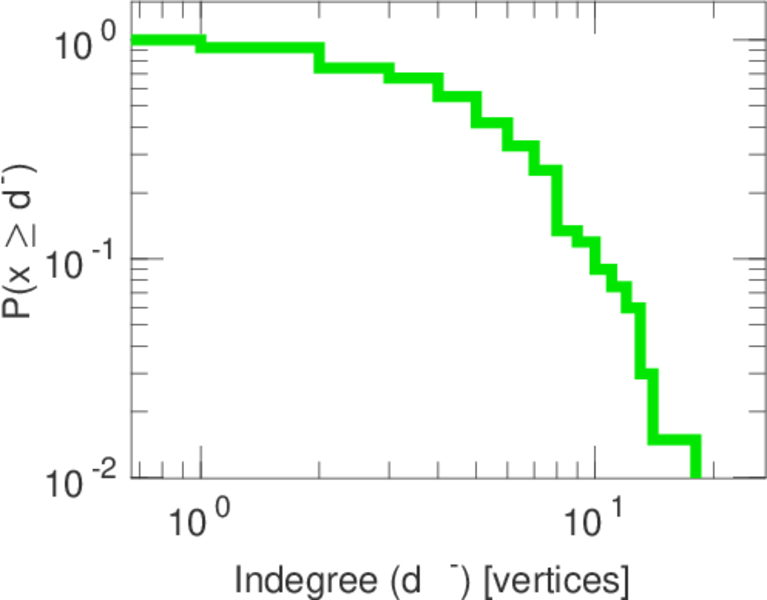
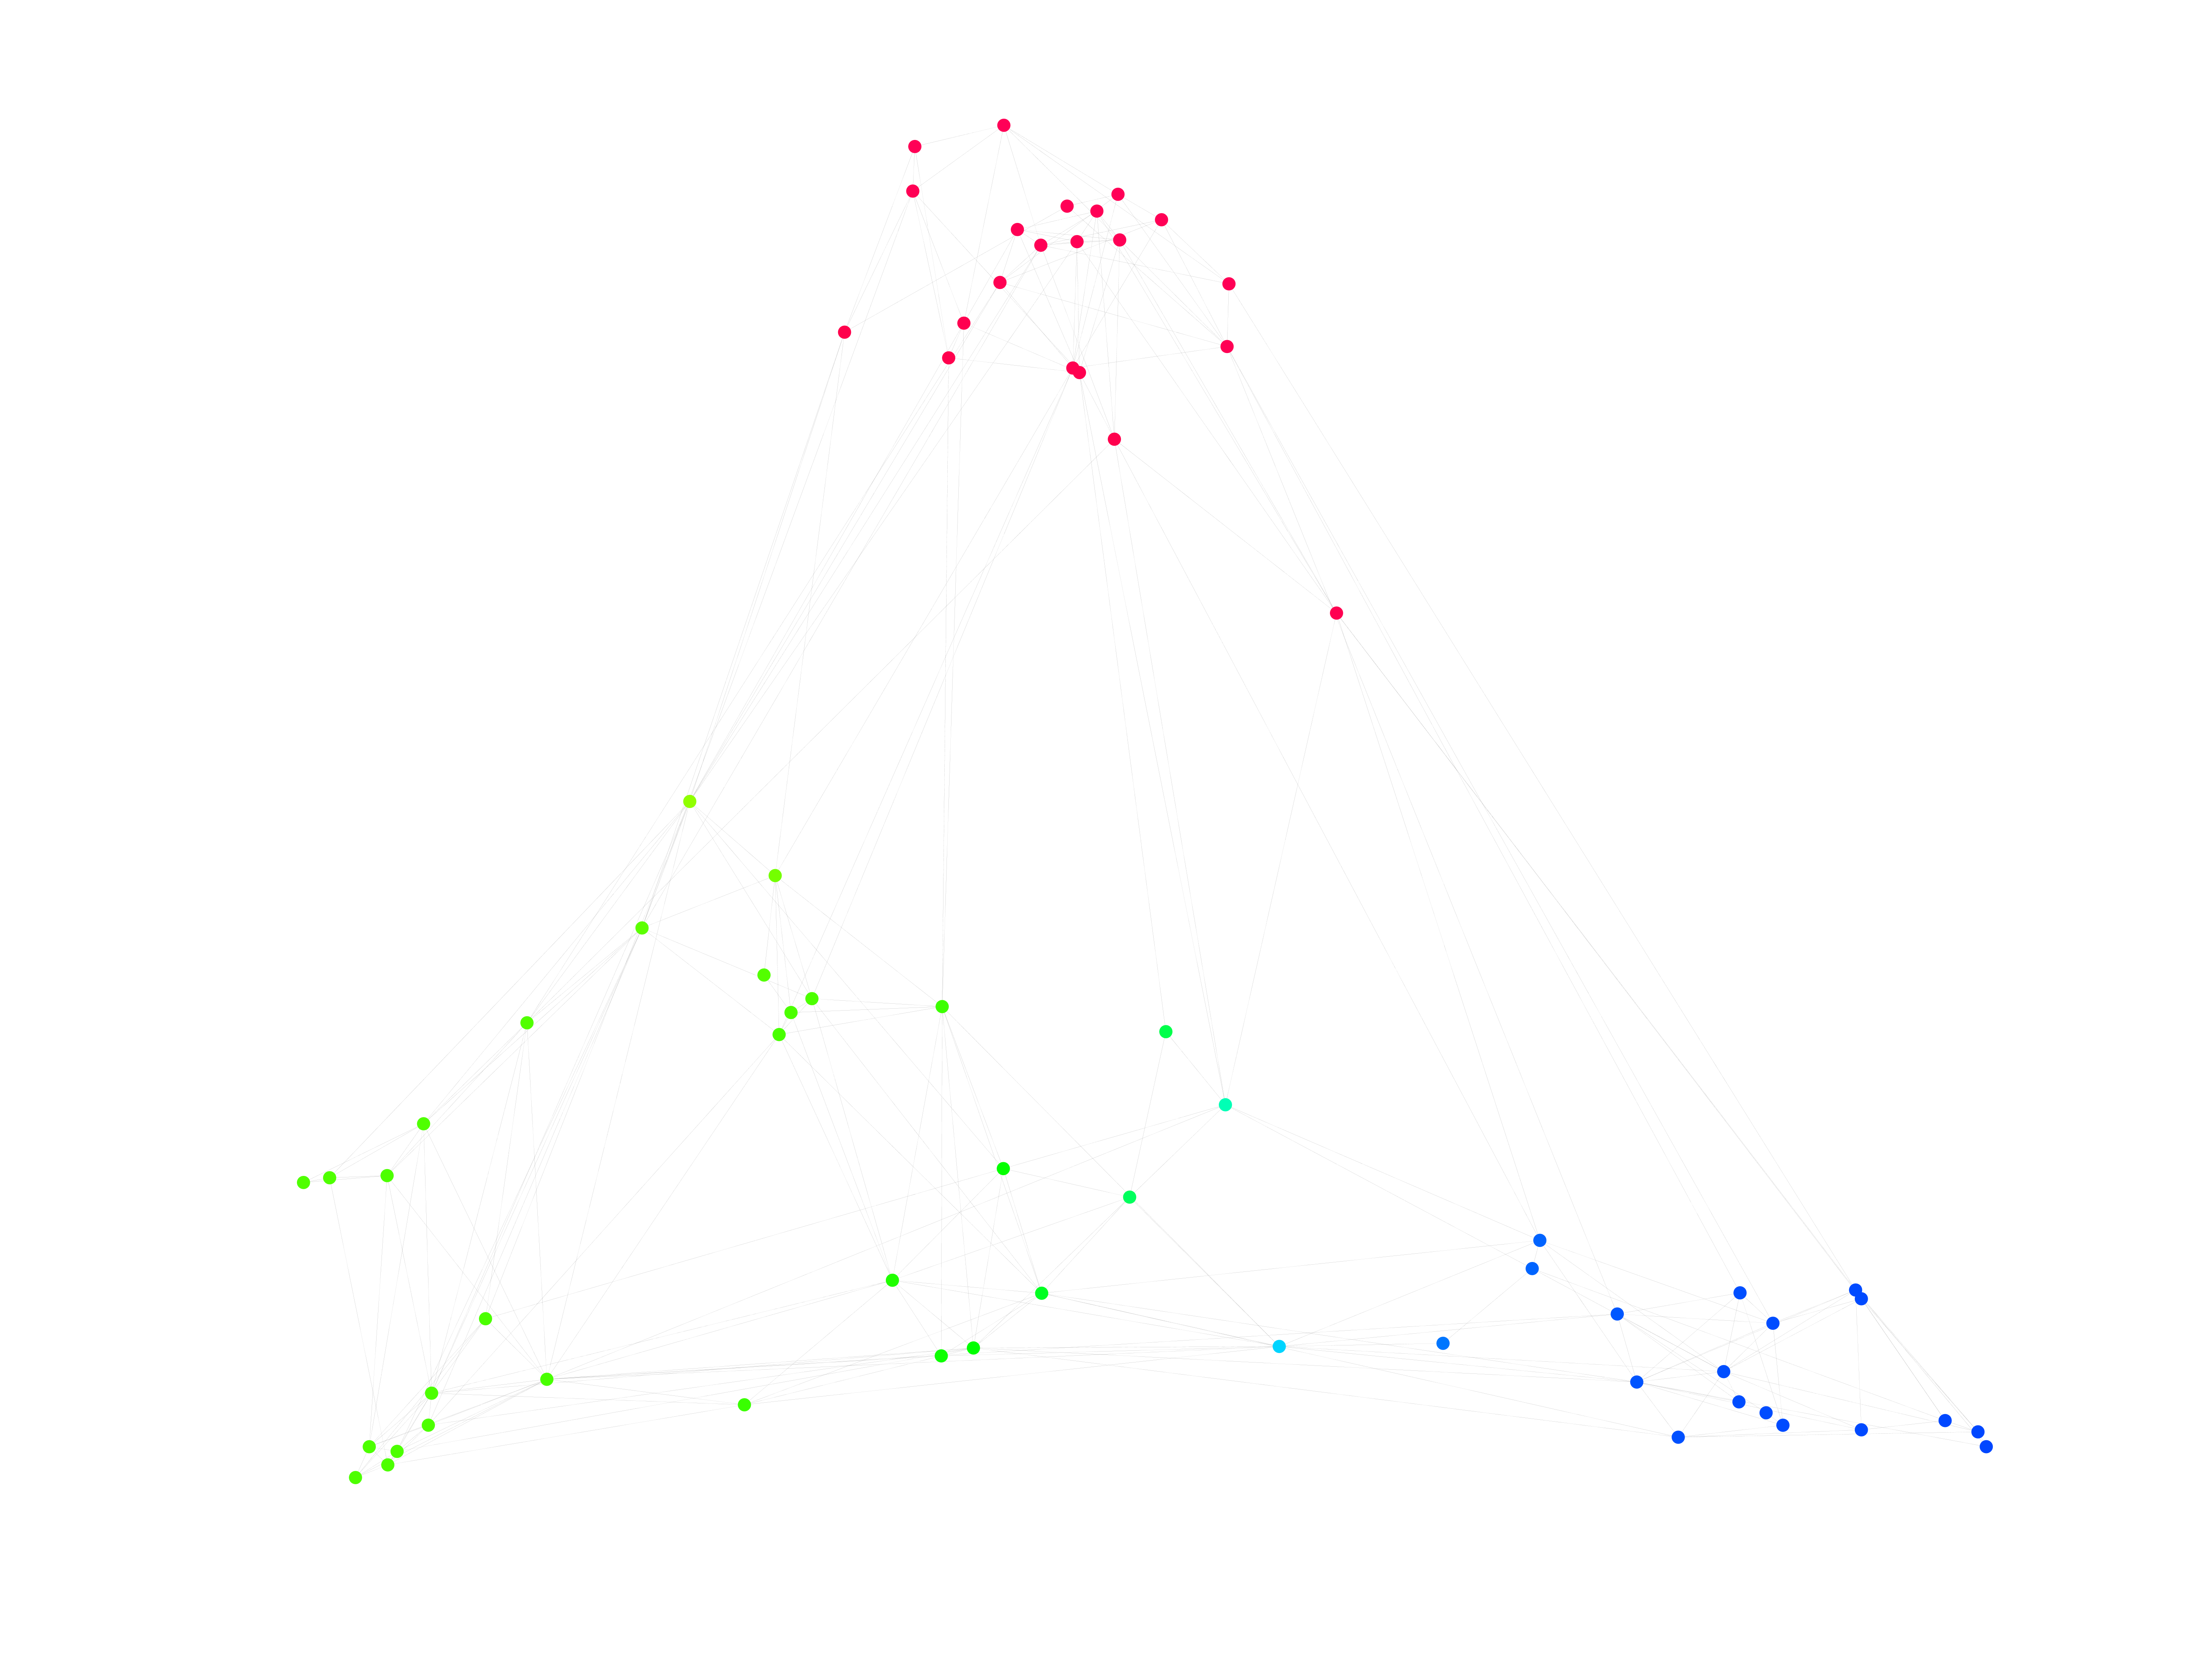
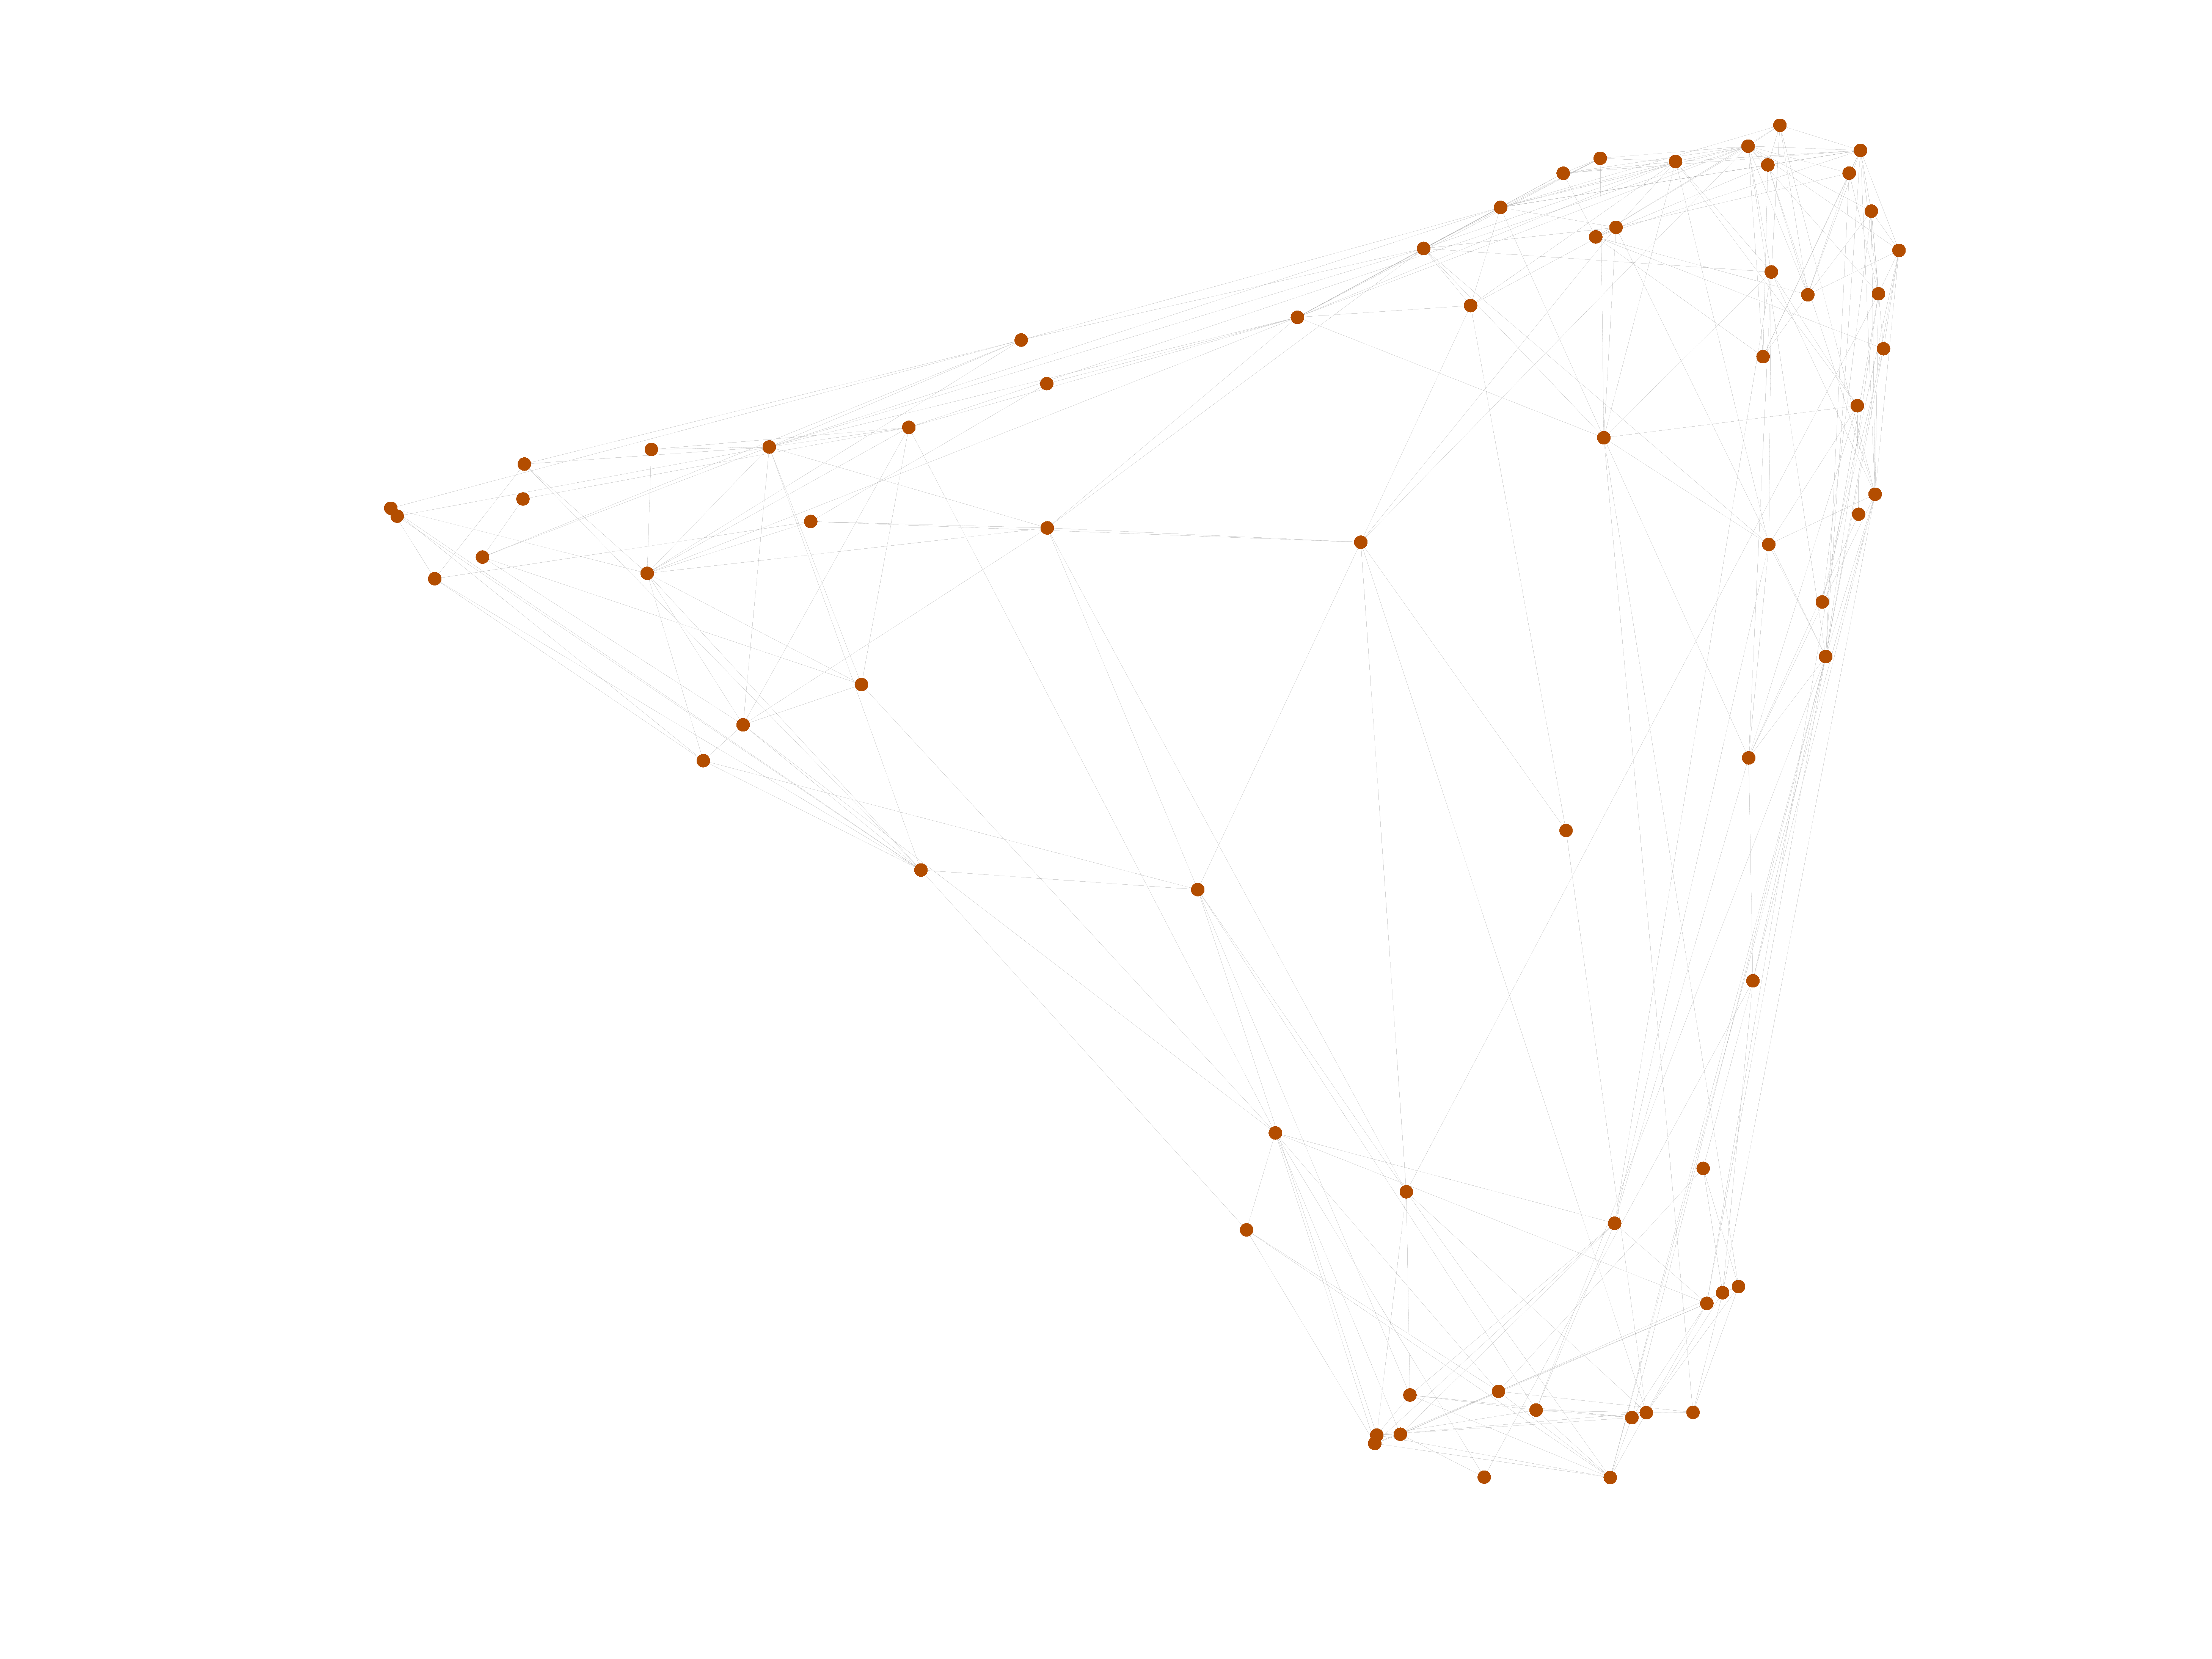
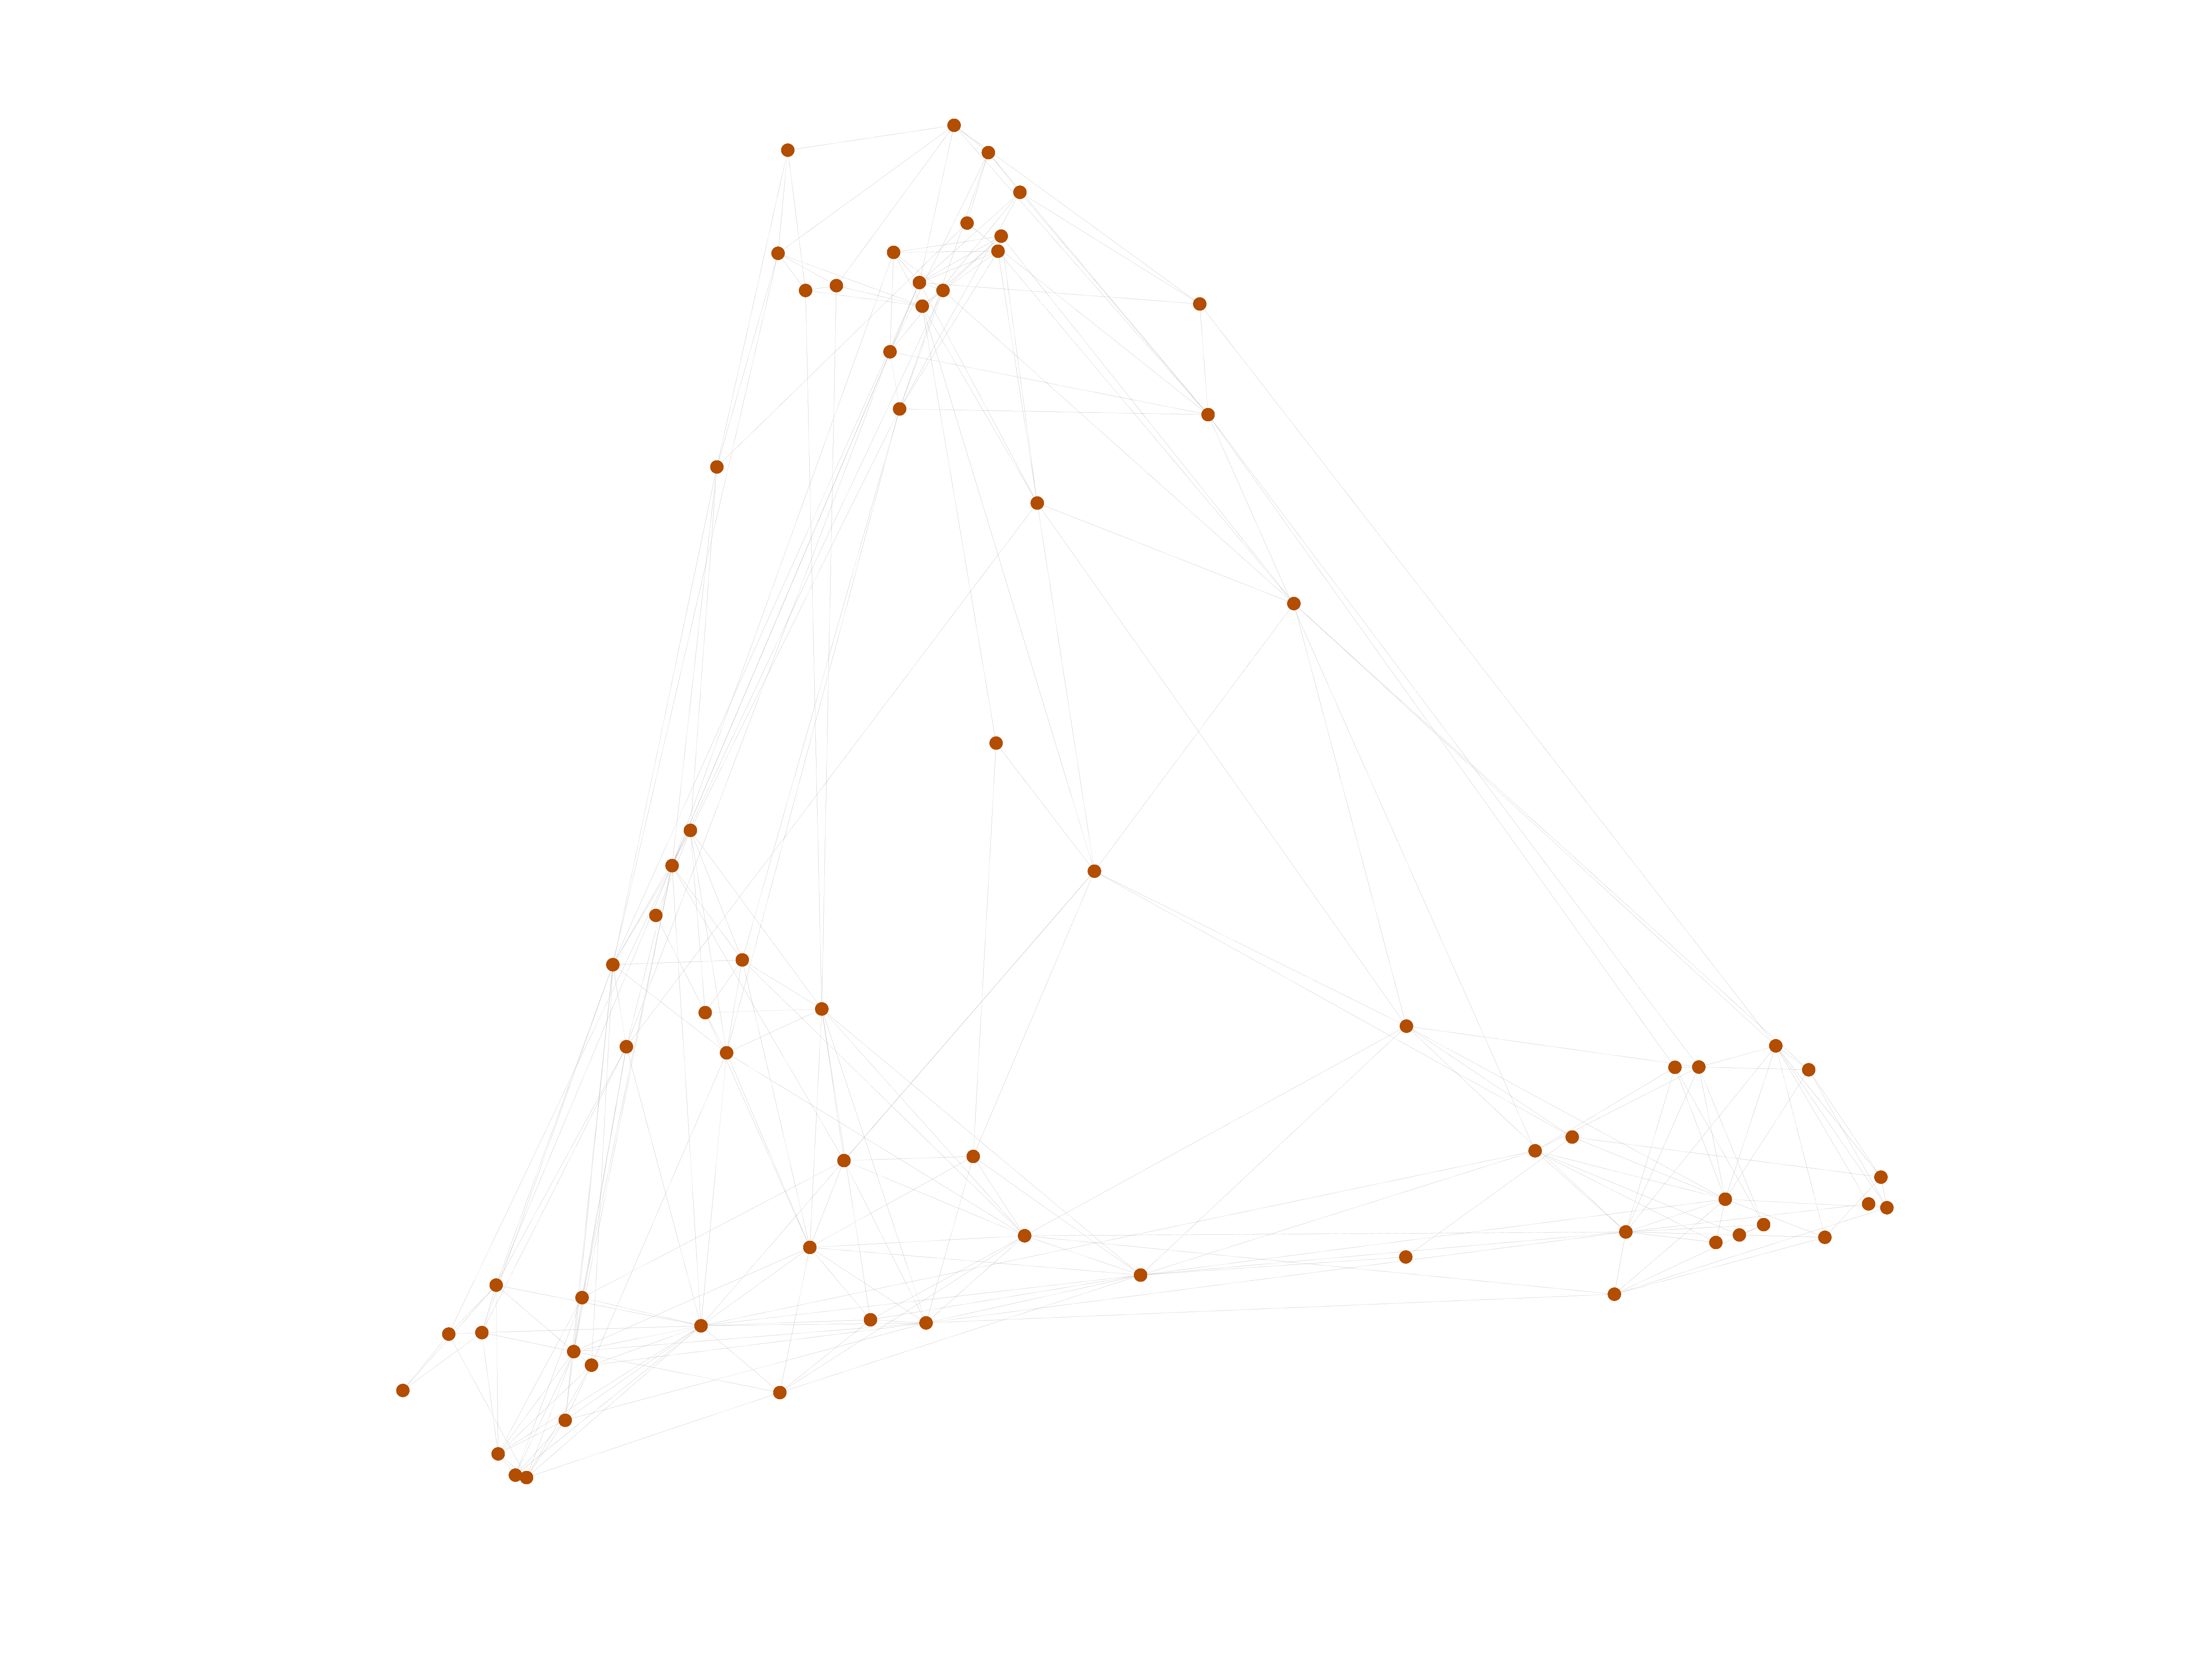
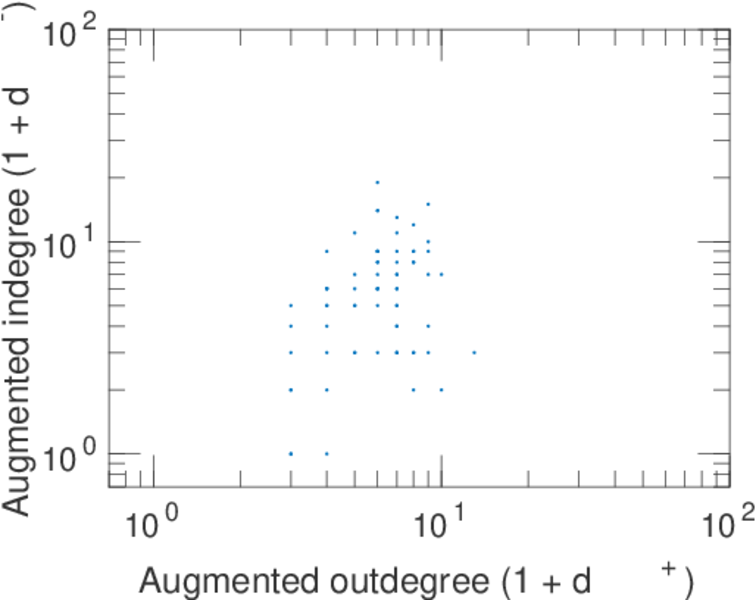
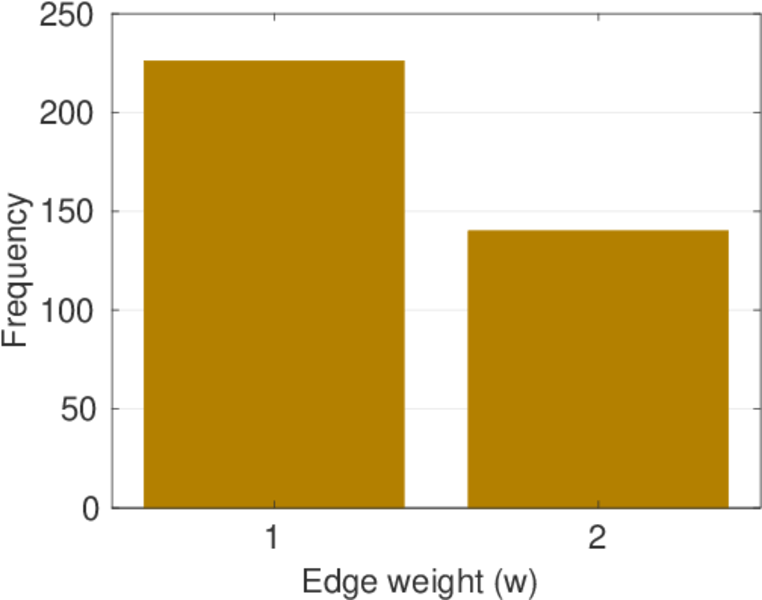
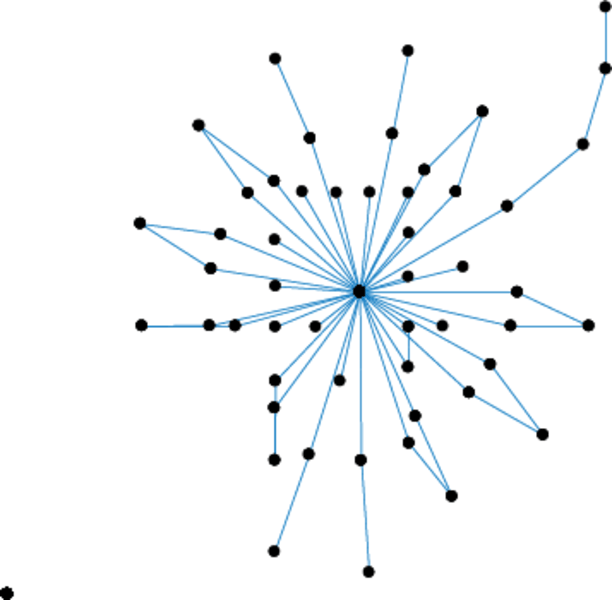
This directed network contains friendships between boys in a small highschool in Illinois. Each boy was asked once in the fall of 1957 and the spring of 1958. This dataset aggregates the results from both dates. A node represents a boy and an edge between two boys shows that the left boy chose the right boy as a friend. The edge weights show how often that happened. As a boy could choose the same boy twice edge values from 1 to 2 are allowed.

Metadata

CodeMH
Internal namemoreno_highschool
NameHighschool
Data sourcehttp://moreno.ss.uci.edu/data.html#high
AvailabilityDataset is available for download
Consistency checkDataset passed all tests
Category
Human social network
Node meaningBoy
Edge meaningFriendship
Network formatUnipartite, directed
Edge typePositive weights, no multiple edges
ReciprocalContains reciprocal edges
Directed cyclesContains directed cycles
LoopsDoes not contain loops

Statistics

Size n =70
Volume m =366
Loop count l =0
Wedge count s =2,278
Claw count z =16,957
Cross count x =54,264
Triangle count t =307
Square count q =1,277
4-Tour count T4 =19,876
Maximum degree dmax =23
Maximum outdegree d+max =12
Maximum indegree dmax =18
Average degree d =10.457 1
Fill p =0.075 776 4
Size of LCC N =70
Size of LSCC Ns =67
Relative size of LSCC Nrs =0.957 143
Diameter δ =6
50-Percentile effective diameter δ0.5 =2.225 35
90-Percentile effective diameter δ0.9 =3.510 02
Median distance δM =3
Mean distance δm =2.664 11
Gini coefficient G =0.242 350
Balanced inequality ratio P =0.400 273
Outdegree balanced inequality ratio P+ =0.420 765
Indegree balanced inequality ratio P =0.363 388
Relative edge distribution entropy Her =0.977 083
Power law exponent γ =1.793 91
Tail power law exponent γt =4.381 00
Tail power law exponent with p γ3 =4.381 00
p-value p =0.048 000 0
Outdegree tail power law exponent with p γ3,o =5.701 00
Outdegree p-value po =0.233 000
Indegree tail power law exponent with p γ3,i =4.681 00
Indegree p-value pi =0.194 000
Degree assortativity ρ =+0.082 957 7
Degree assortativity p-value pρ =0.052 270 1
In/outdegree correlation ρ± =+0.360 804
Clustering coefficient c =0.404 302
Directed clustering coefficient c± =0.403 252
Spectral norm α =20.698 1
Operator 2-norm ν =10.977 2
Cyclic eigenvalue π =9.584 62
Algebraic connectivity a =1.067 34
Spectral separation 1[A] / λ2[A]| =1.233 15
Reciprocity y =0.502 732
Non-bipartivity bA =0.605 910
Normalized non-bipartivity bN =0.451 279
Algebraic non-bipartivity χ =1.466 37
Spectral bipartite frustration bK =0.046 827 6
Controllability C =4
Relative controllability Cr =0.057 142 9

Plots

Fruchterman–Reingold graph drawing

Degree distribution

Cumulative degree distribution

Lorenz curve

Spectral distribution of the adjacency matrix

Spectral distribution of the normalized adjacency matrix

Spectral distribution of the Laplacian

Spectral graph drawing based on the adjacency matrix

Spectral graph drawing based on the Laplacian

Spectral graph drawing based on the normalized adjacency matrix

Degree assortativity

Zipf plot

Hop distribution

Double Laplacian graph drawing

Delaunay graph drawing

In/outdegree scatter plot

Edge weight/multiplicity distribution

Clustering coefficient distribution

Average neighbor degree distribution

SynGraphy

Matrix decompositions plots

Downloads

References

[1] Jérôme Kunegis. KONECT – The Koblenz Network Collection. In Proc. Int. Conf. on World Wide Web Companion, pages 1343–1350, 2013. [ http ]
[2] James Samuel Coleman. Introduction to mathematical sociology. London Free Press Glencoe, 1964.