Physicians

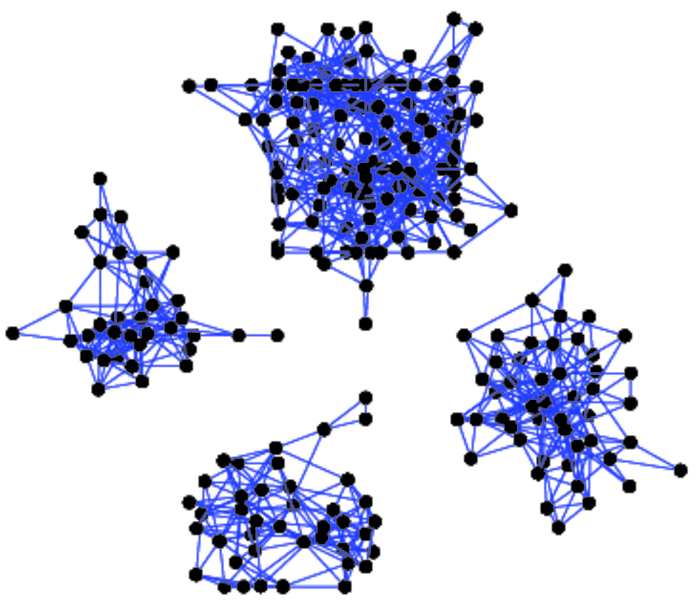
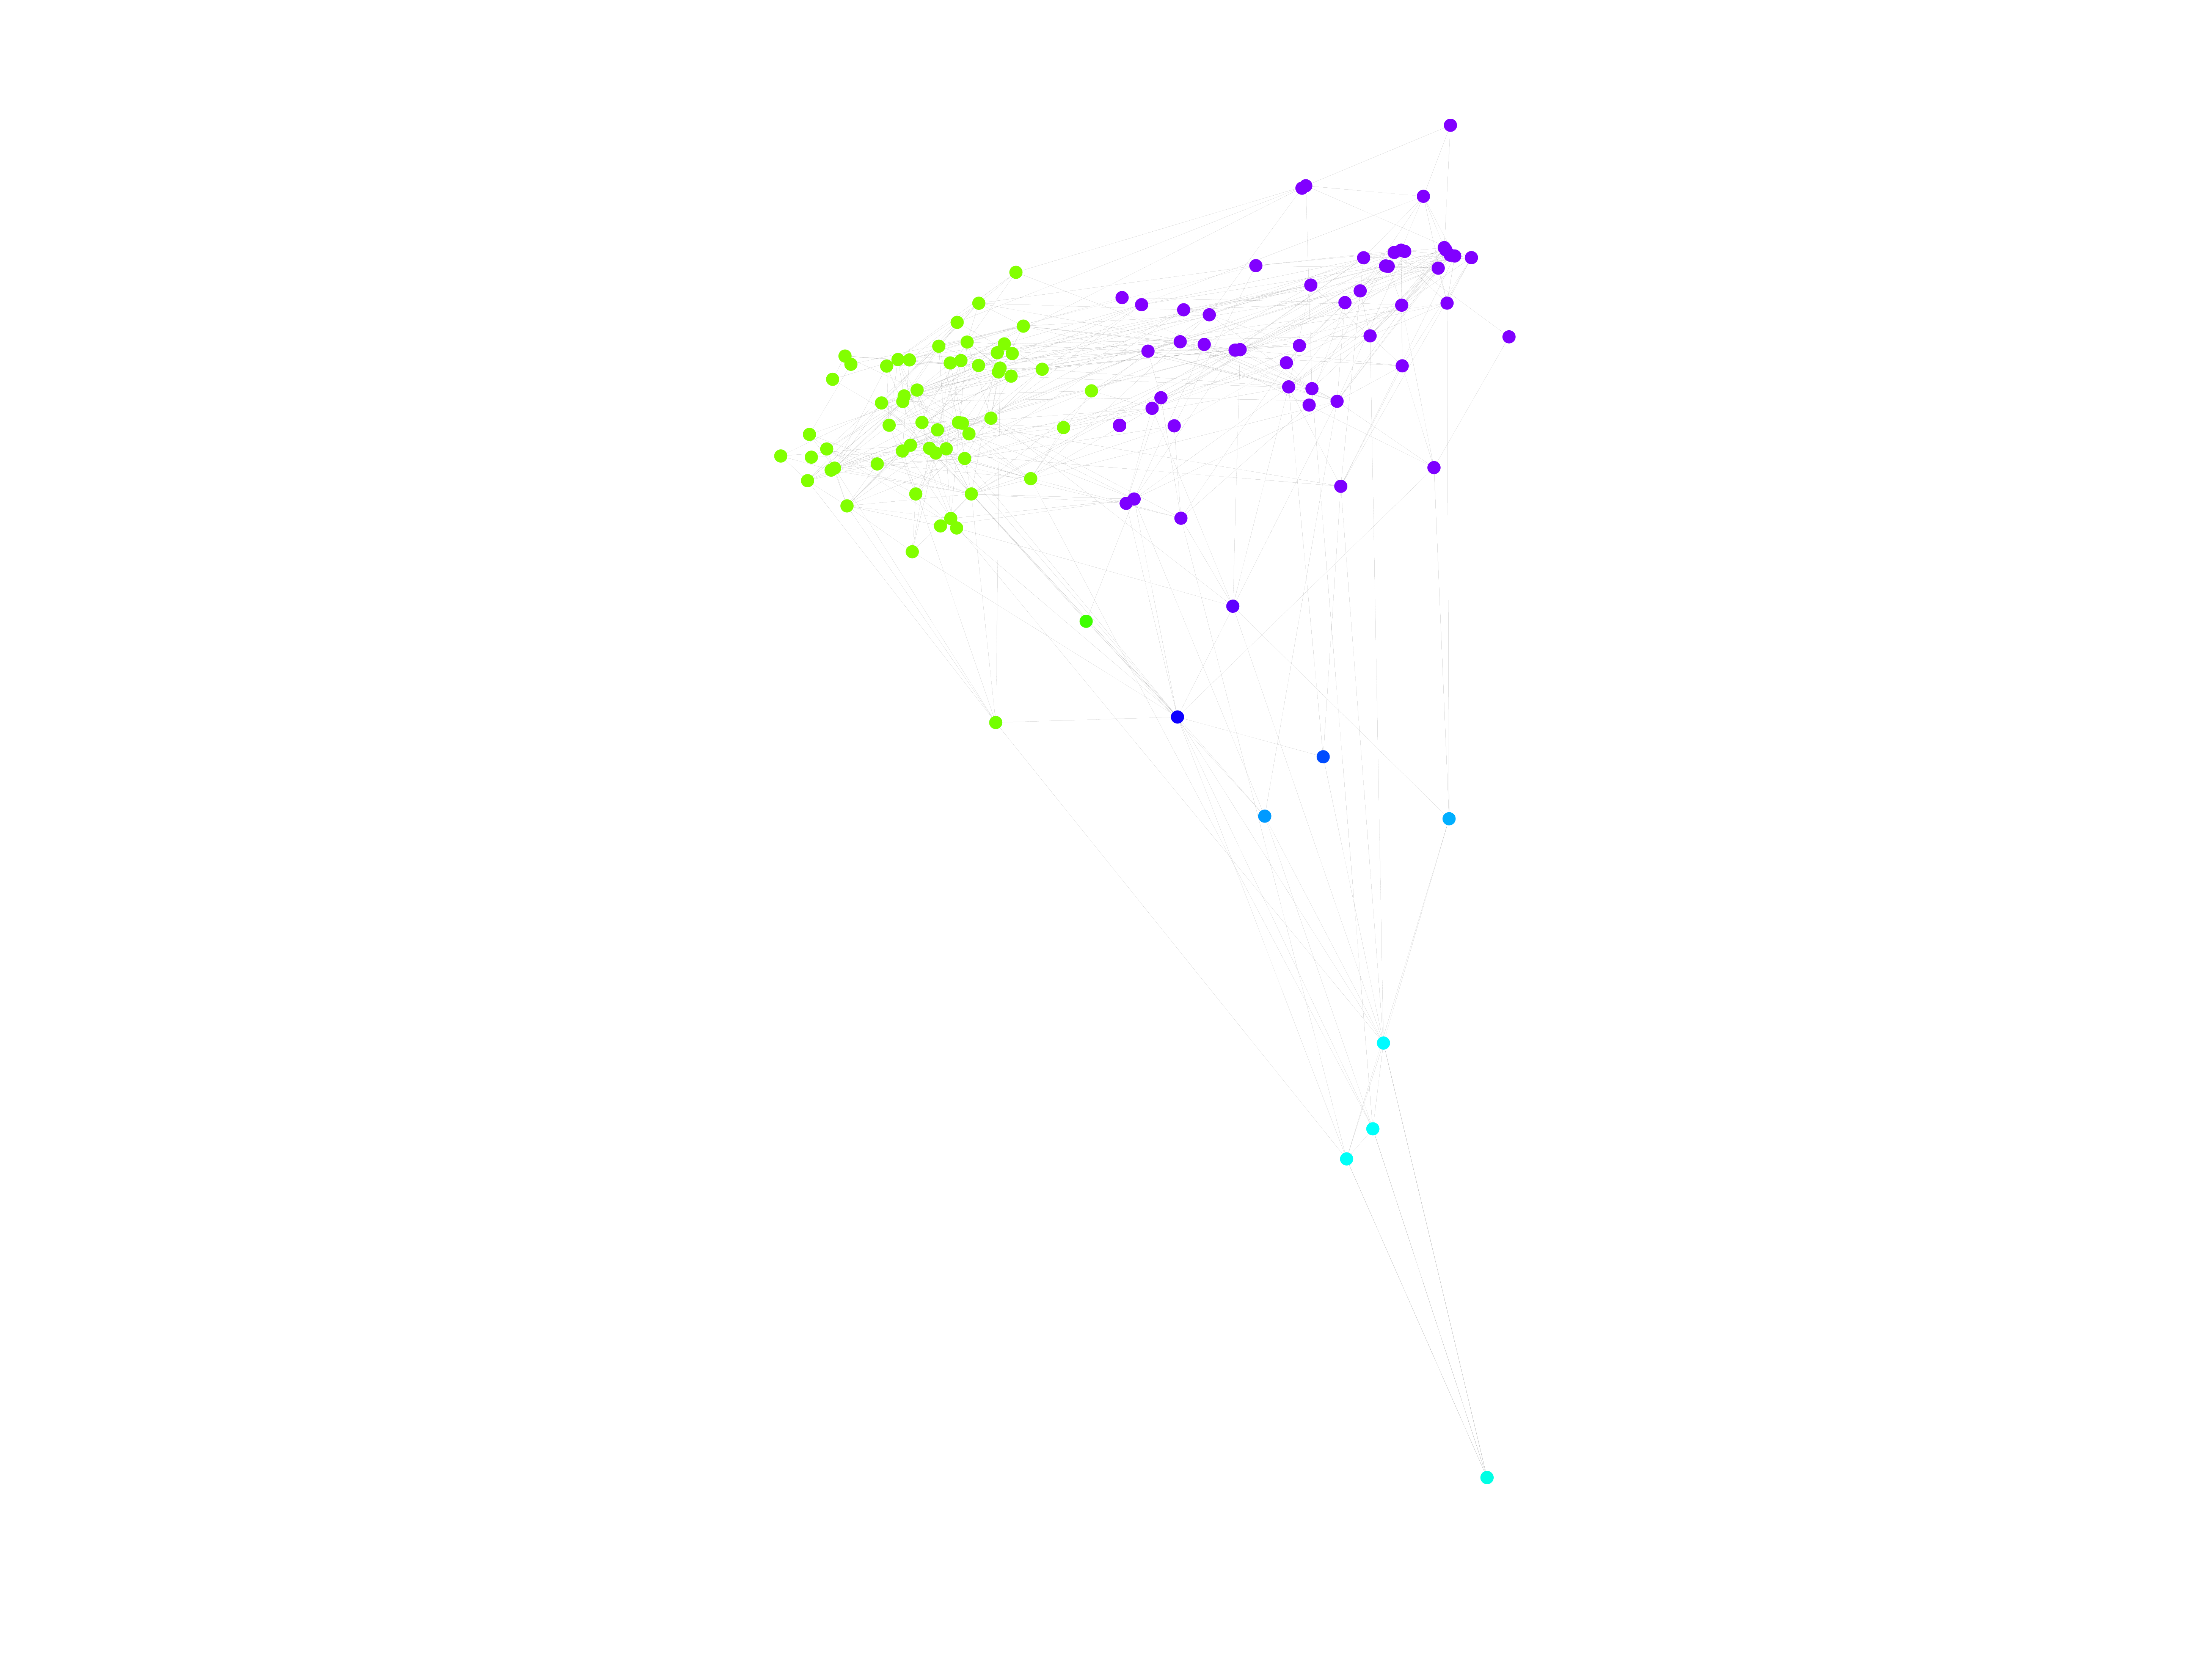
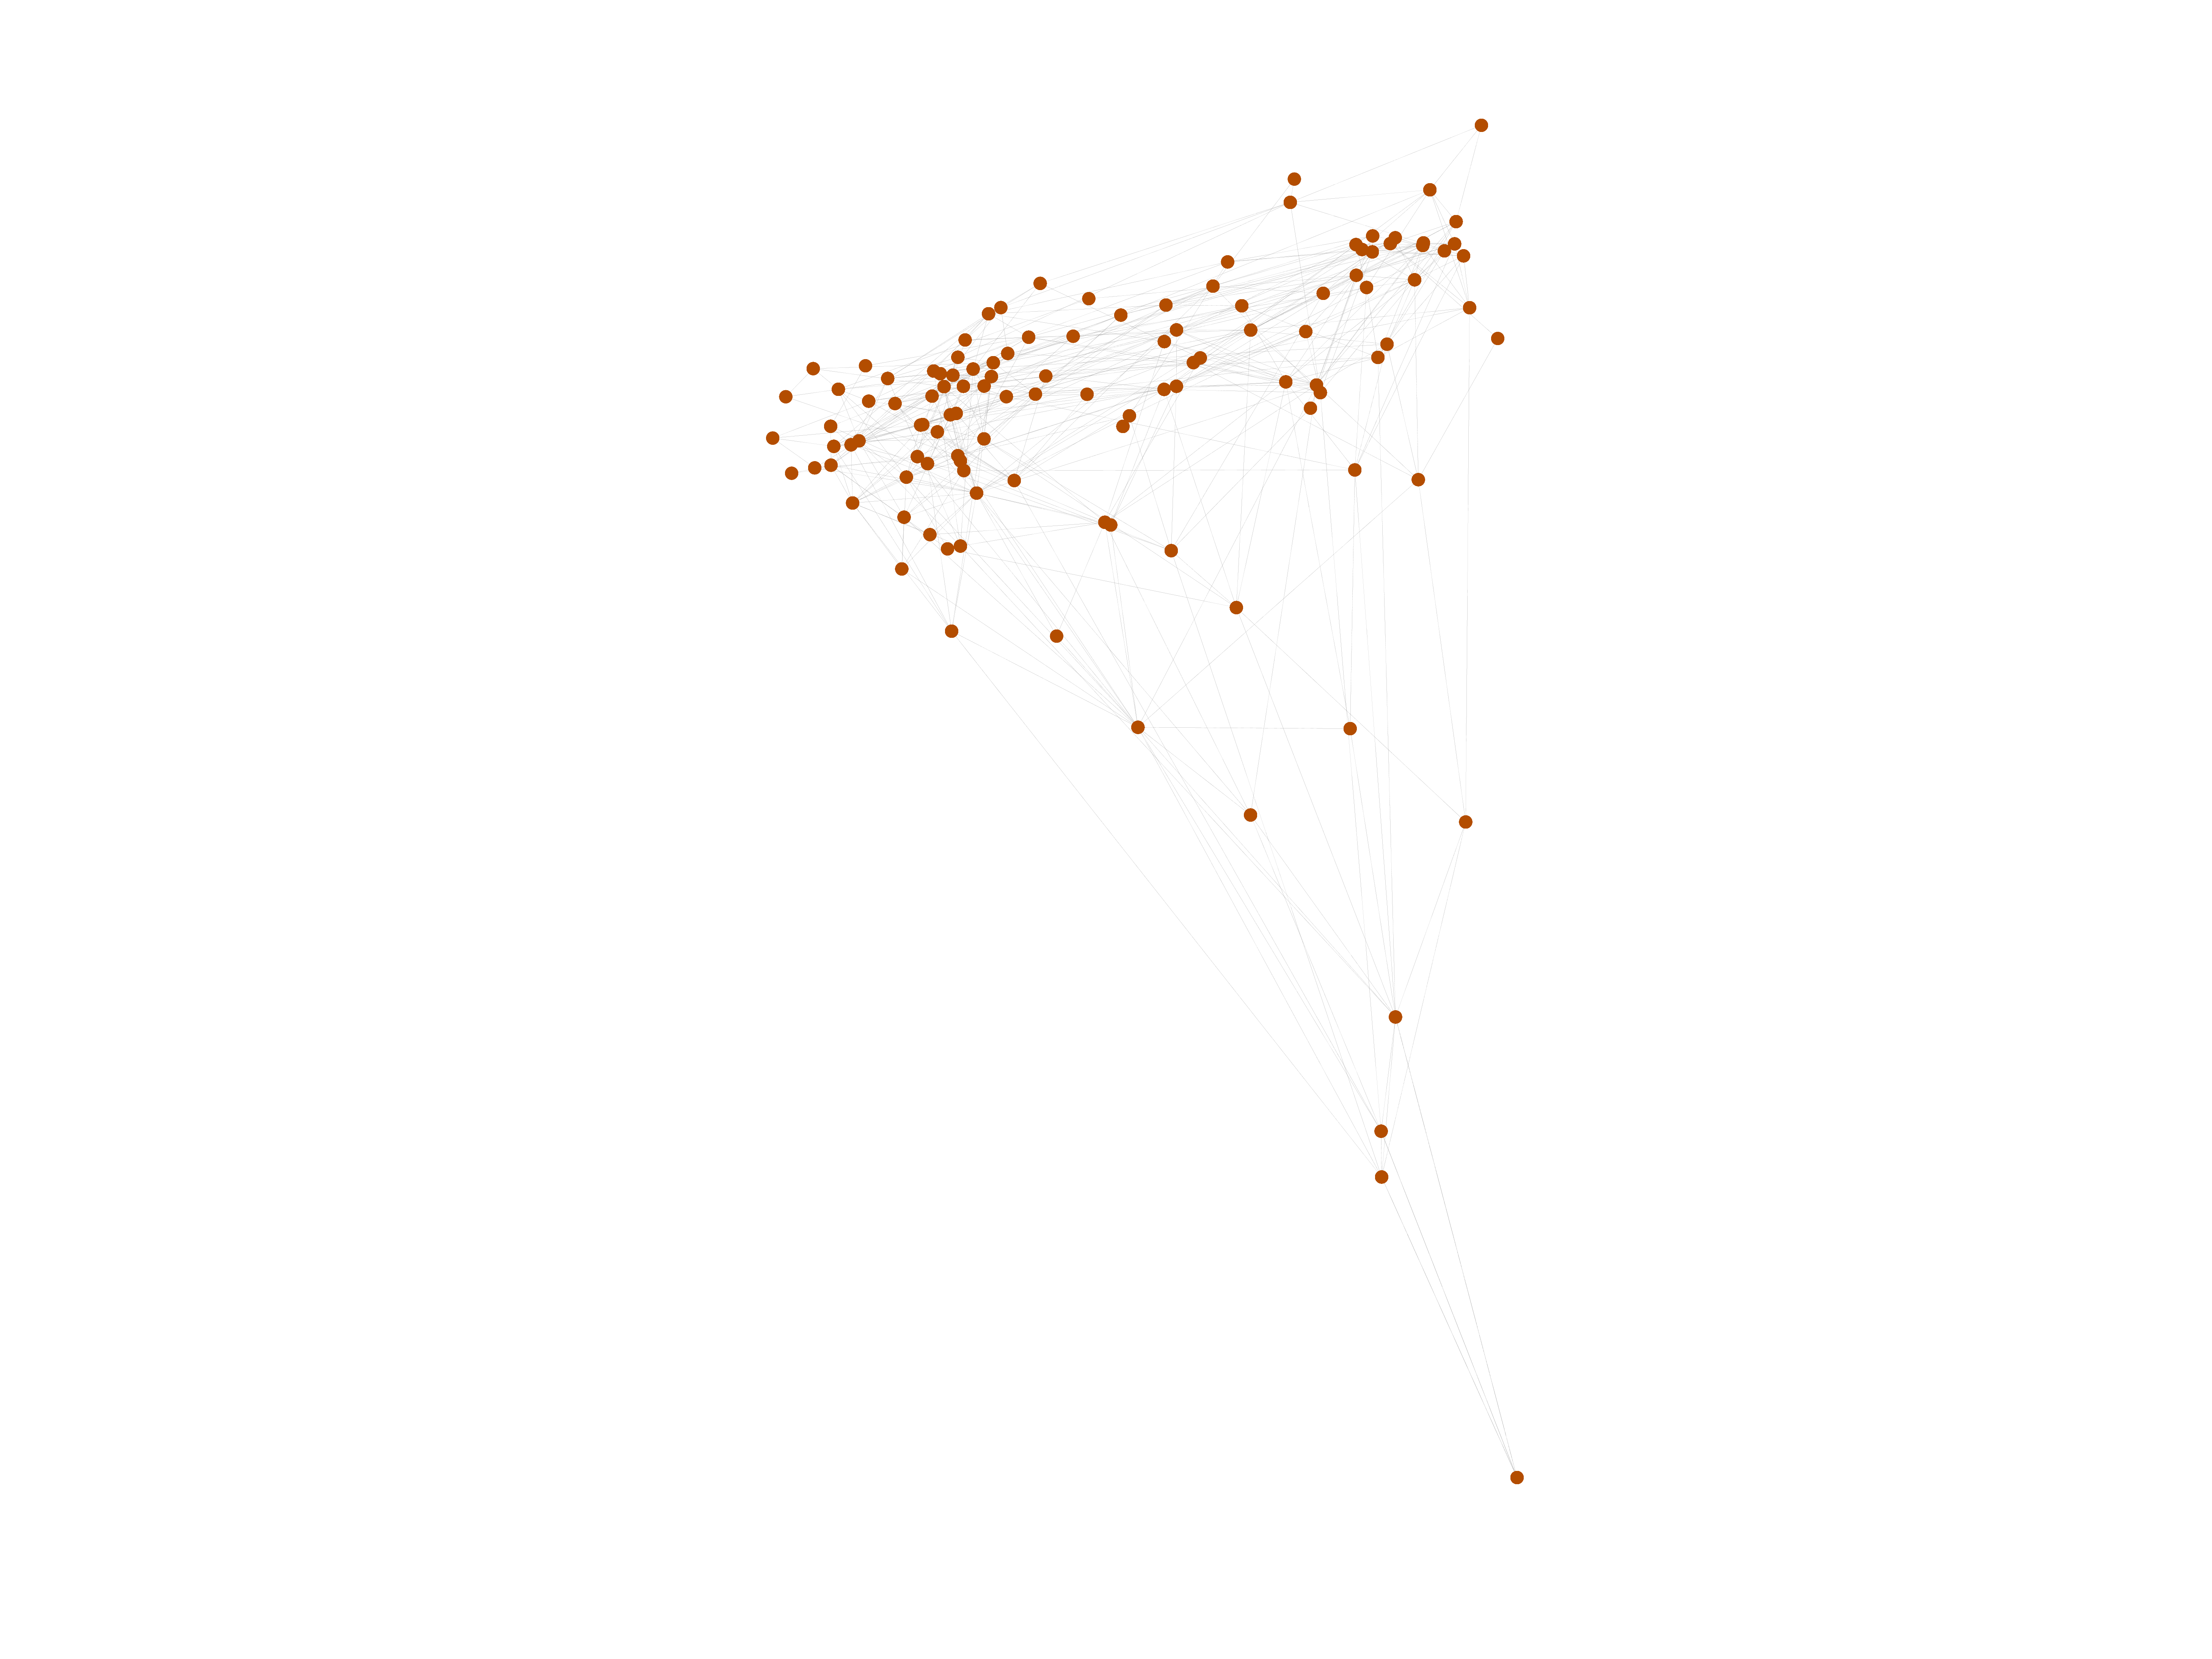
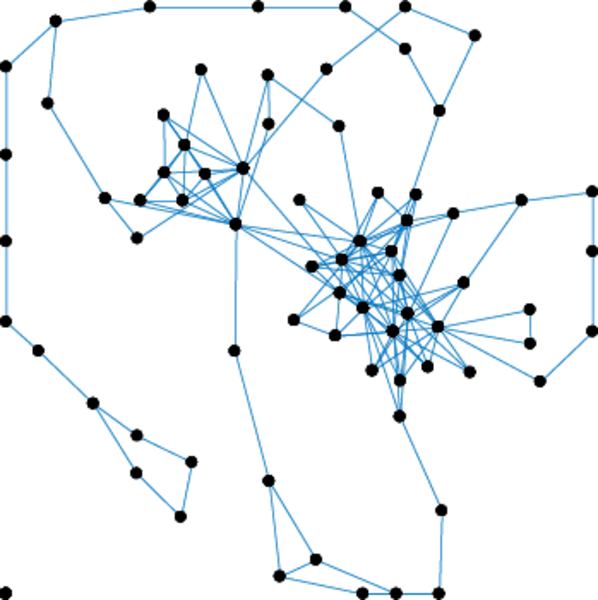
This directed network captures innovation spread among 246 physicians in for towns in Illinois, Peoria, Bloomington, Quincy and Galesburg. The data was collected in 1966. A node represents a physician and an edge between two physicians shows that the left physician told that the righ physician is his friend or that he turns to the right physician if he needs advice or is interested in a discussion. There always only exists one edge between two nodes even if more than one of the listed conditions are true.

Metadata

CodeMI
Internal namemoreno_innovation
NamePhysicians
Data sourcehttp://moreno.ss.uci.edu/data.html#ckm
AvailabilityDataset is available for download
Consistency checkDataset passed all tests
Category
Human social network
Dataset timestamp 1966
Node meaningPhysician
Edge meaningTrust
Network formatUnipartite, directed
Edge typeUnweighted, no multiple edges
ReciprocalContains reciprocal edges
Directed cyclesContains directed cycles
LoopsDoes not contain loops

Statistics

Size n =241
Volume m =1,098
Loop count l =0
Wedge count s =8,026
Claw count z =50,535
Cross count x =198,678
Triangle count t =672
Square count q =3,165
4-Tour count T4 =59,270
Maximum degree dmax =34
Maximum outdegree d+max =9
Maximum indegree dmax =26
Average degree d =9.112 03
Fill p =0.018 983 4
Size of LCC N =117
Size of LSCC Ns =95
Relative size of LSCC Nrs =0.394 191
Diameter δ =5
50-Percentile effective diameter δ0.5 =2.045 99
90-Percentile effective diameter δ0.9 =2.909 66
Median distance δM =3
Mean distance δm =2.485 64
Gini coefficient G =0.285 124
Balanced inequality ratio P =0.395 264
Outdegree balanced inequality ratio P+ =0.437 158
Indegree balanced inequality ratio P =0.347 905
Relative edge distribution entropy Her =0.975 396
Power law exponent γ =1.524 85
Tail power law exponent γt =4.621 00
Tail power law exponent with p γ3 =4.621 00
p-value p =0.705 000
Outdegree tail power law exponent with p γ3,o =8.991 00
Outdegree p-value po =0.038 000 0
Indegree tail power law exponent with p γ3,i =3.791 00
Indegree p-value pi =0.076 000 0
Degree assortativity ρ =−0.055 829 1
Degree assortativity p-value pρ =0.016 442 2
In/outdegree correlation ρ± =+0.058 852 2
Clustering coefficient c =0.251 184
Directed clustering coefficient c± =0.232 520
Spectral norm α =12.899 1
Operator 2-norm ν =7.582 14
Cyclic eigenvalue π =5.726 33
Algebraic connectivity a =1.487 36
Spectral separation 1[A] / λ2[A]| =1.037 57
Reciprocity y =0.318 761
Non-bipartivity bA =0.510 672
Normalized non-bipartivity bN =0.406 933
Algebraic non-bipartivity χ =1.505 05
Spectral bipartite frustration bK =0.047 336 2
Controllability C =32
Relative controllability Cr =0.132 780

Plots

Fruchterman–Reingold graph drawing

Degree distribution

Cumulative degree distribution

Lorenz curve

Spectral distribution of the adjacency matrix

Spectral distribution of the normalized adjacency matrix

Spectral distribution of the Laplacian

Spectral graph drawing based on the adjacency matrix

Spectral graph drawing based on the Laplacian

Spectral graph drawing based on the normalized adjacency matrix

Degree assortativity

Zipf plot

Hop distribution

Double Laplacian graph drawing

Delaunay graph drawing

In/outdegree scatter plot

Clustering coefficient distribution

Average neighbor degree distribution

SynGraphy

Matrix decompositions plots

Downloads

References

[1] Jérôme Kunegis. KONECT – The Koblenz Network Collection. In Proc. Int. Conf. on World Wide Web Companion, pages 1343–1350, 2013. [ http ]
[2] James Coleman, Elihu Katz, and Herbert Menzel. The diffusion of an innovation among physicians. Sociometry, pages 253–270, 1957.