Kangaroos

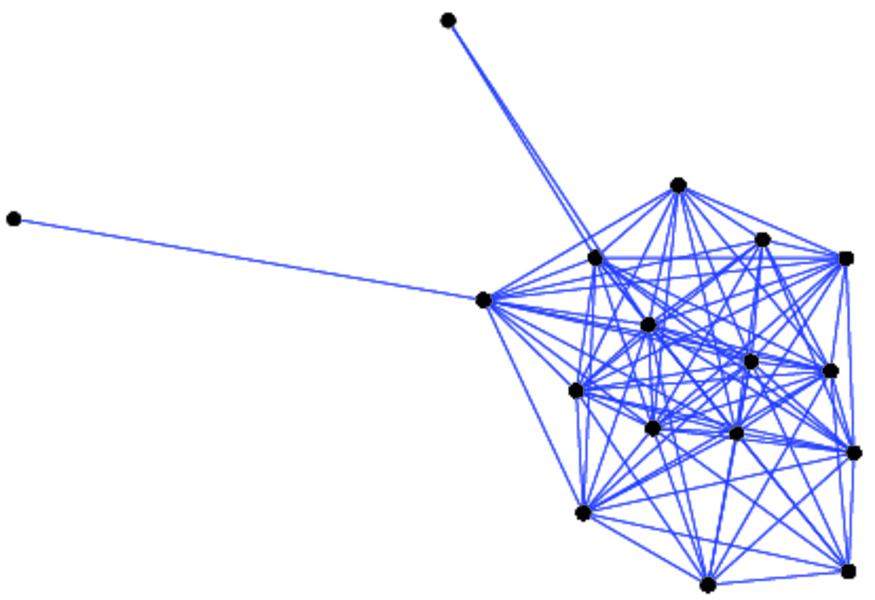
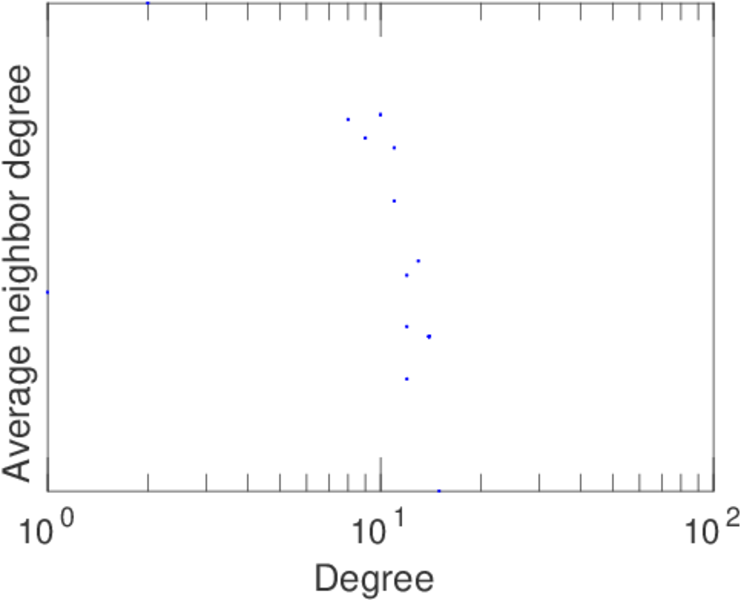
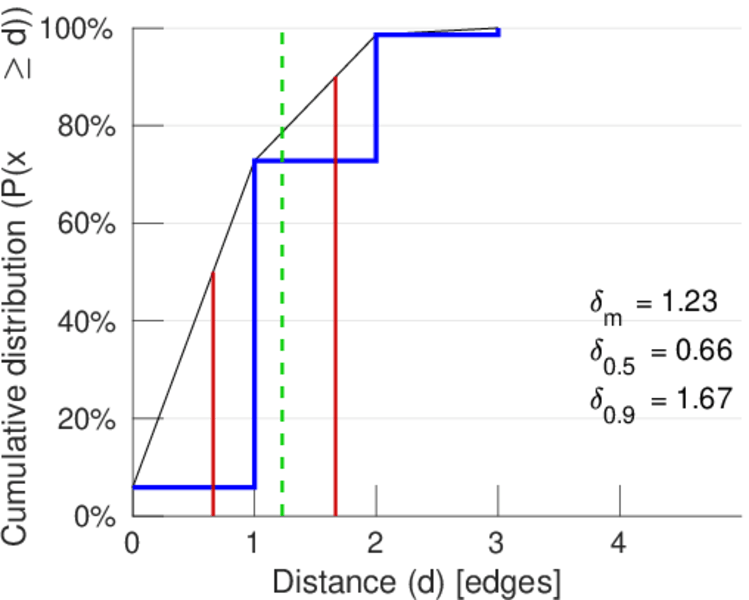
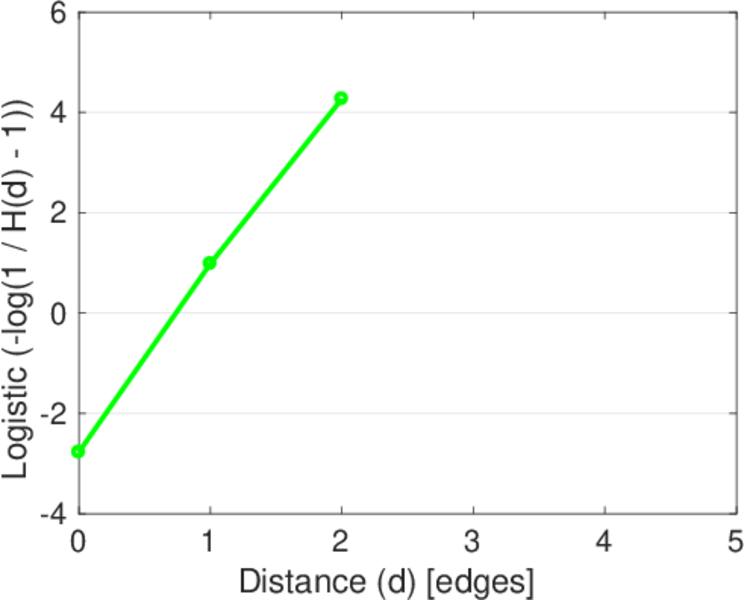
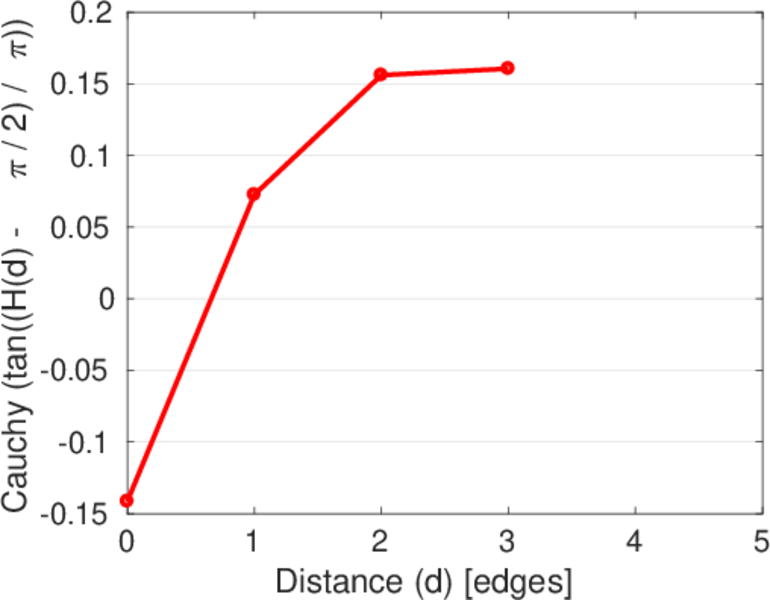
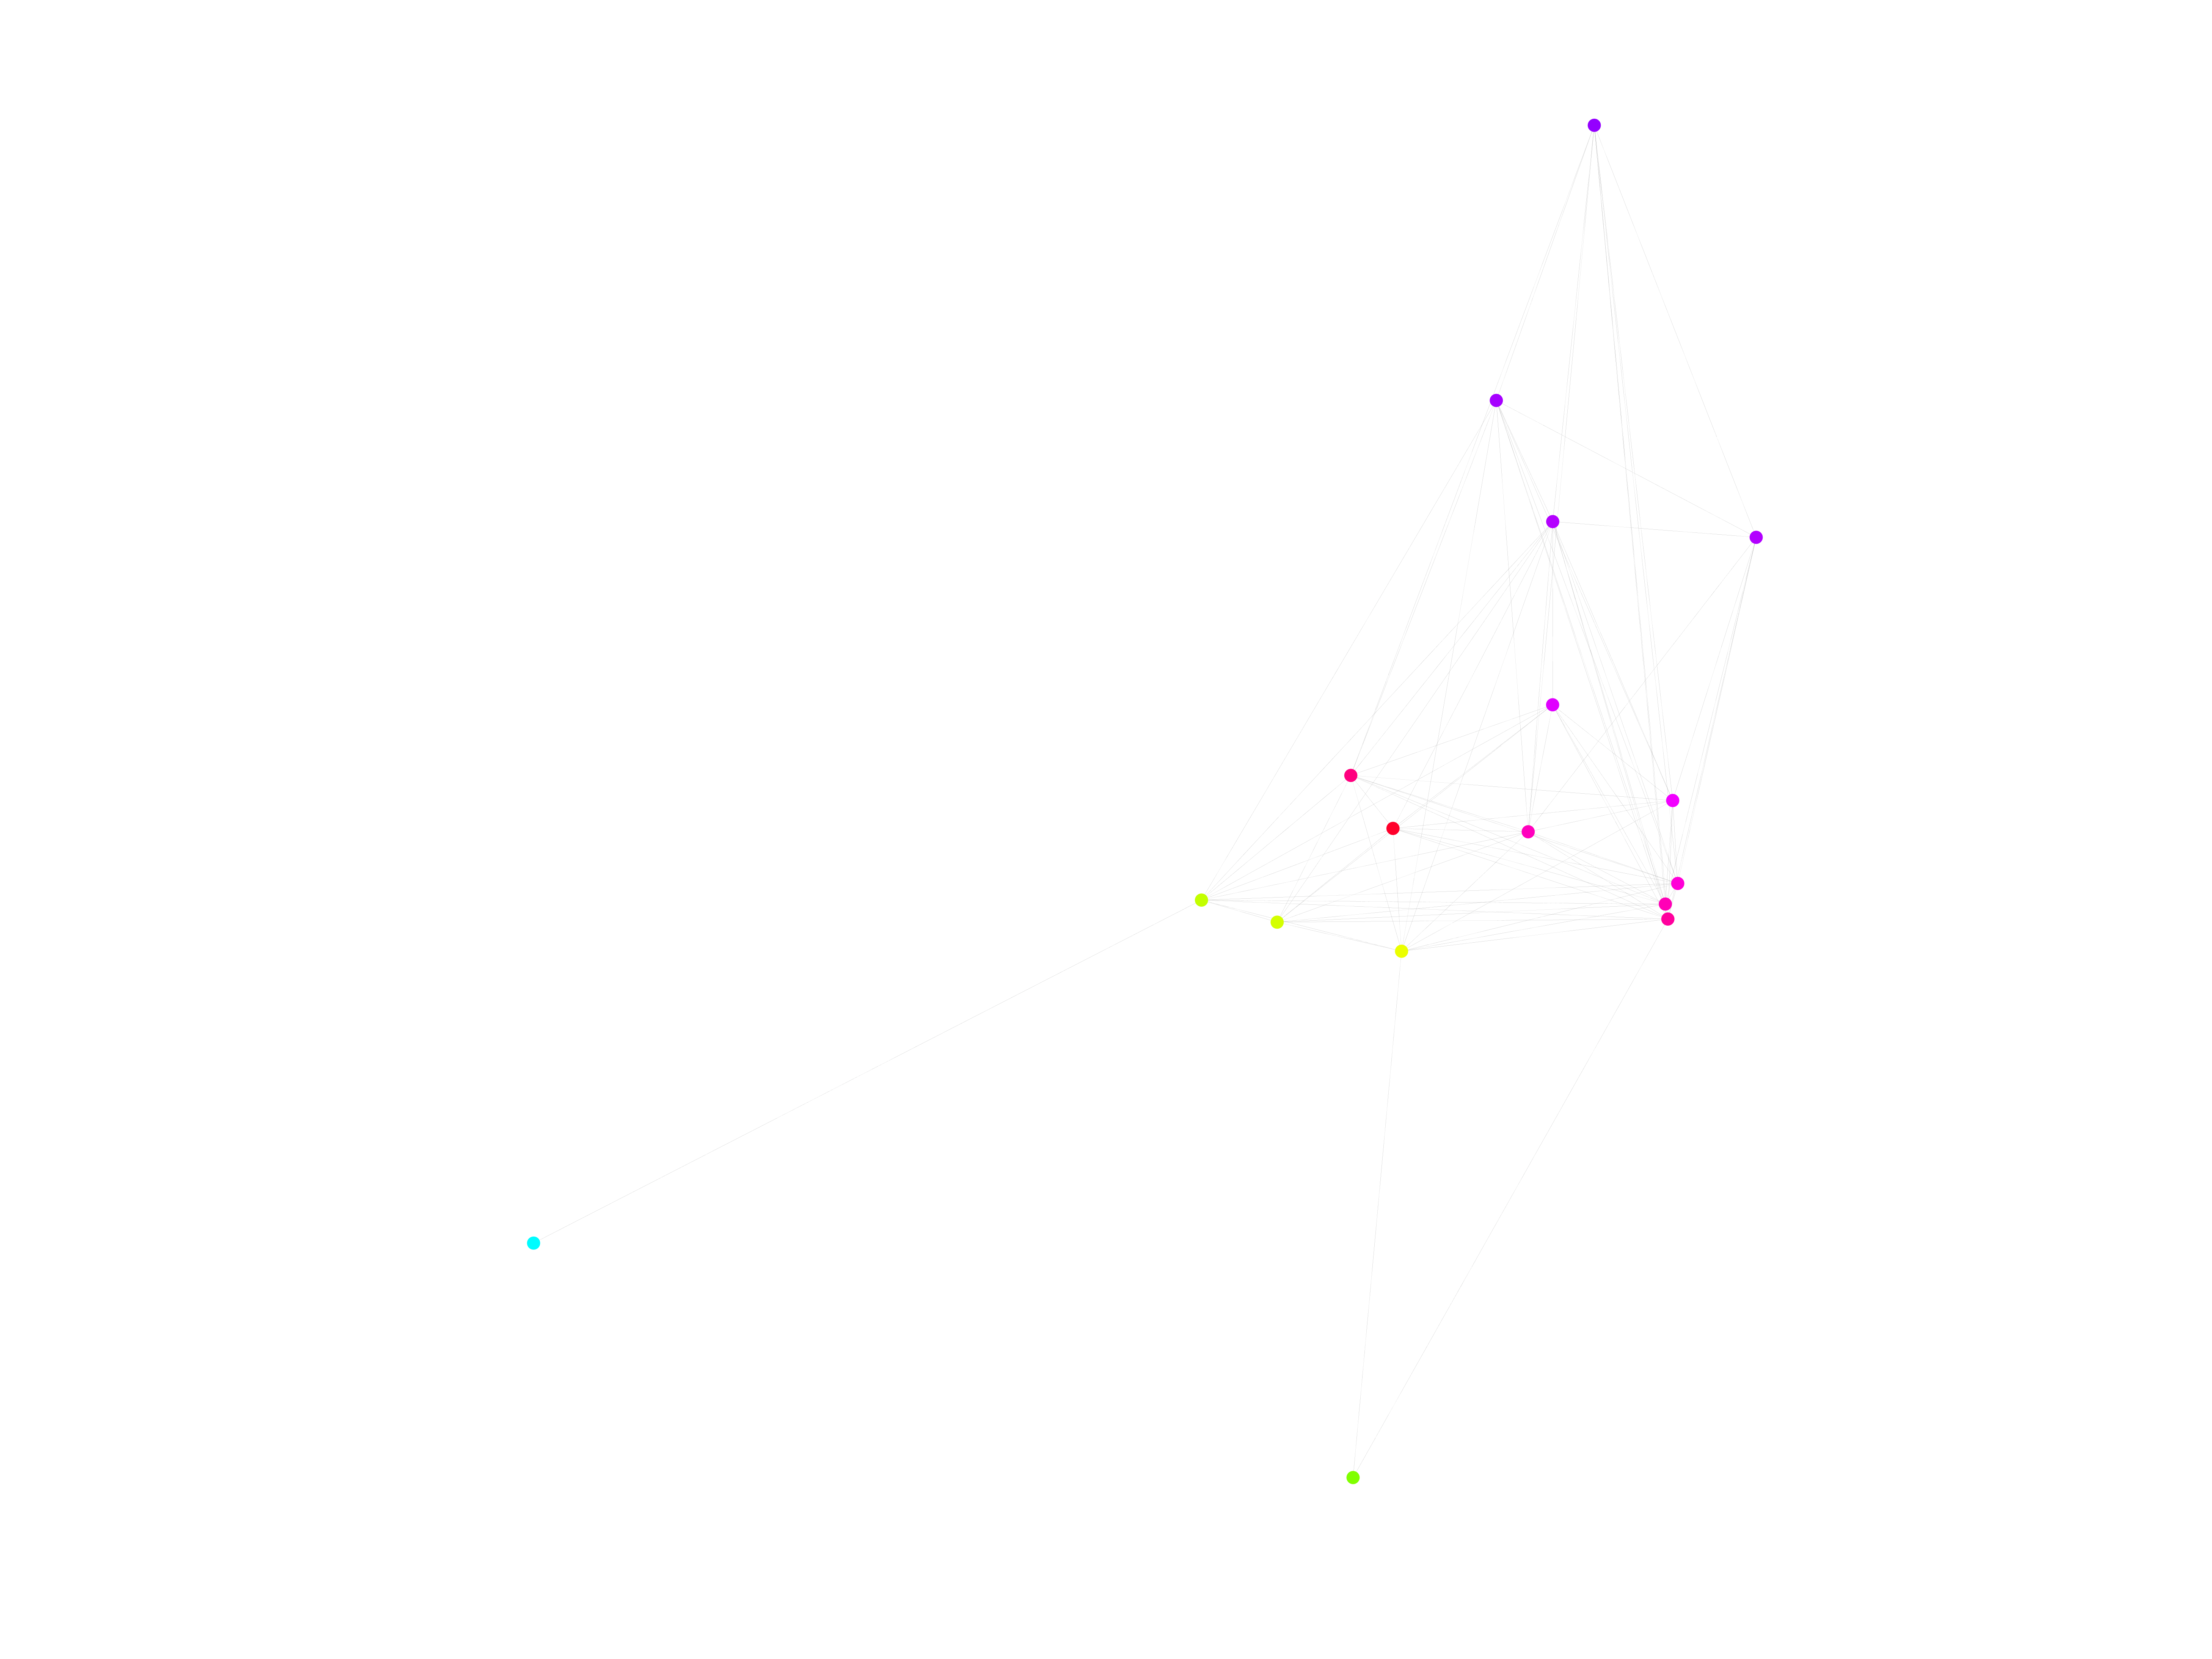
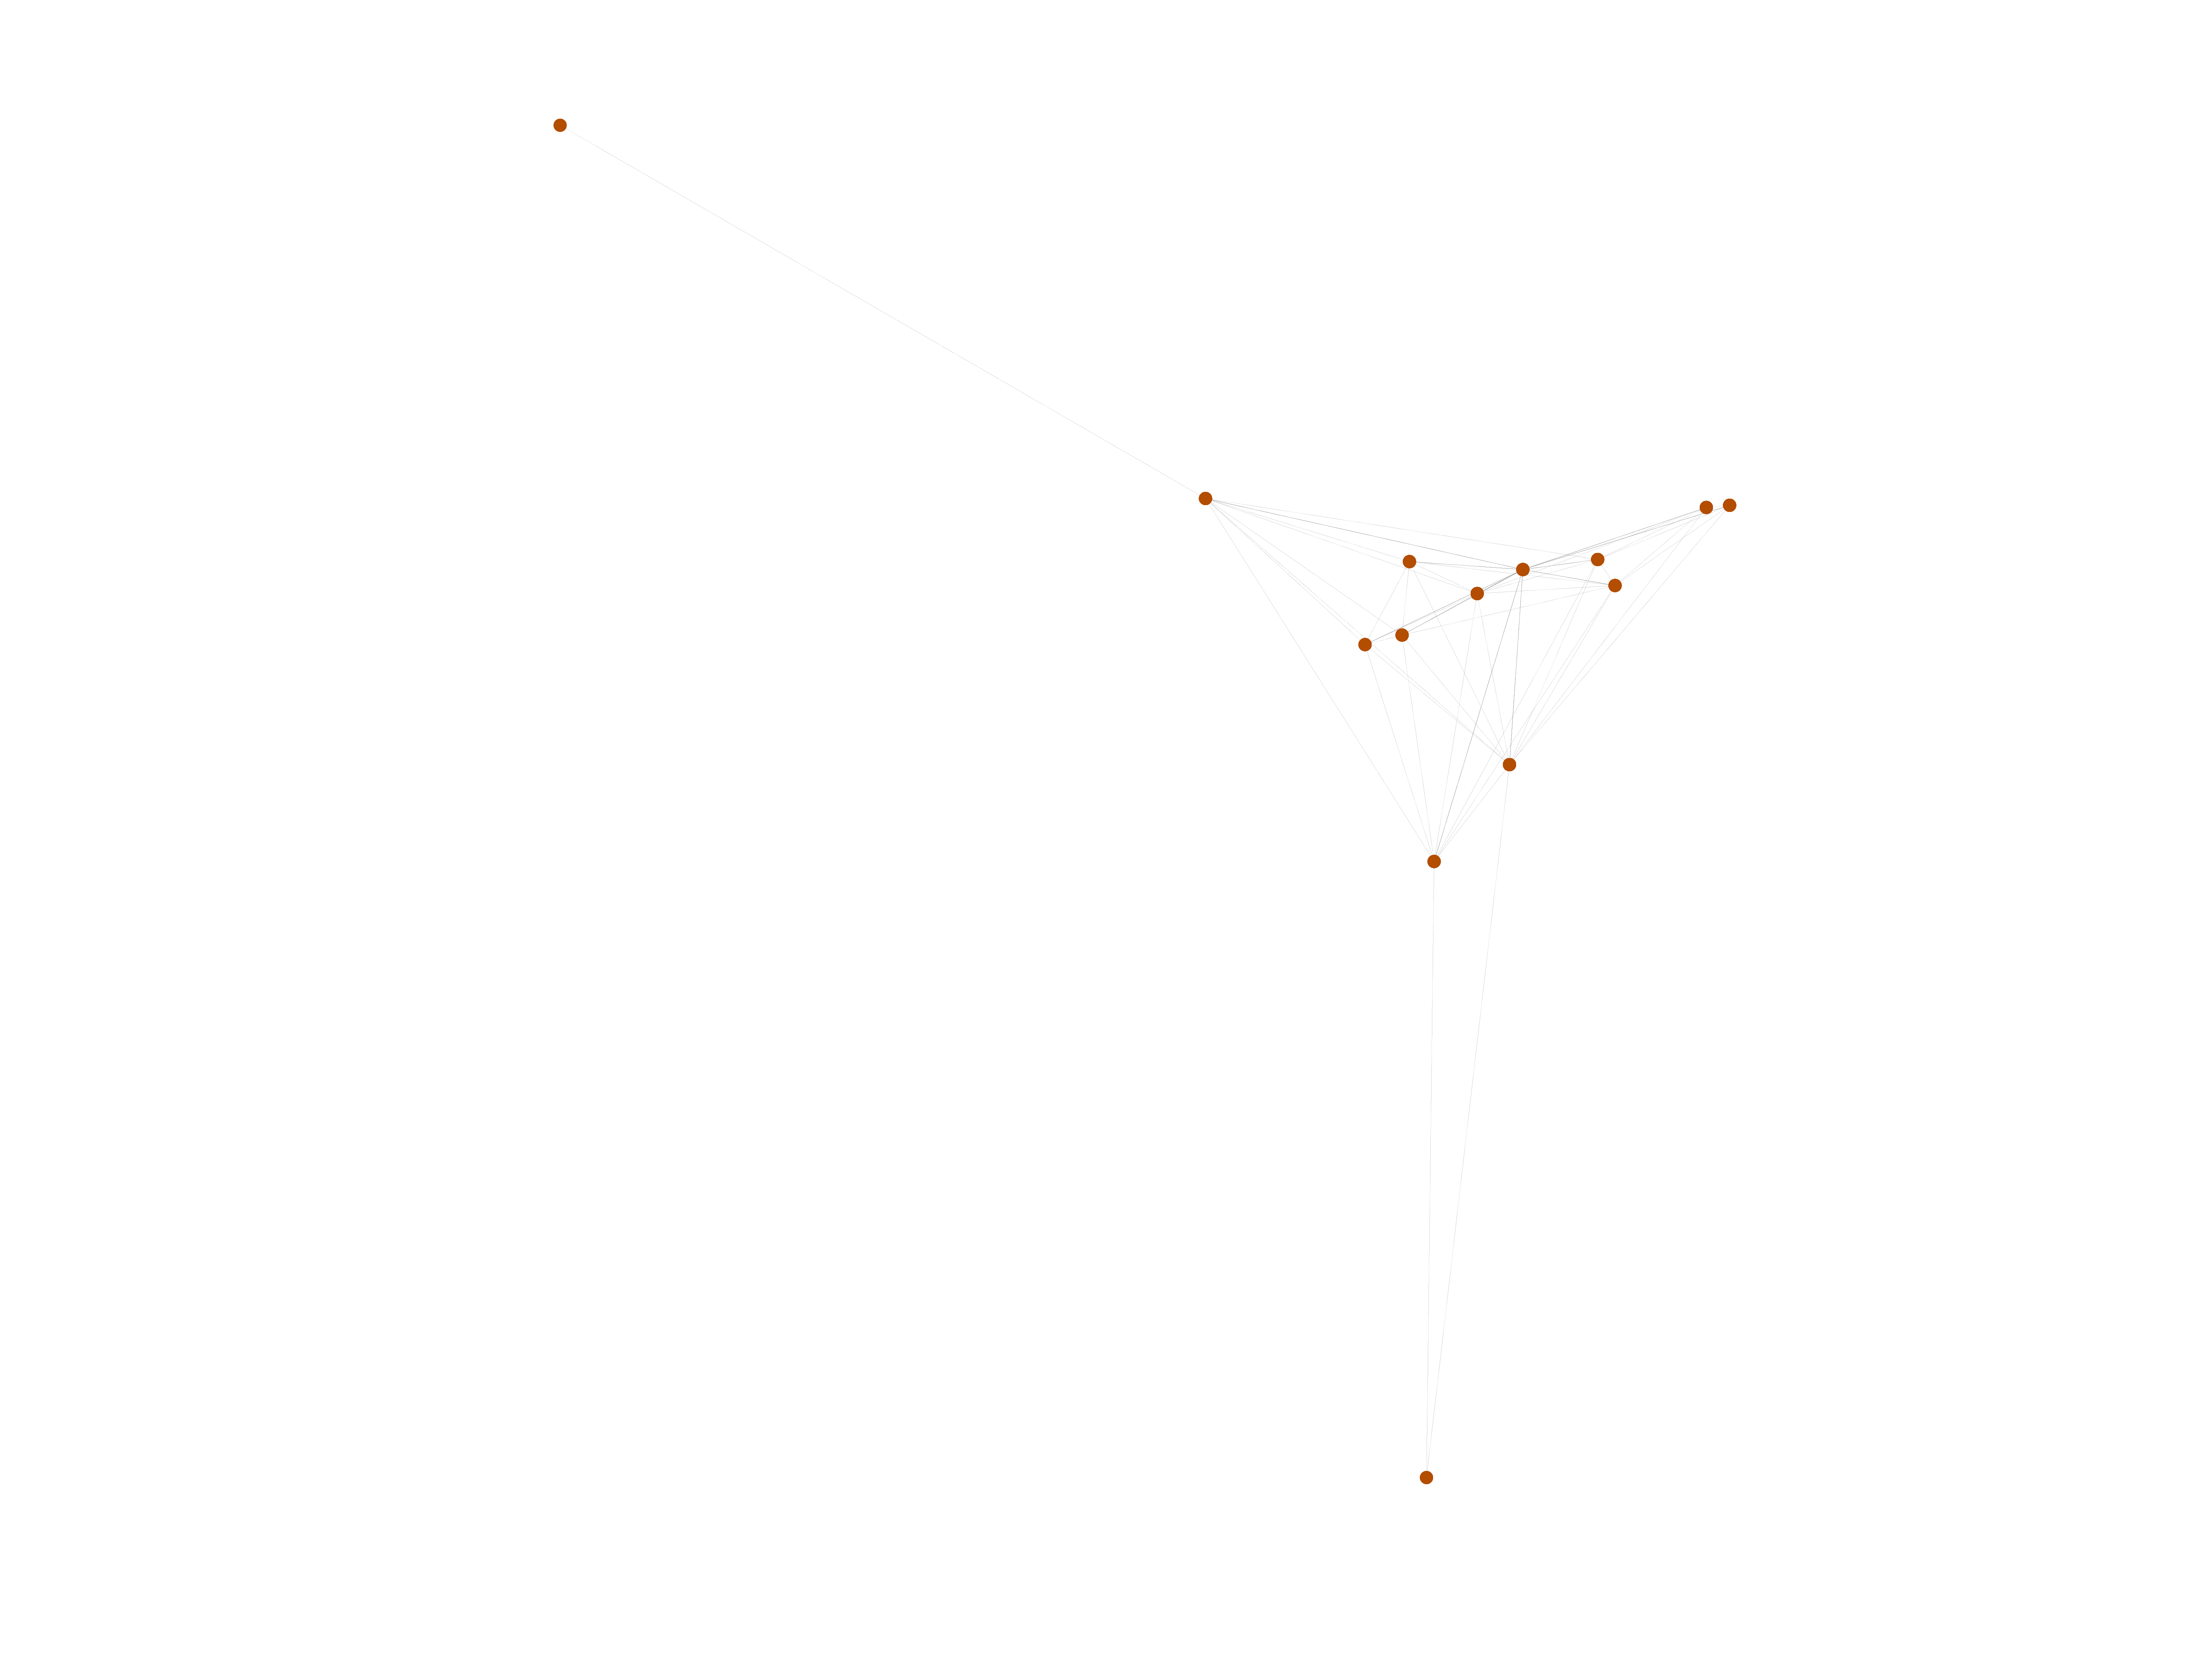
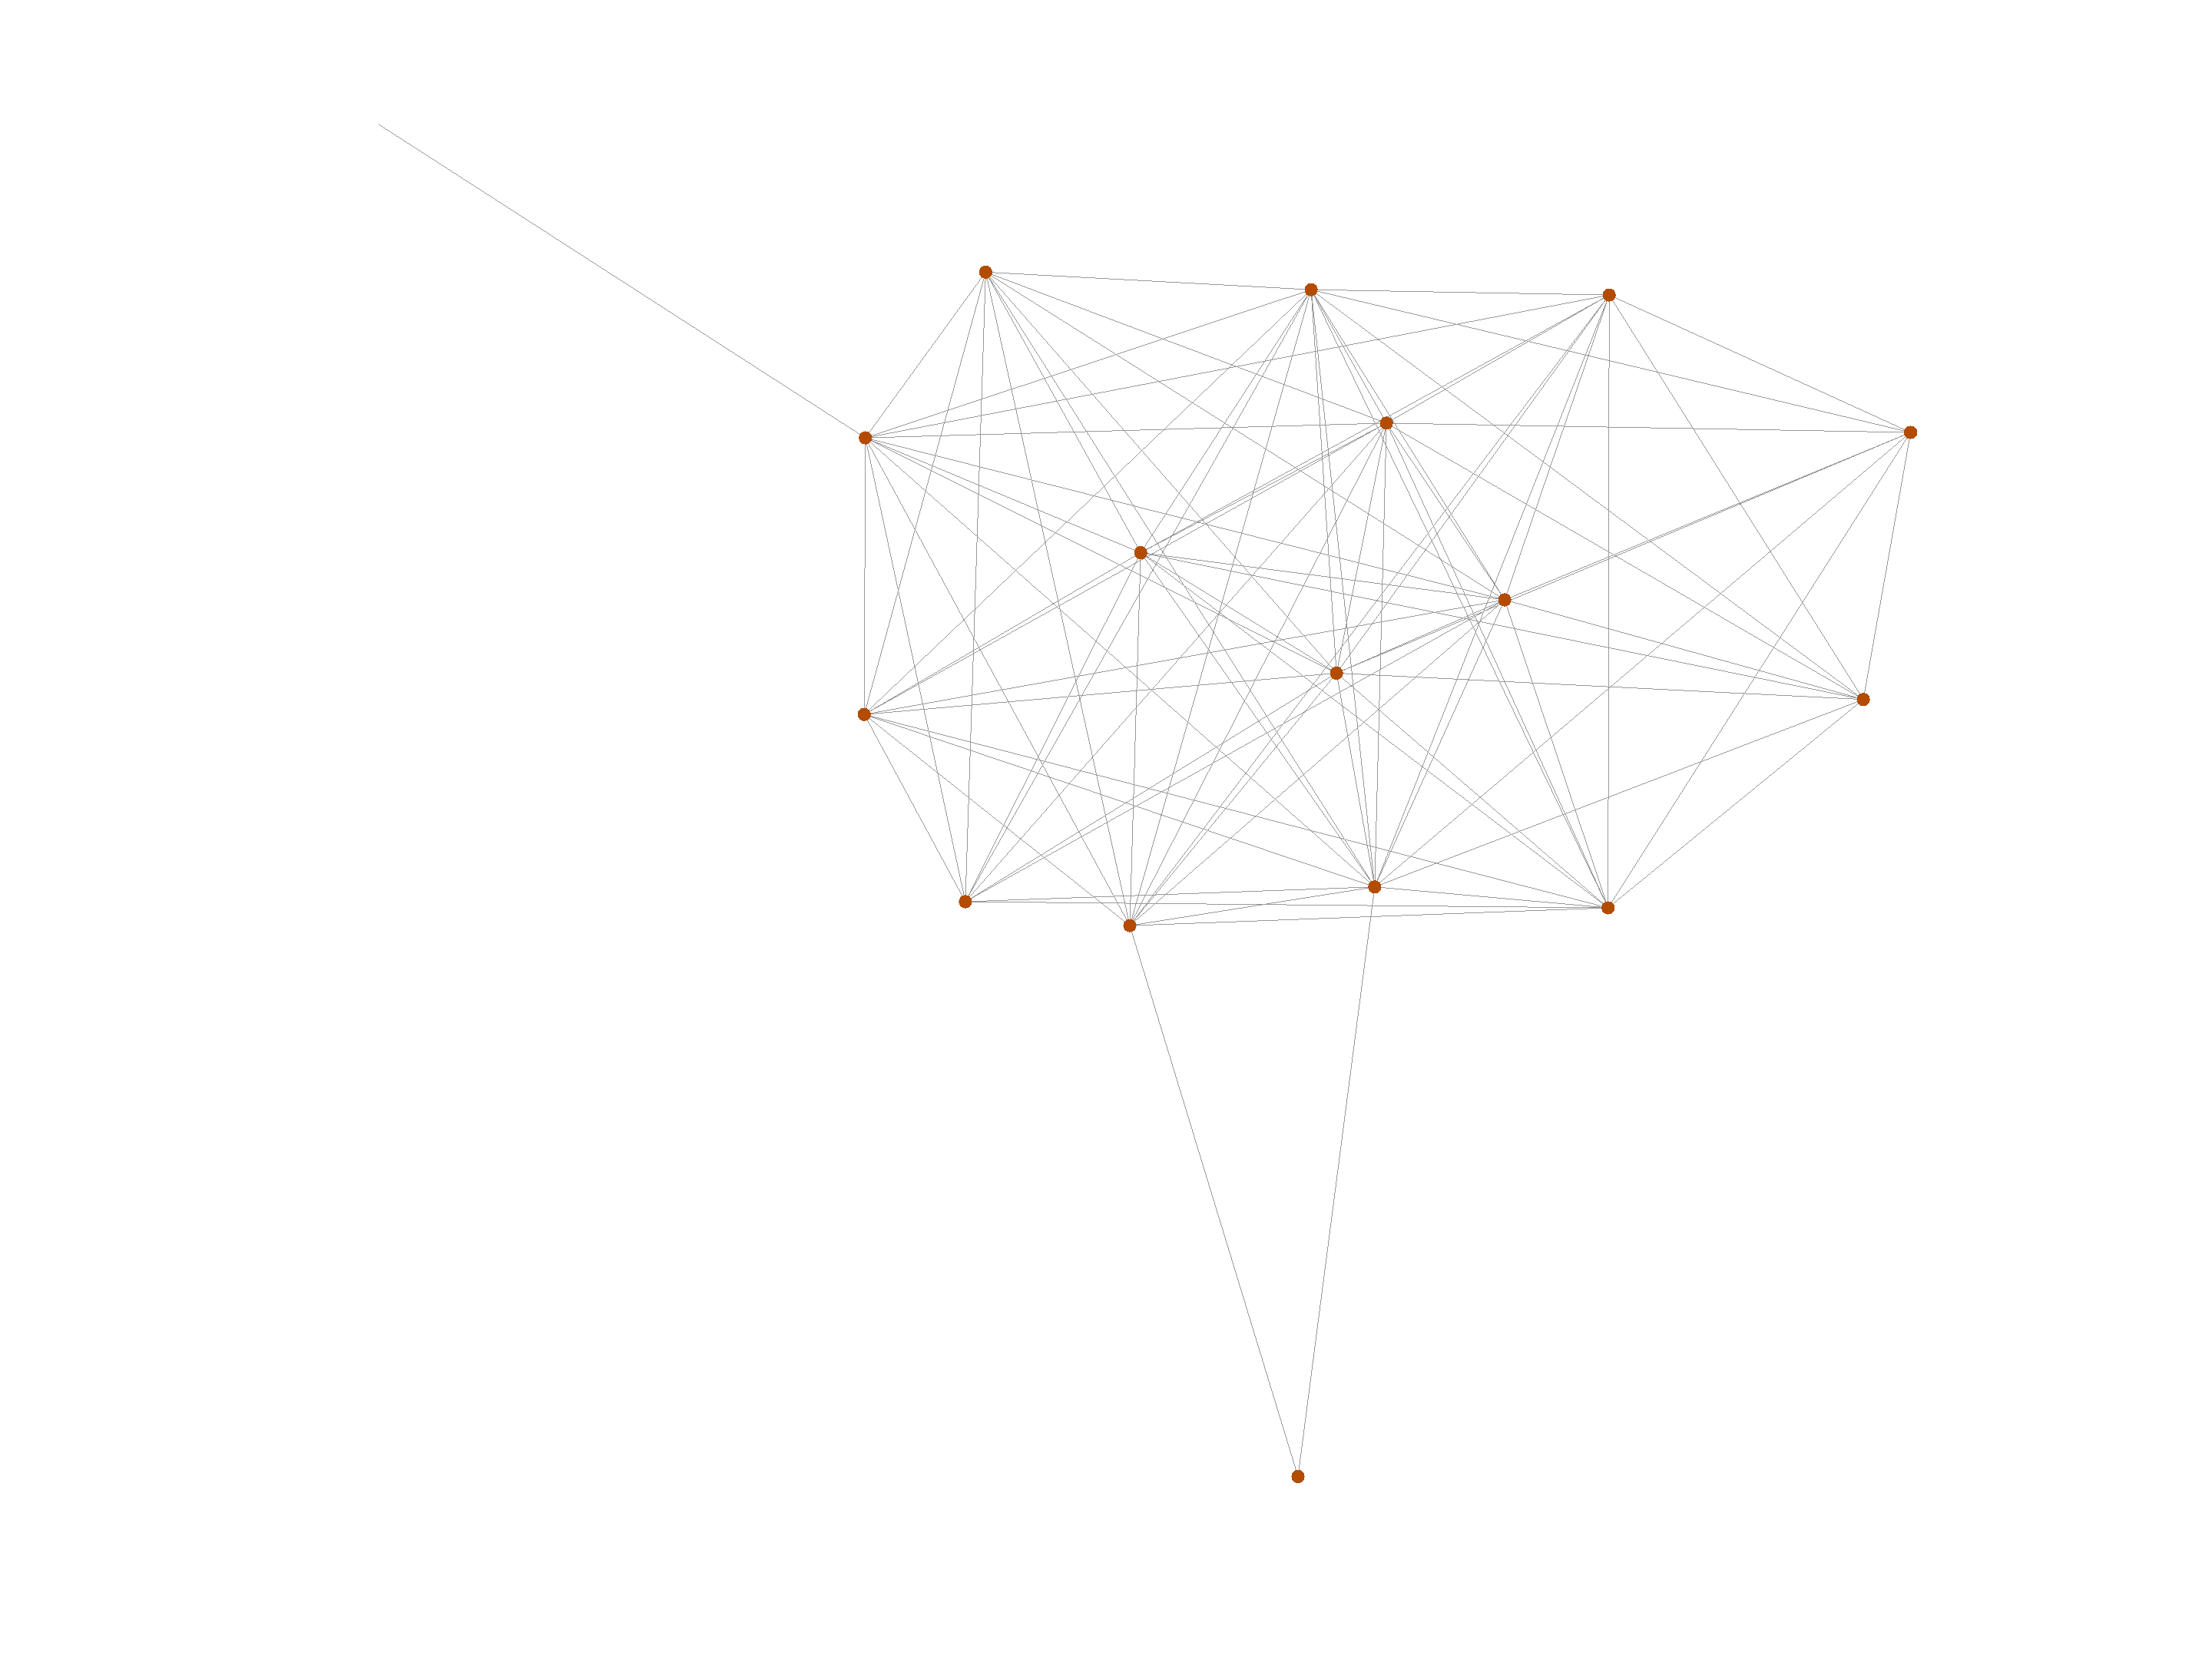
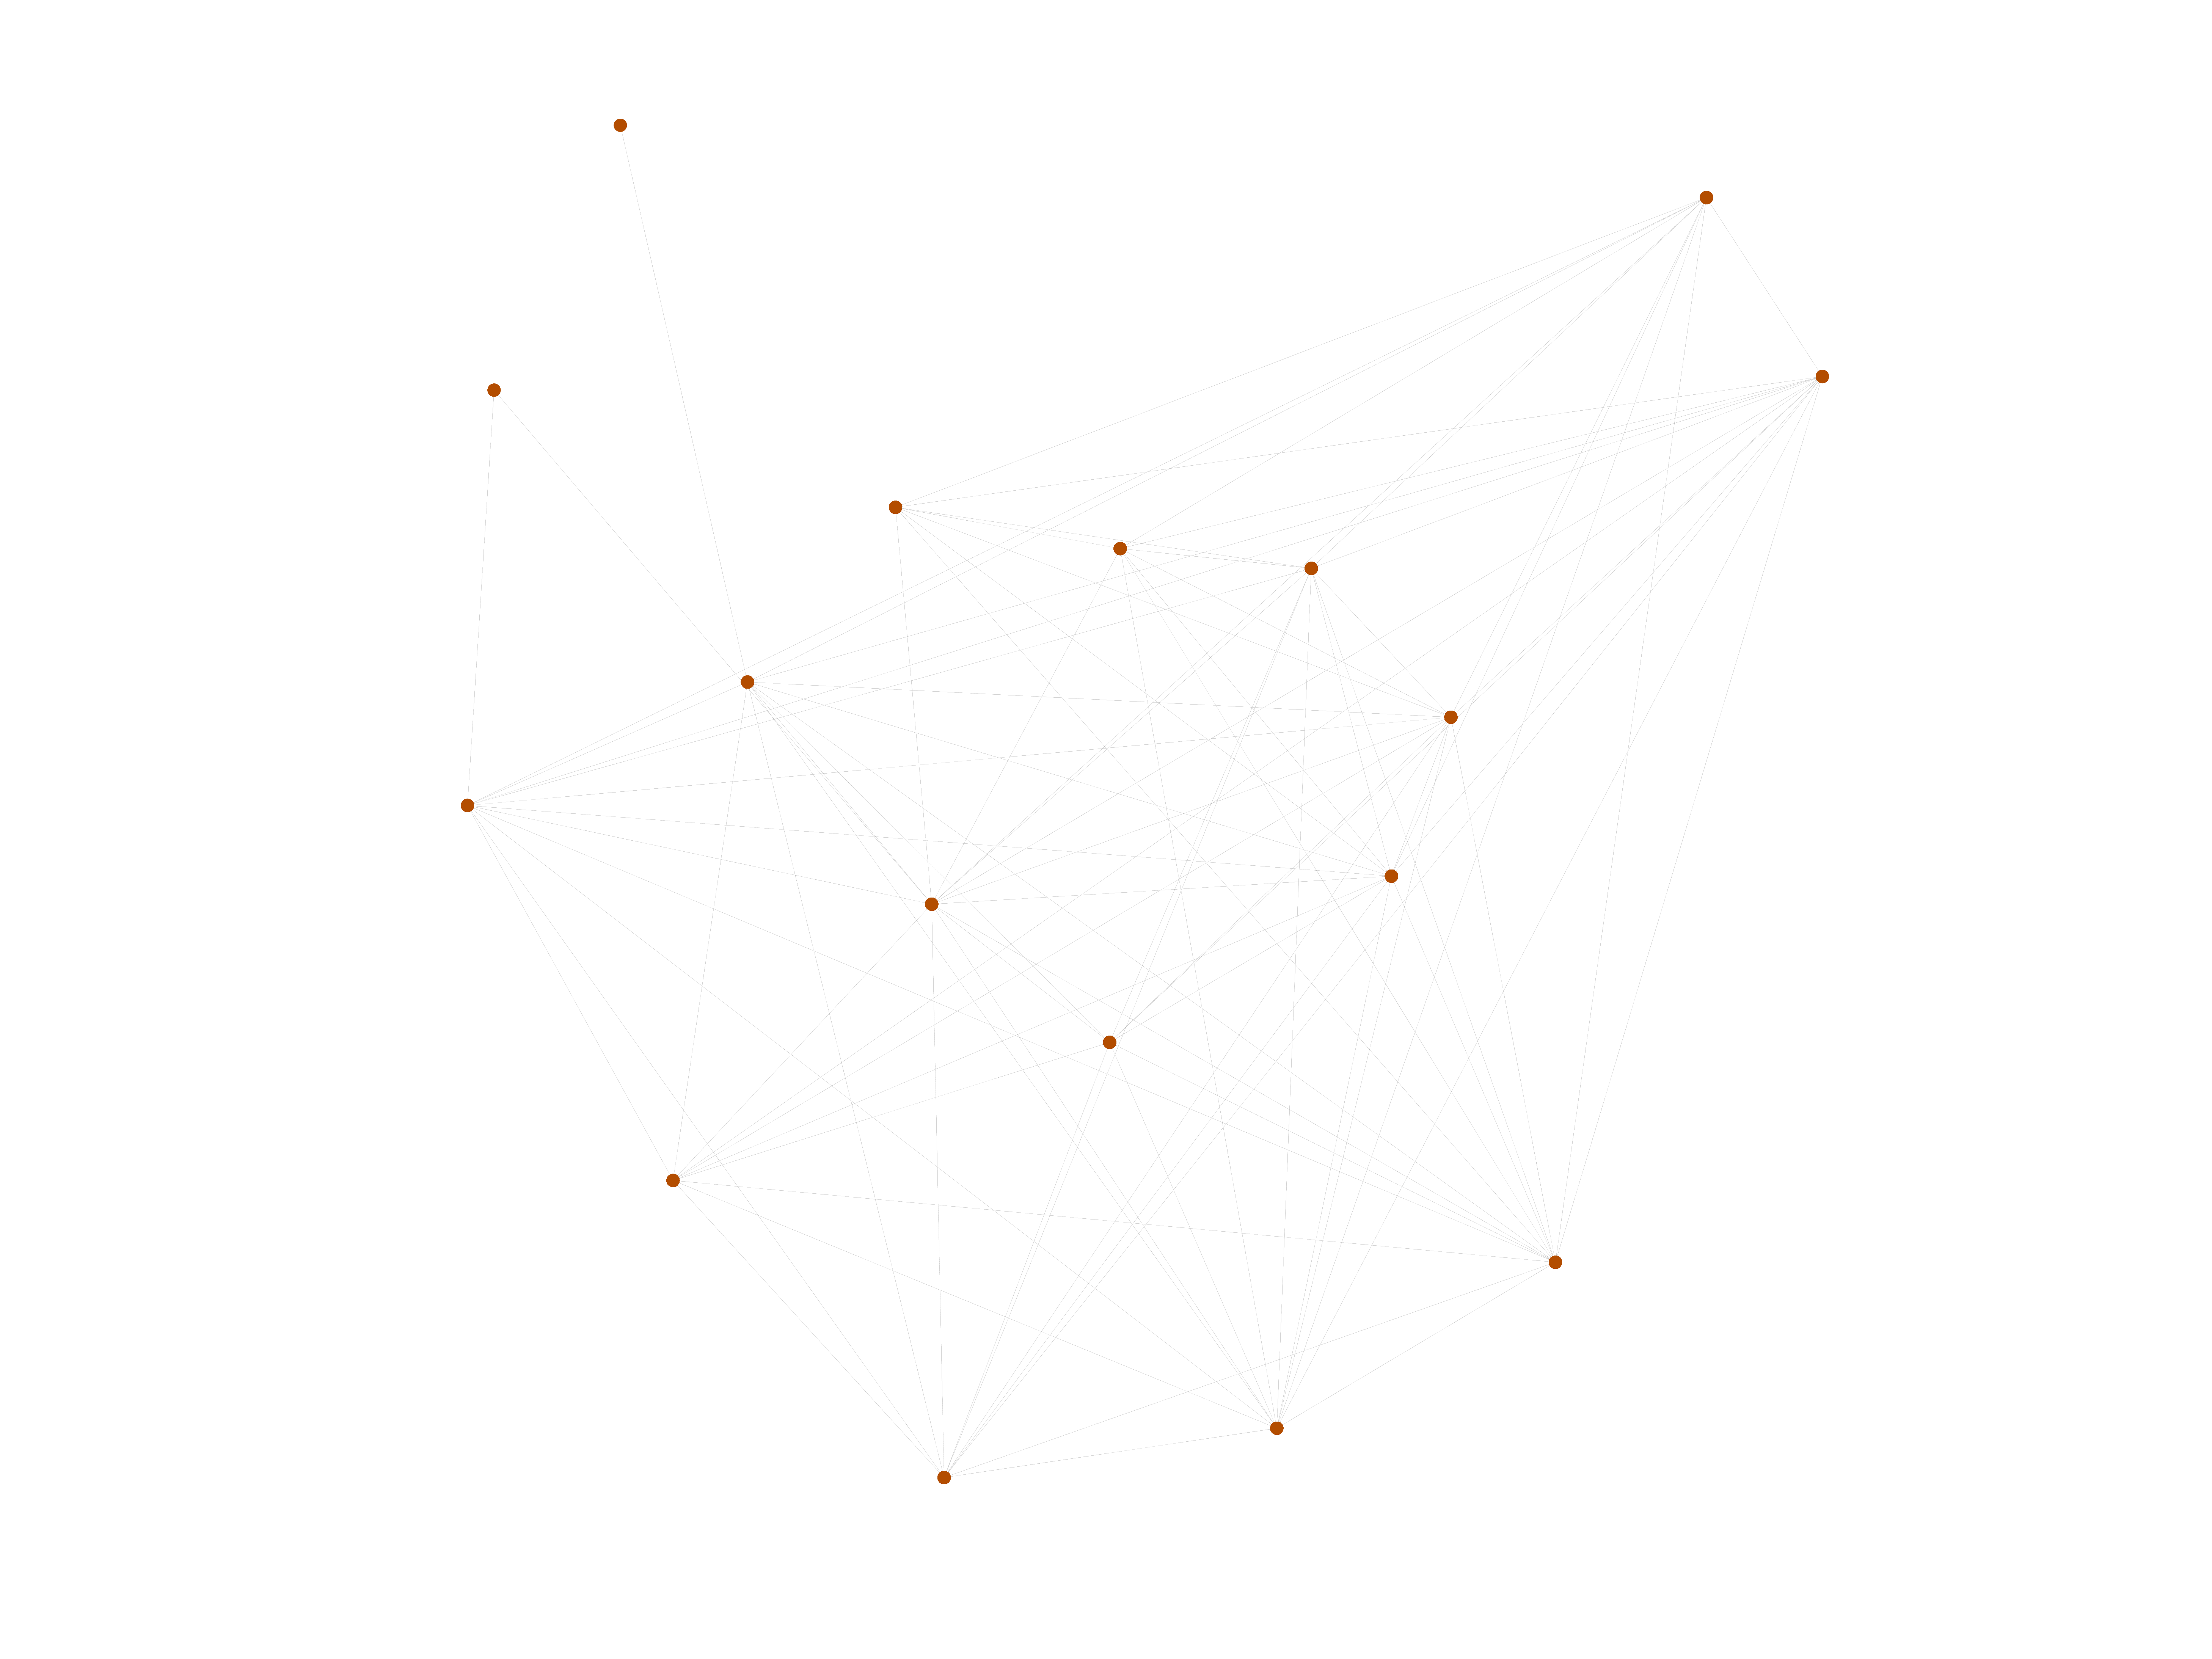
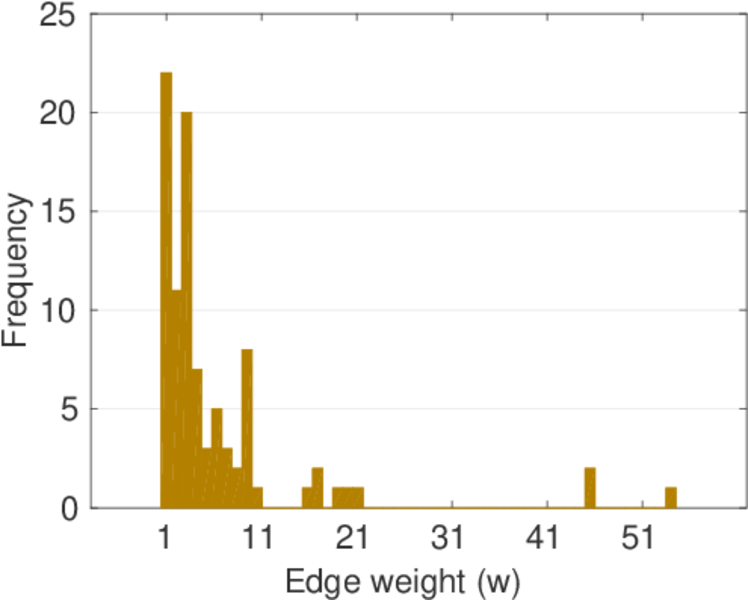
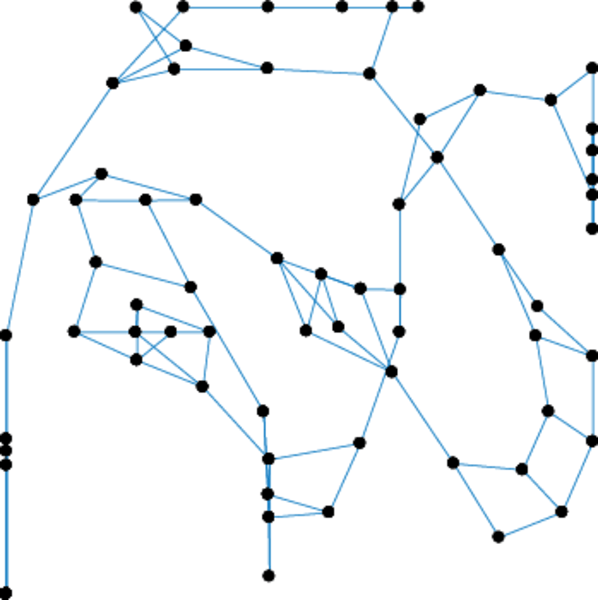
This undirected network contains interactions between free-ranging eastern grey kangaroos (Macropus giganteus) in the Nadgee Nature Reserve in New South Wales, Australia. A node represents a kangaroo and an edge between two kangaroos shows that there was an interaction between them. The edge weights denote the number of interactions.

Metadata

CodeMK
Internal namemoreno_kangaroo
NameKangaroos
Data sourcehttp://moreno.ss.uci.edu/data.html#kangaroo
AvailabilityDataset is available for download
Consistency checkDataset passed all tests
Category
Animal network
Dataset timestamp 1973
Node meaningKangaroo
Edge meaningInteraction
Network formatUnipartite, undirected
Edge typePositive weights, no multiple edges
LoopsDoes not contain loops

Statistics

Size n =17
Volume m =91
Loop count l =0
Wedge count s =1,010
Claw count z =3,567
Cross count x =8,845
Triangle count t =283
Square count q =2,114
4-Tour count T4 =21,134
Maximum degree dmax =15
Average degree d =10.705 9
Fill p =0.669 118
Size of LCC N =17
Diameter δ =3
50-Percentile effective diameter δ0.5 =0.659 794
90-Percentile effective diameter δ0.9 =1.666 67
Median distance δM =1
Mean distance δm =1.227 59
Gini coefficient G =0.184 228
Balanced inequality ratio P =0.406 593
Relative edge distribution entropy Her =0.968 337
Power law exponent γ =1.451 47
Tail power law exponent γt =6.071 00
Tail power law exponent with p γ3 =6.071 00
p-value p =0.056 000 0
Degree assortativity ρ =−0.193 351
Degree assortativity p-value pρ =0.008 917 49
Clustering coefficient c =0.840 594
Spectral norm α =124.790
Algebraic connectivity a =1.039 00
Spectral separation 1[A] / λ2[A]| =2.307 23
Non-bipartivity bA =0.765 565
Normalized non-bipartivity bN =0.654 378
Algebraic non-bipartivity χ =0.904 799
Spectral bipartite frustration bK =0.021 128 5
Controllability C =0
Relative controllability Cr =0.000 00

Plots

Fruchterman–Reingold graph drawing

Degree distribution

Cumulative degree distribution

Lorenz curve

Spectral distribution of the adjacency matrix

Spectral distribution of the normalized adjacency matrix

Spectral distribution of the Laplacian

Spectral graph drawing based on the adjacency matrix

Spectral graph drawing based on the Laplacian

Spectral graph drawing based on the normalized adjacency matrix

Degree assortativity

Zipf plot

Hop distribution

Double Laplacian graph drawing

Delaunay graph drawing

Edge weight/multiplicity distribution

Clustering coefficient distribution

Average neighbor degree distribution

SynGraphy

Matrix decompositions plots

Downloads

References

[1] Jérôme Kunegis. KONECT – The Koblenz Network Collection. In Proc. Int. Conf. on World Wide Web Companion, pages 1343–1350, 2013. [ http ]
[2] T. R. Grant. Dominance and association among members of a captive and a free-ranging group of grey kangaroos (Macropus giganteus). Anim. Behav., 21(3):449–456, 1973.