Les Misérables

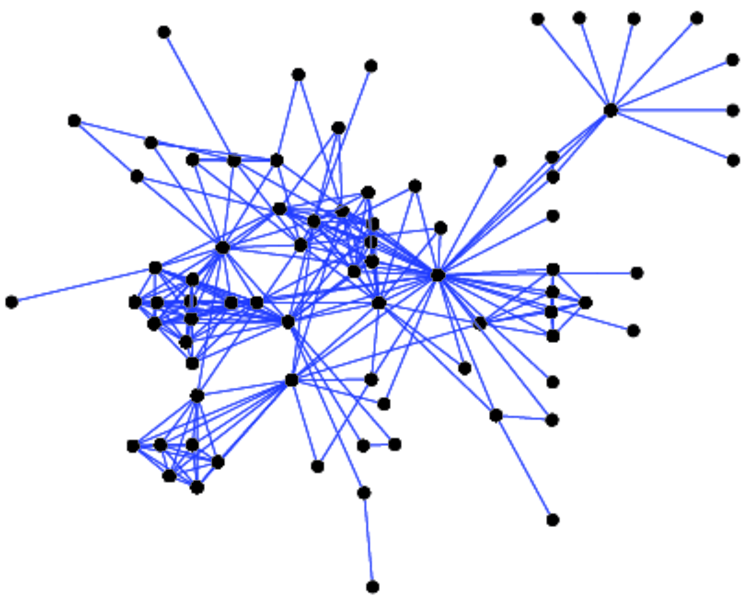
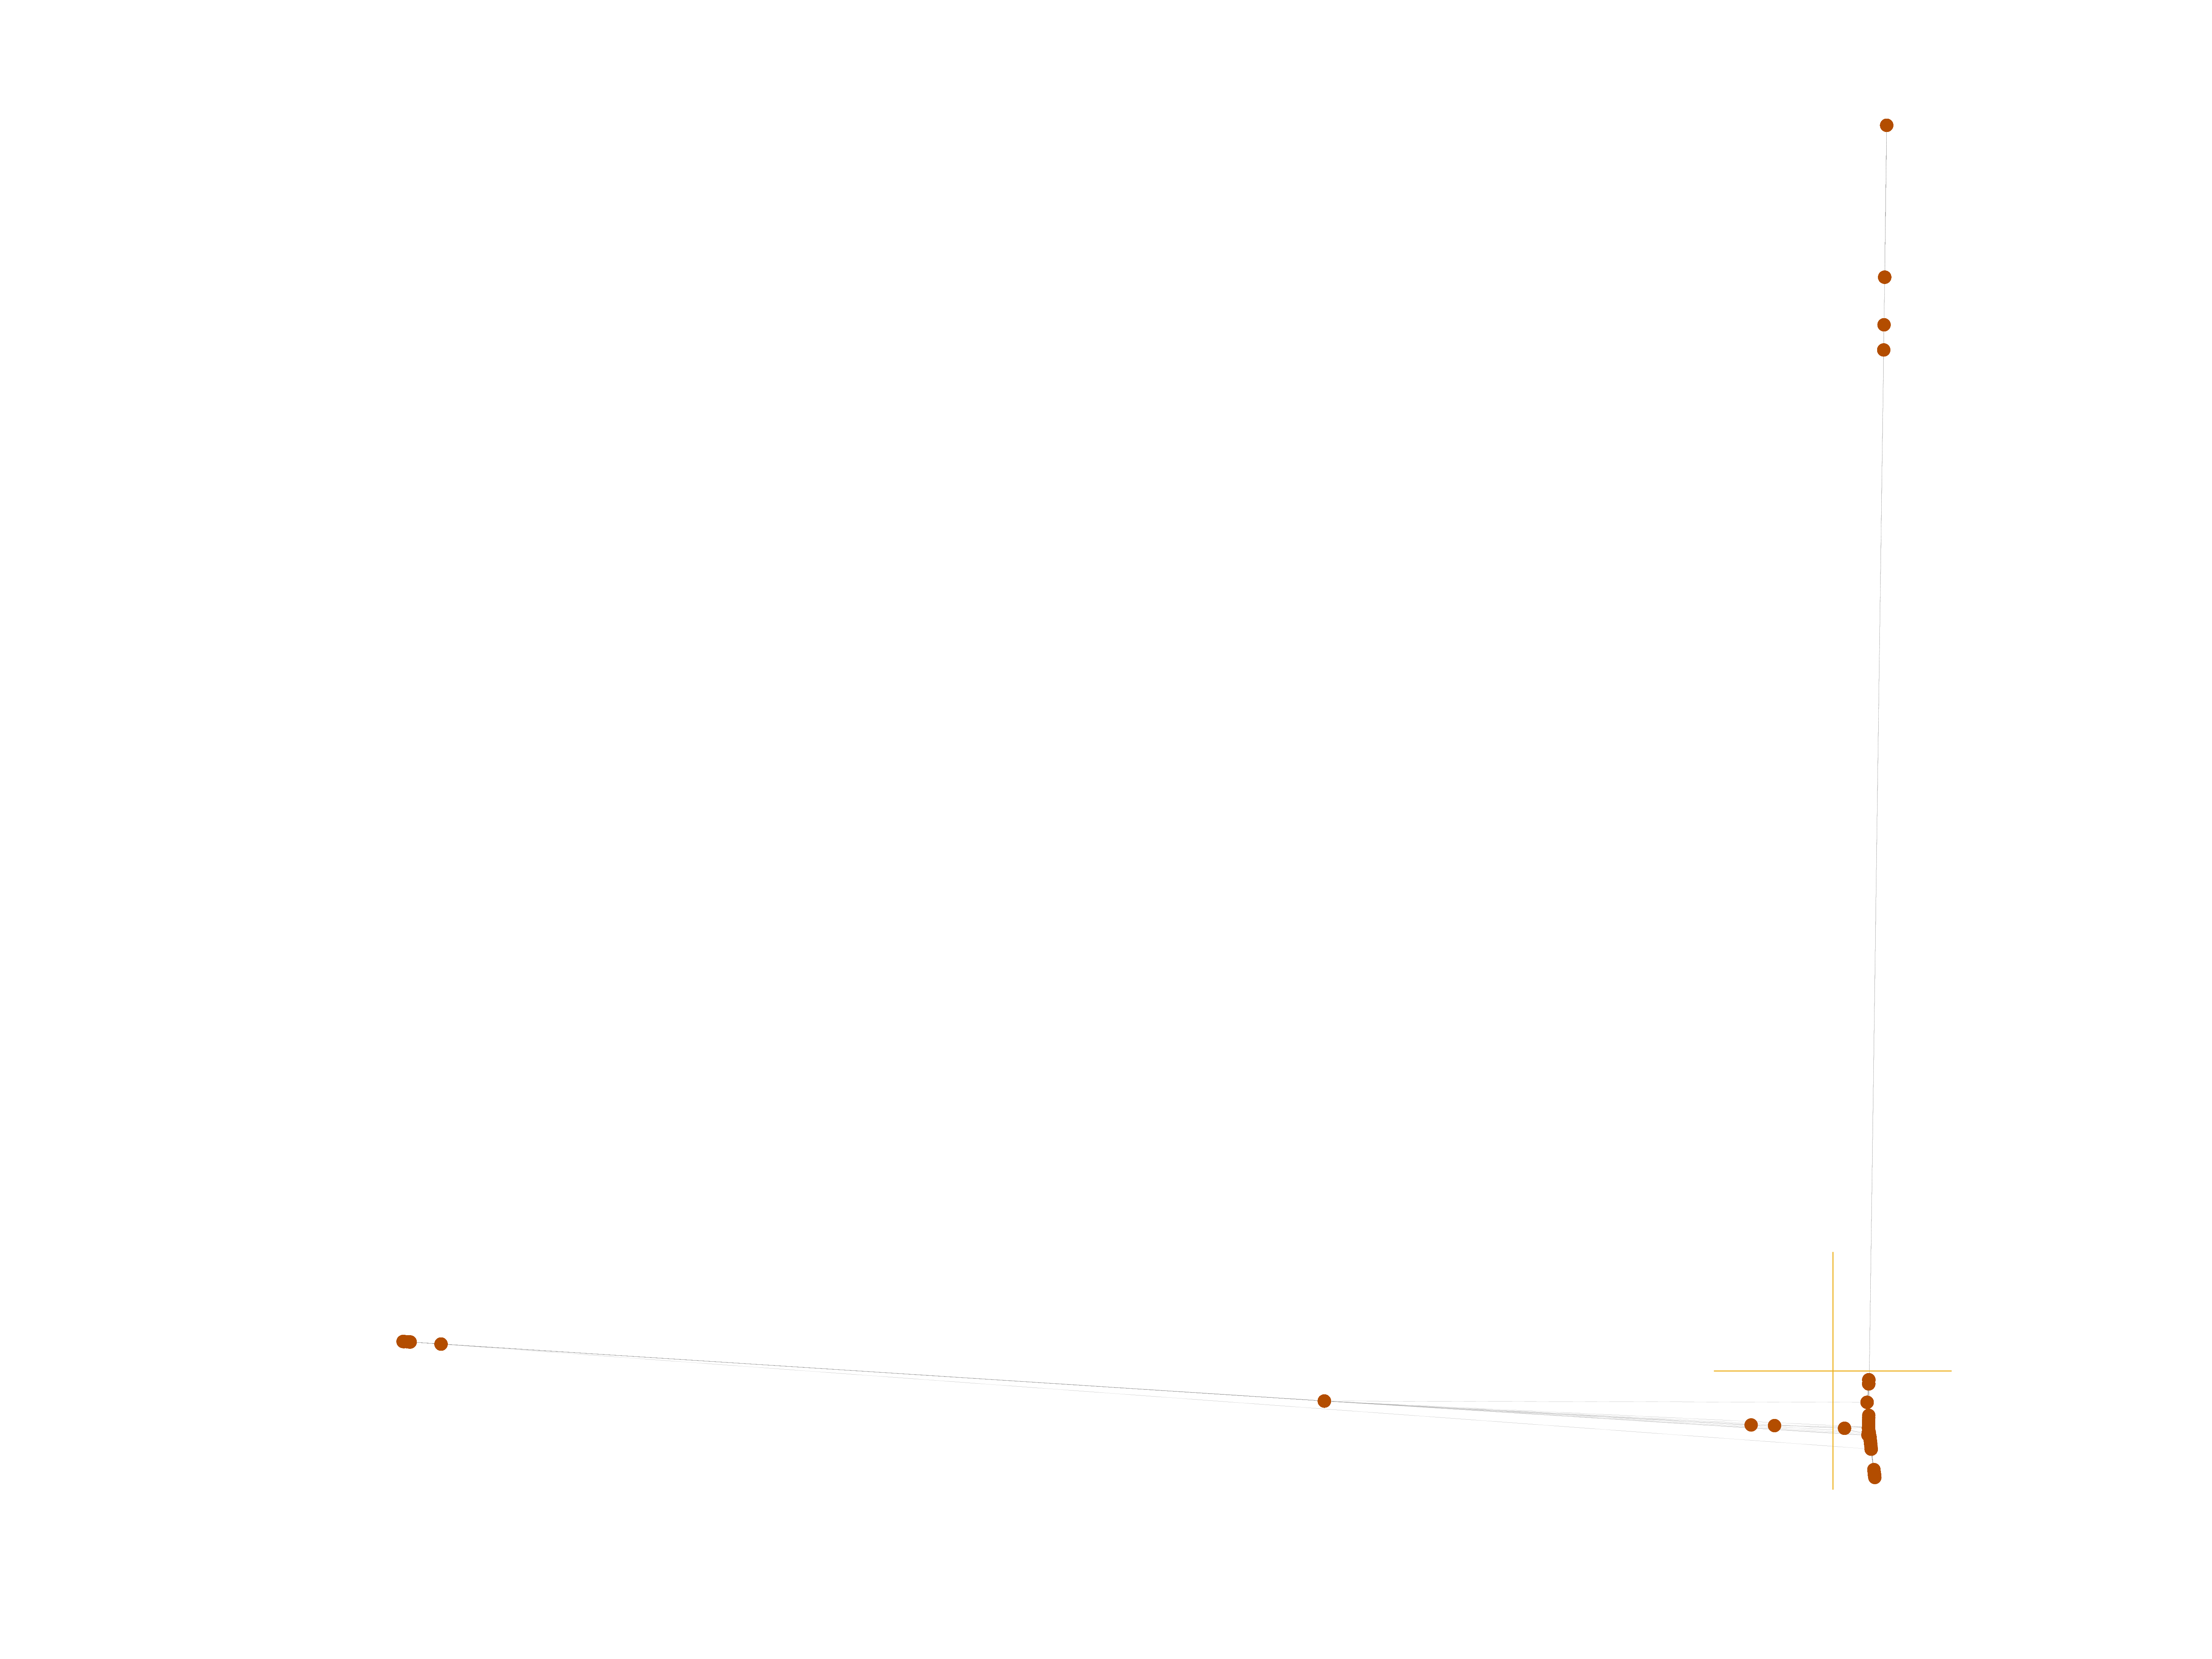
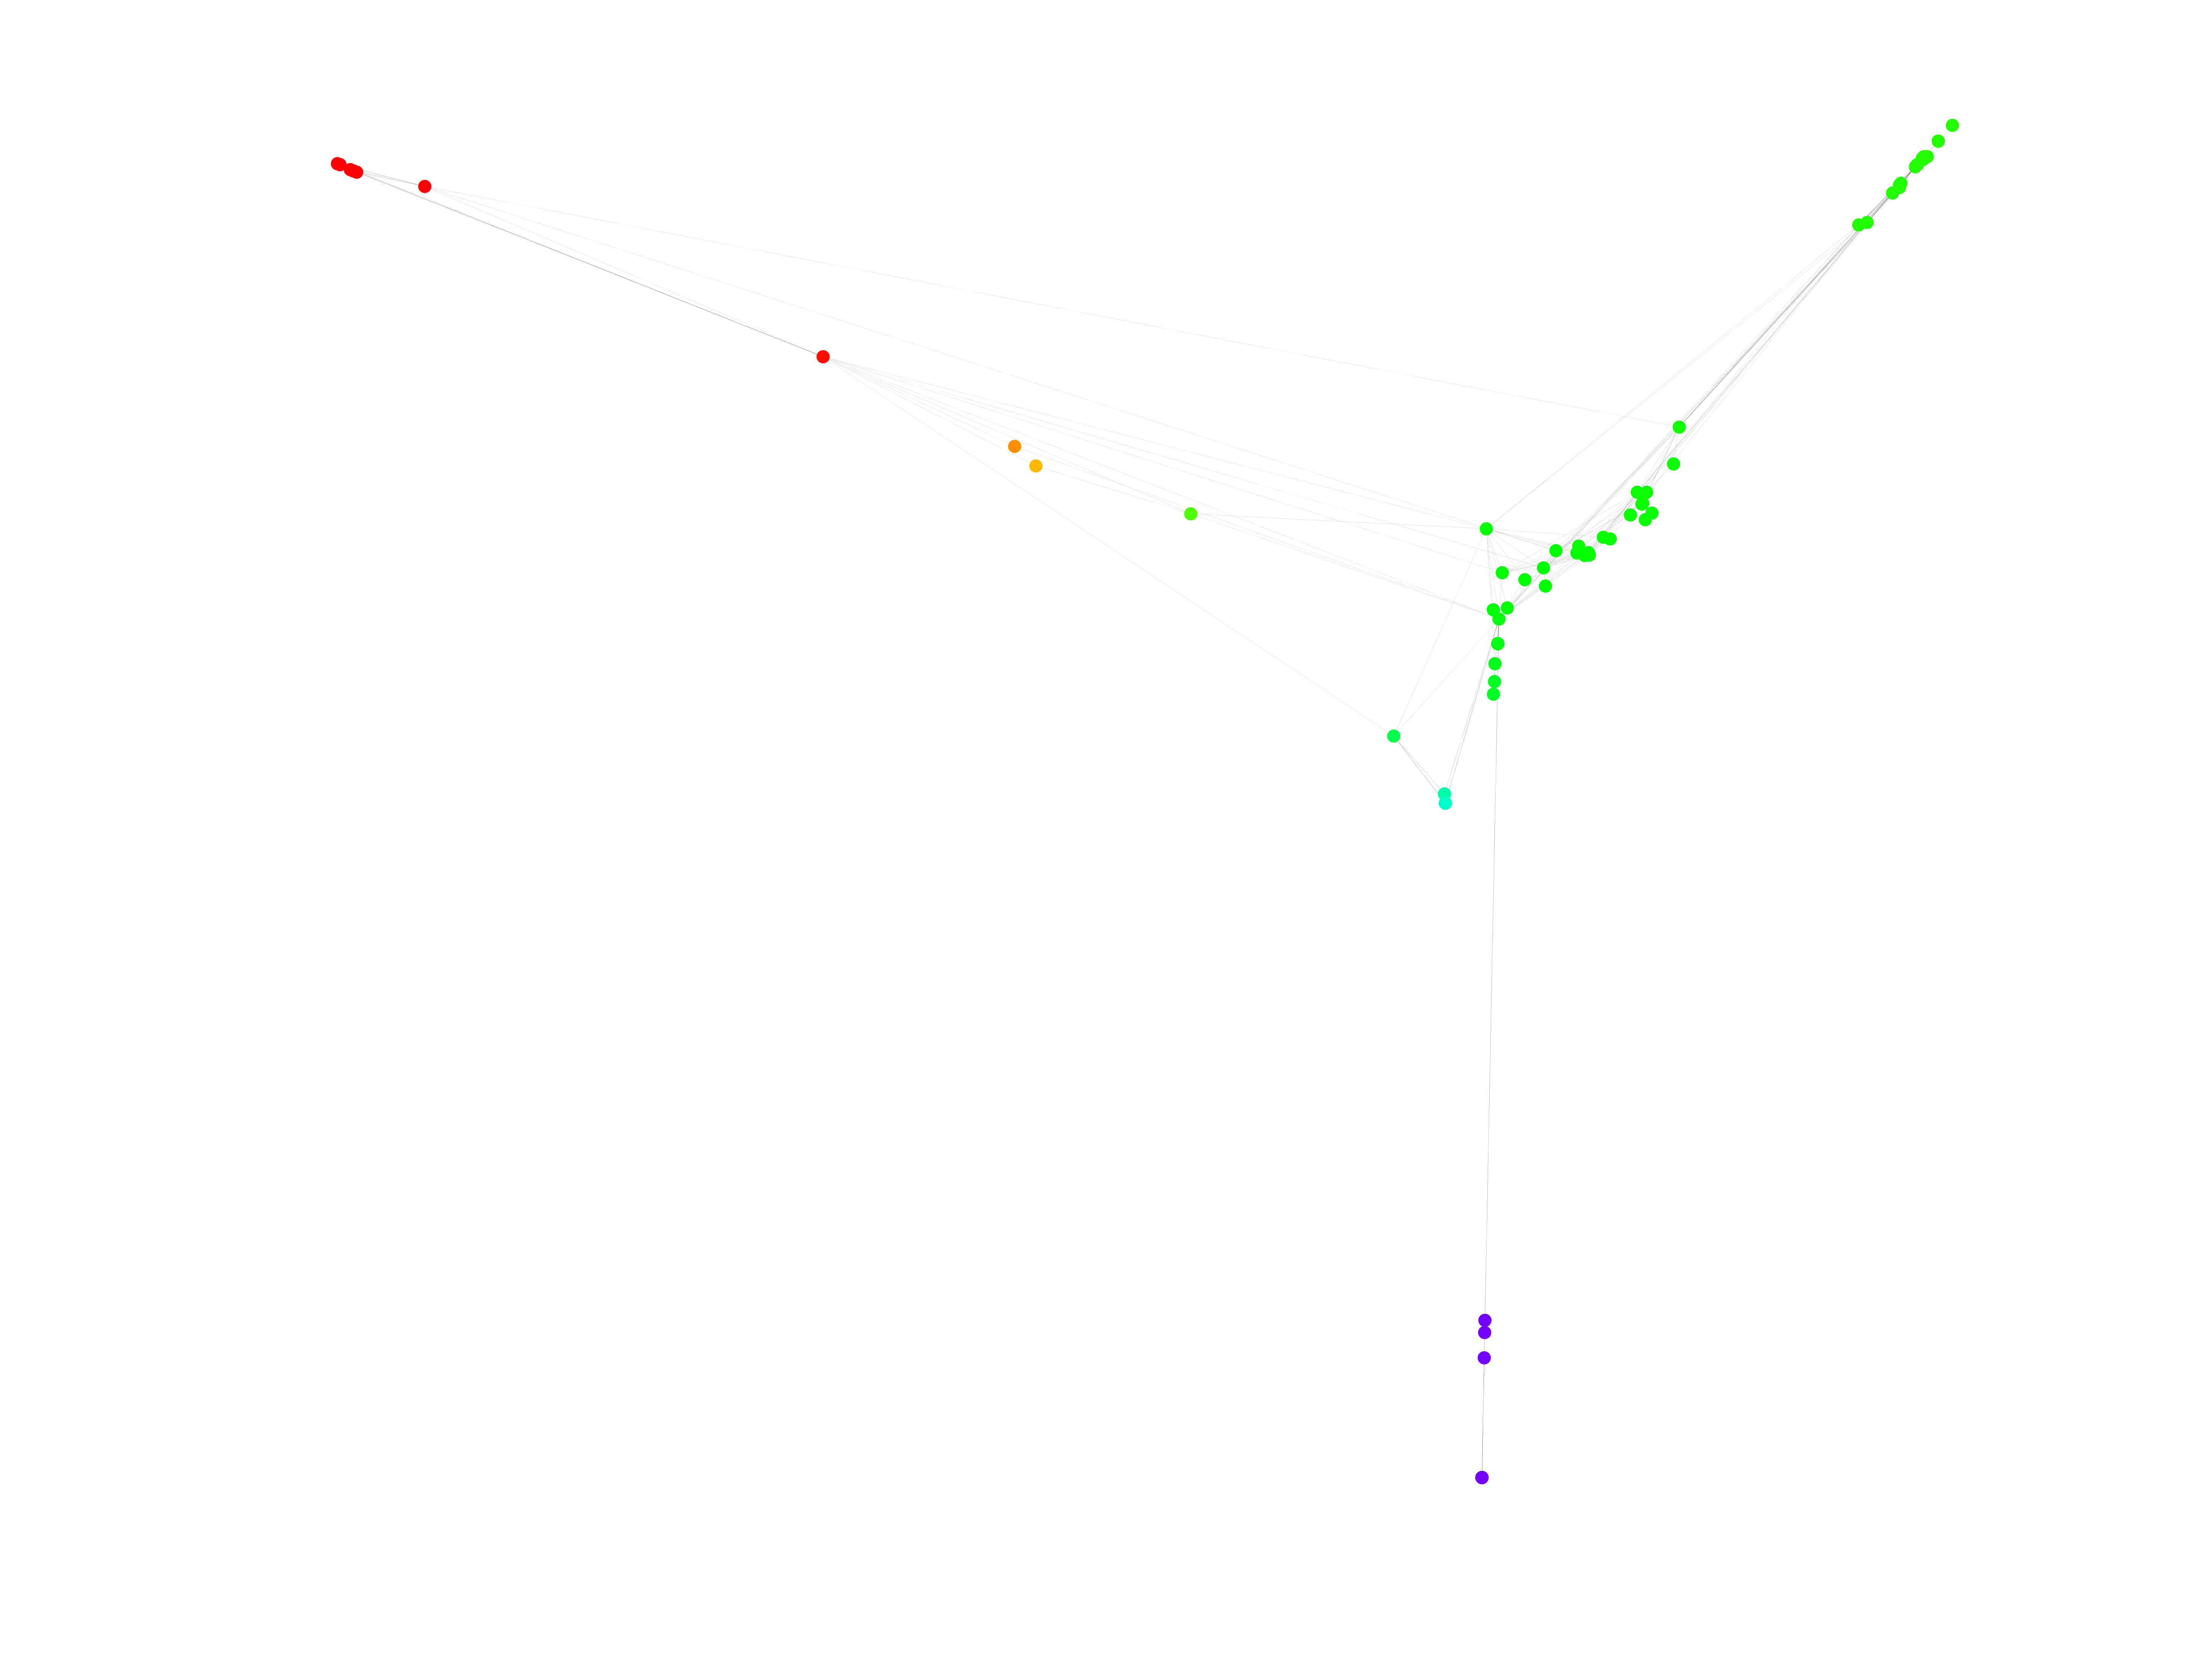
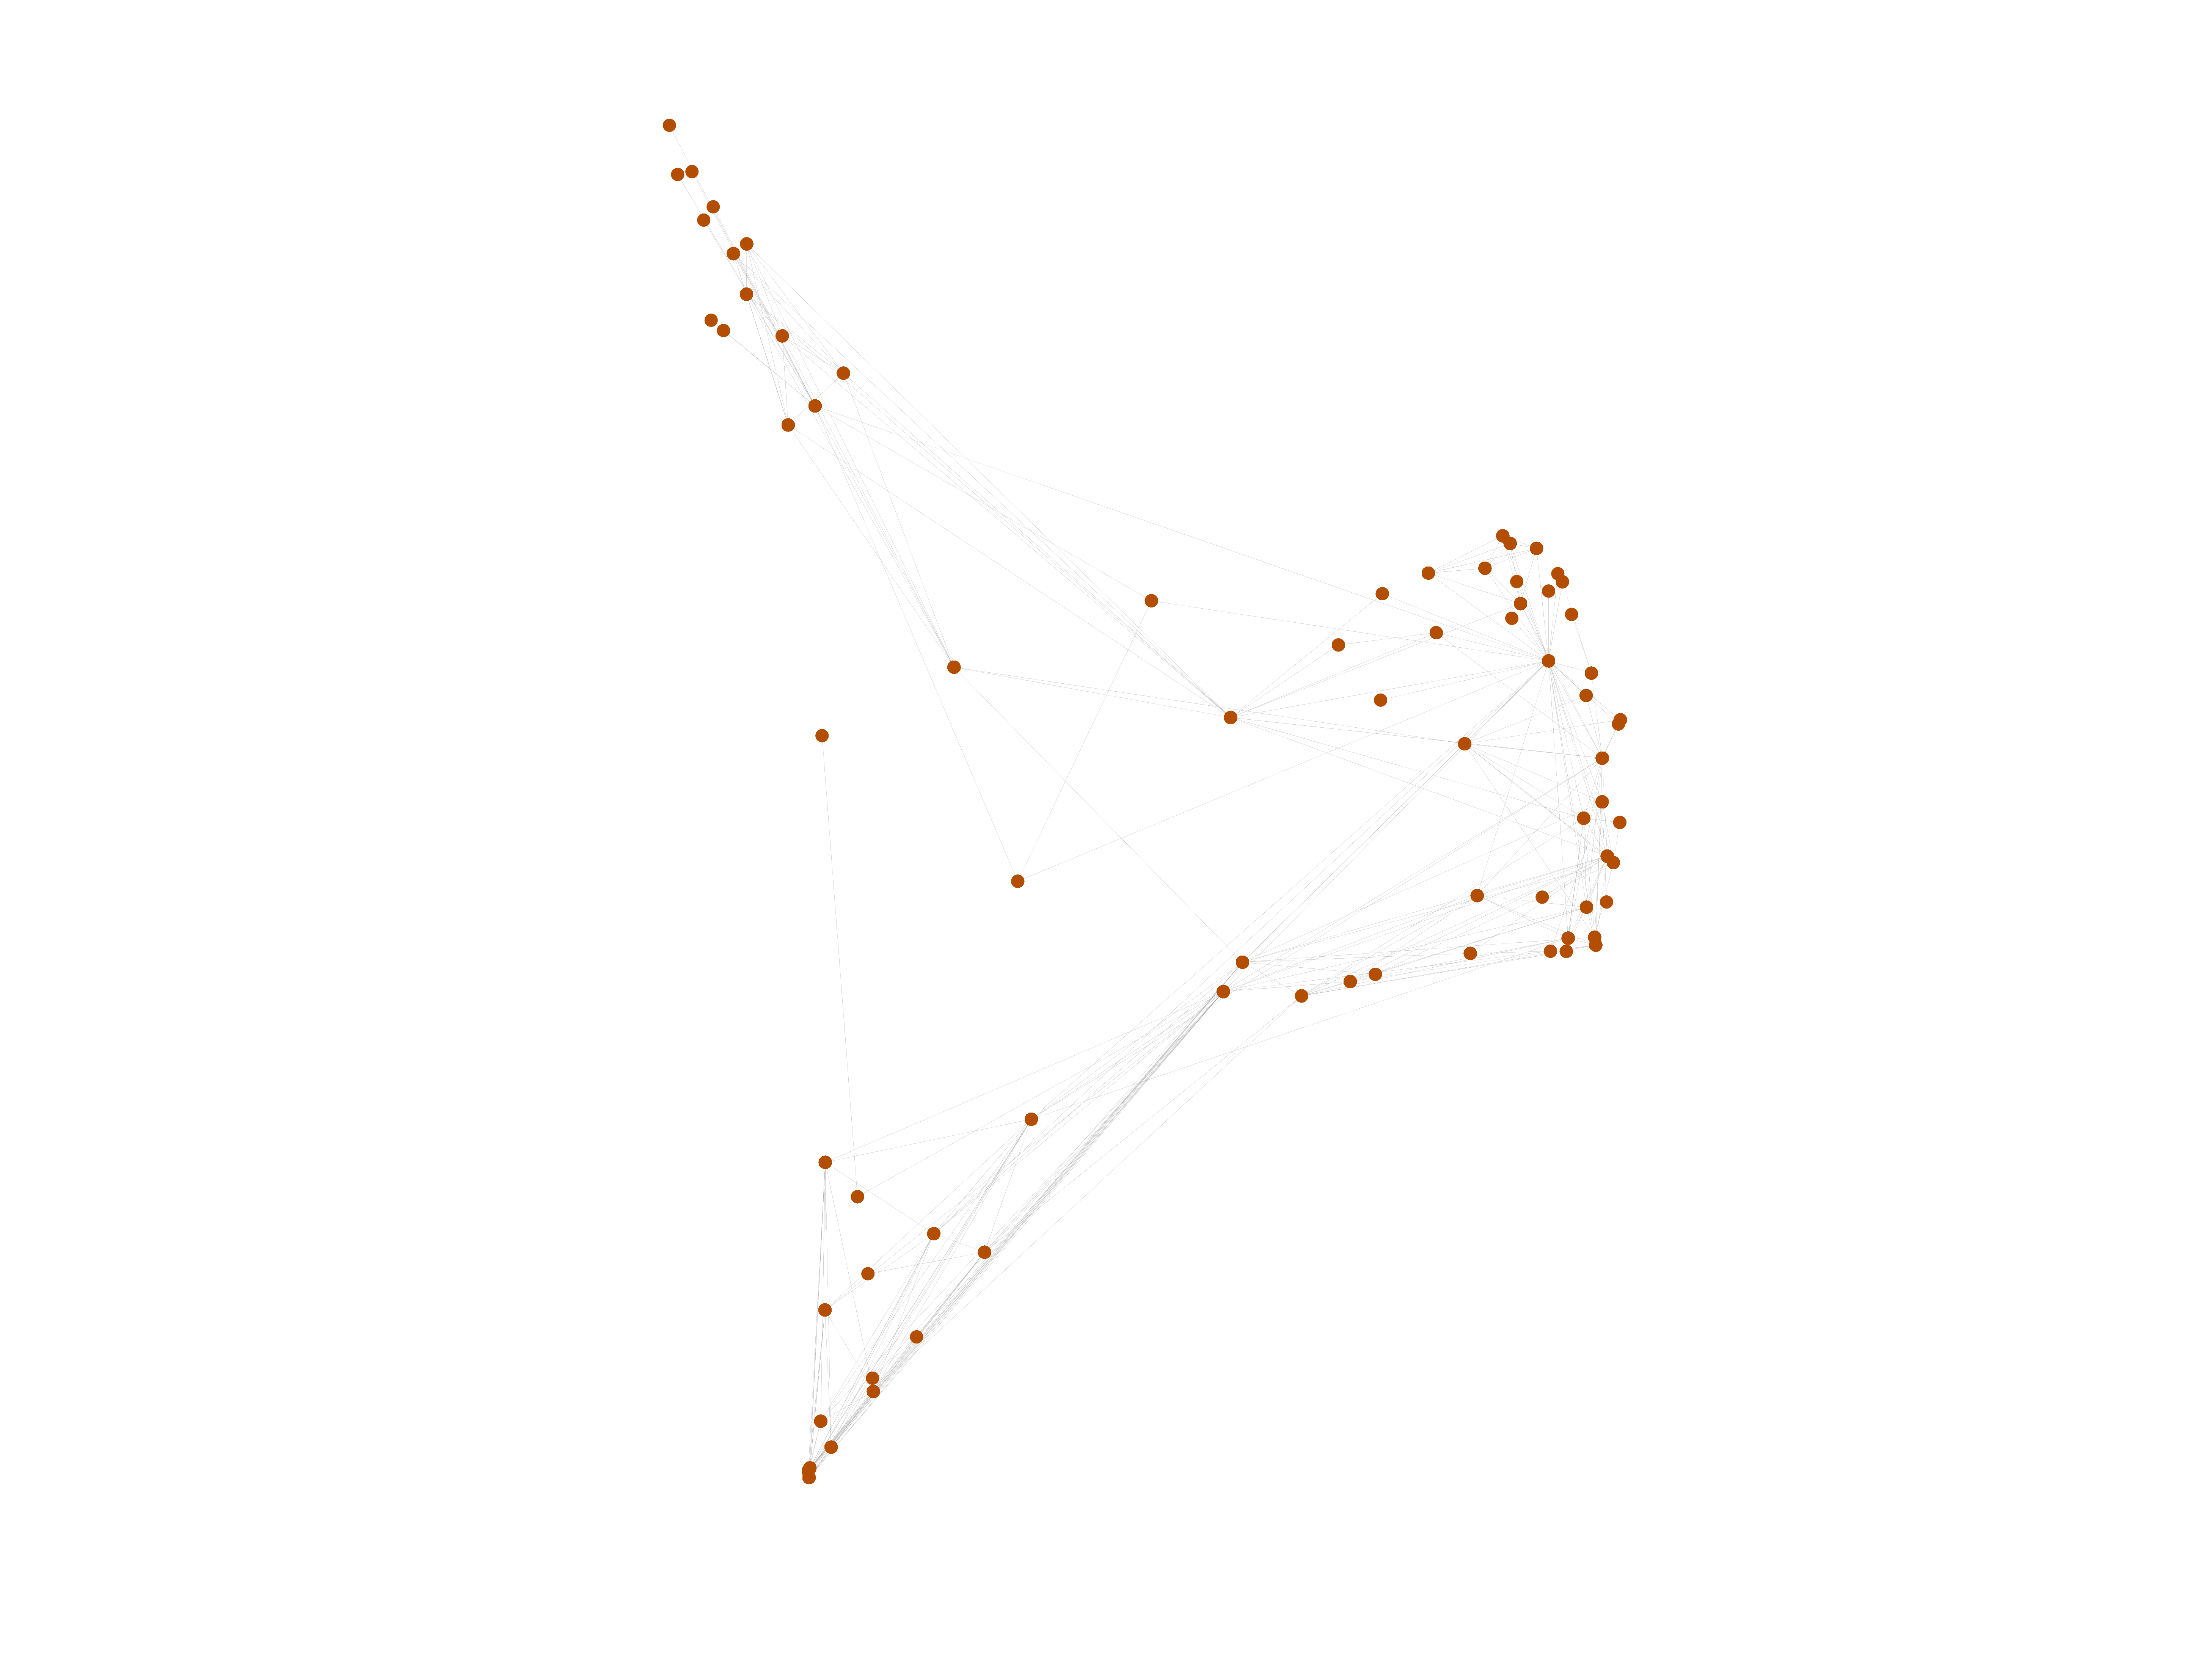
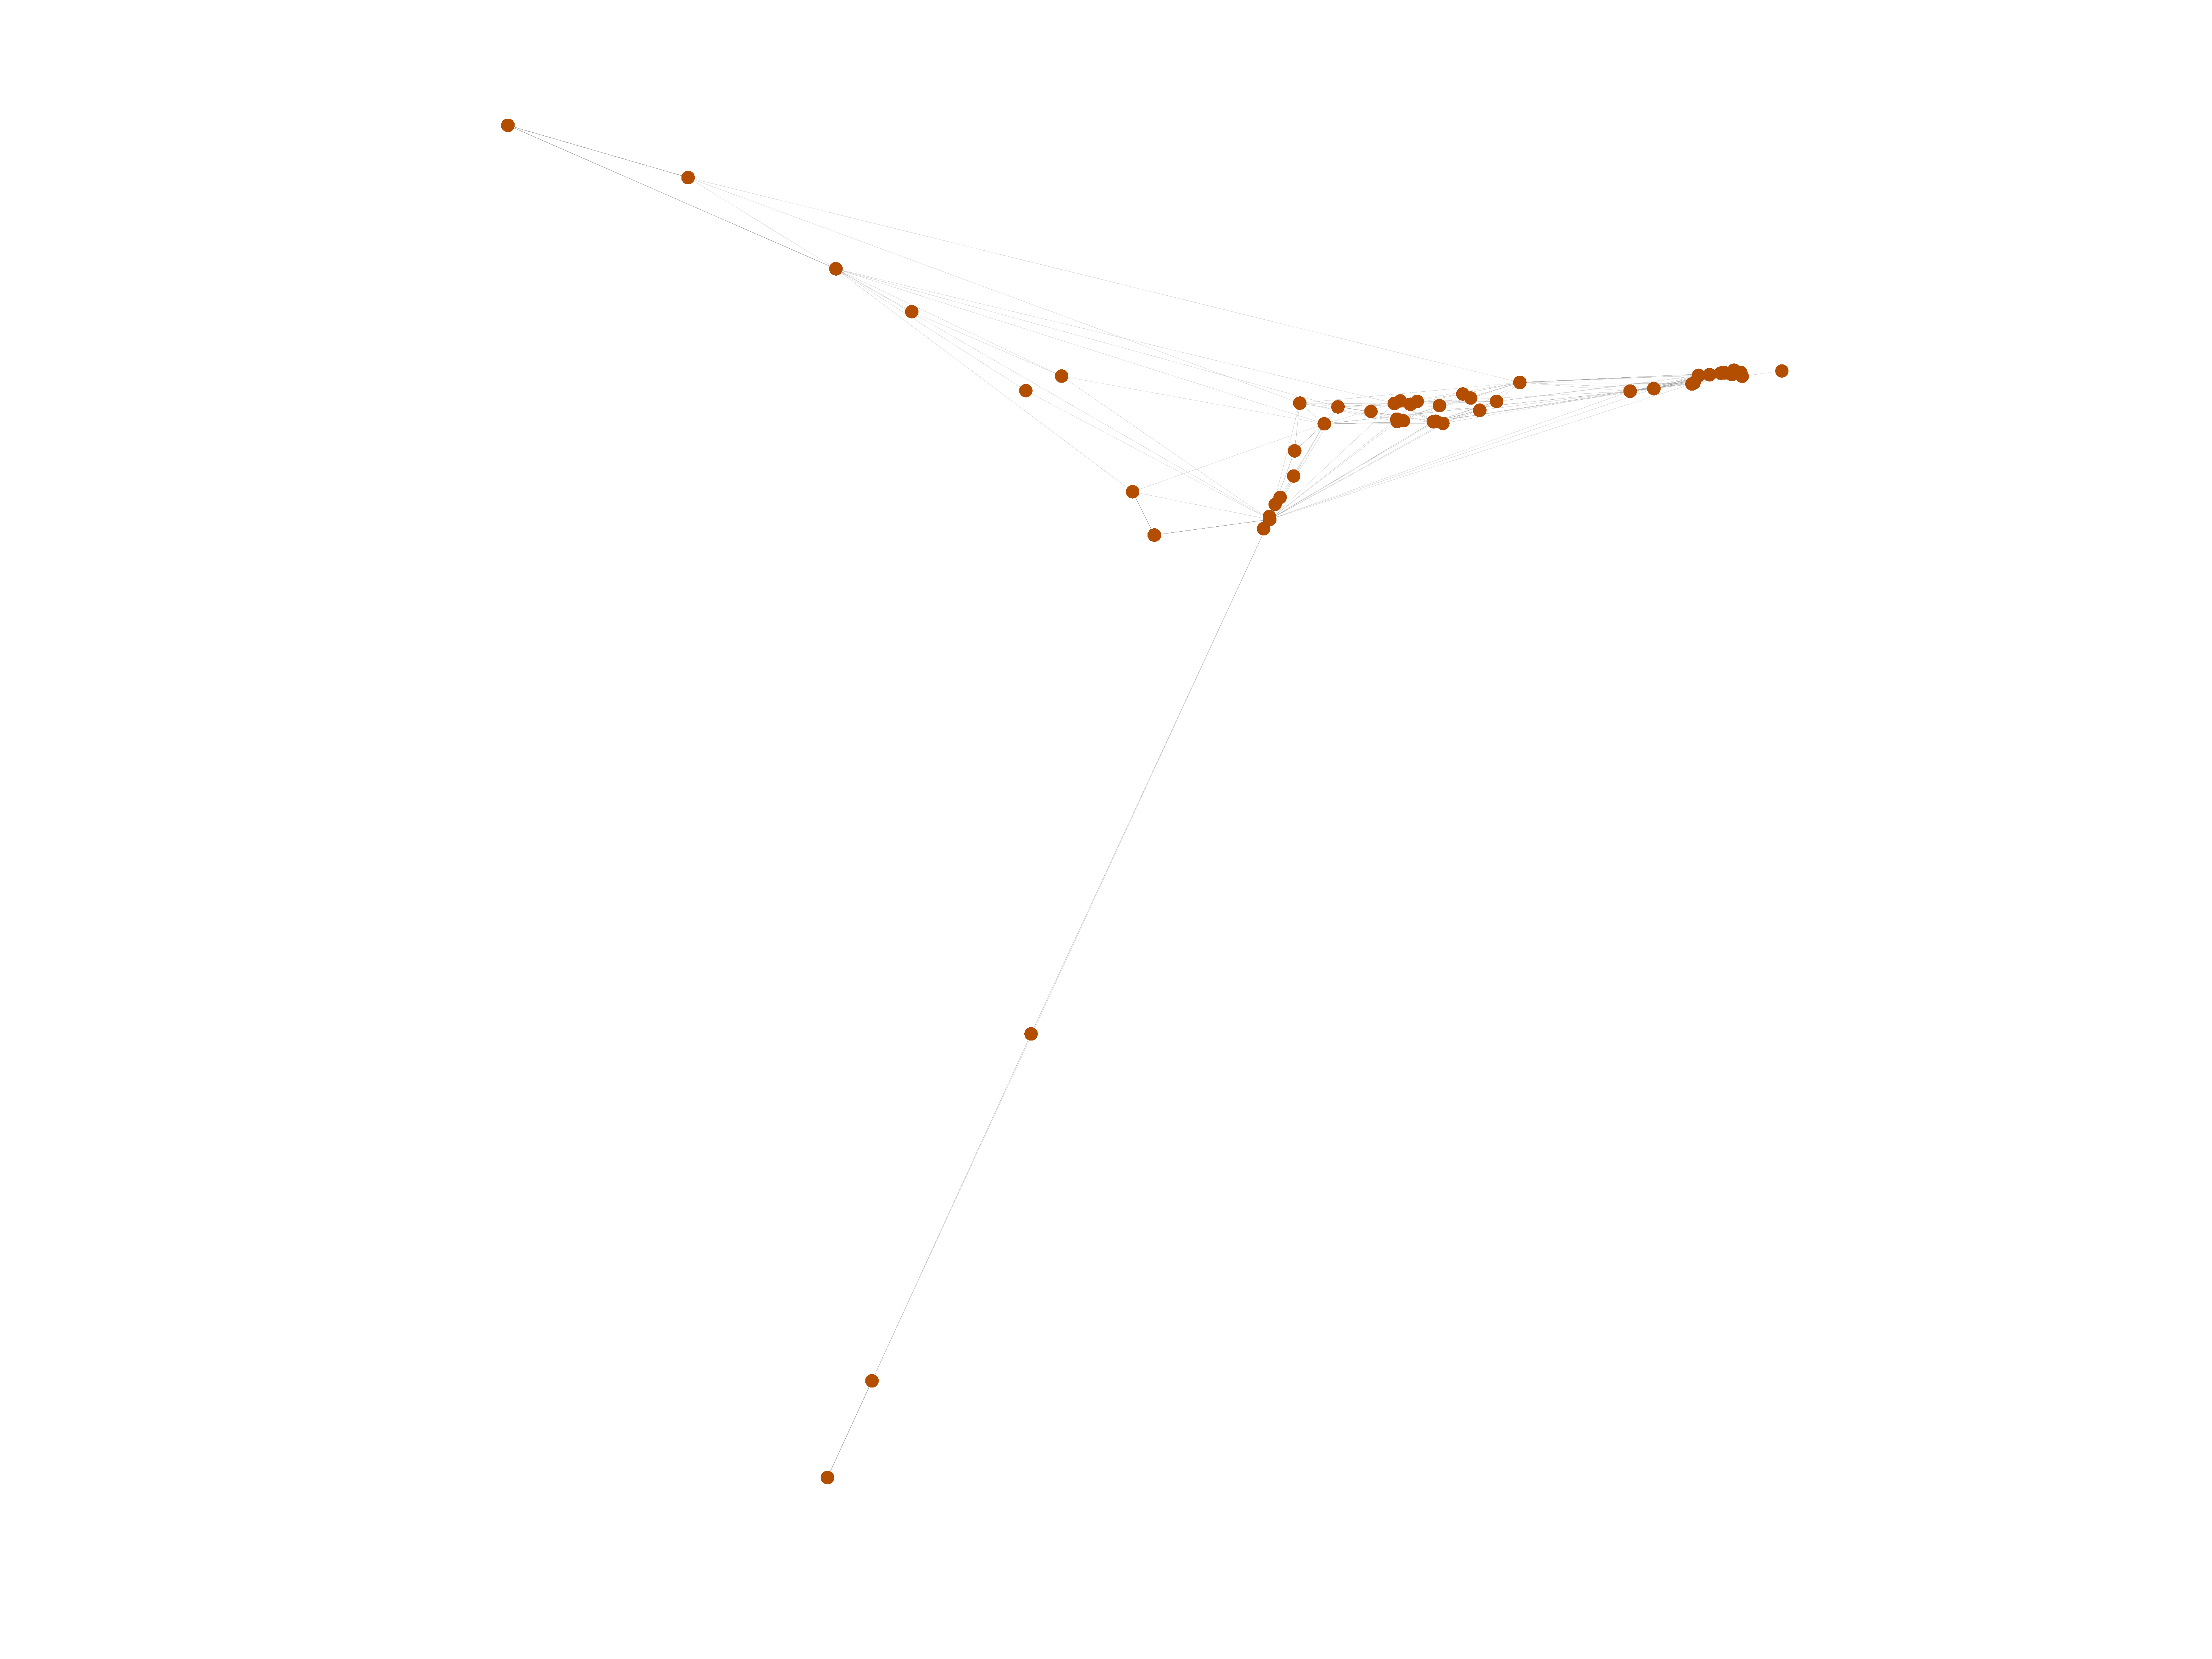
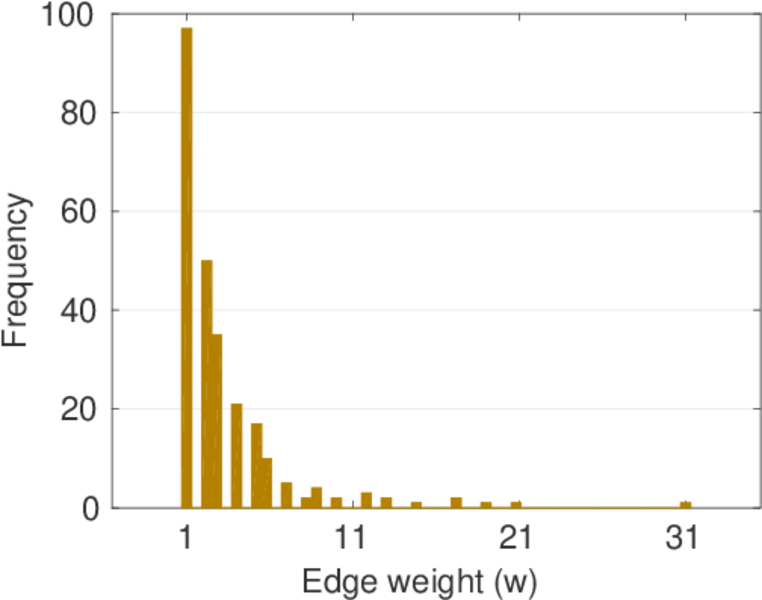
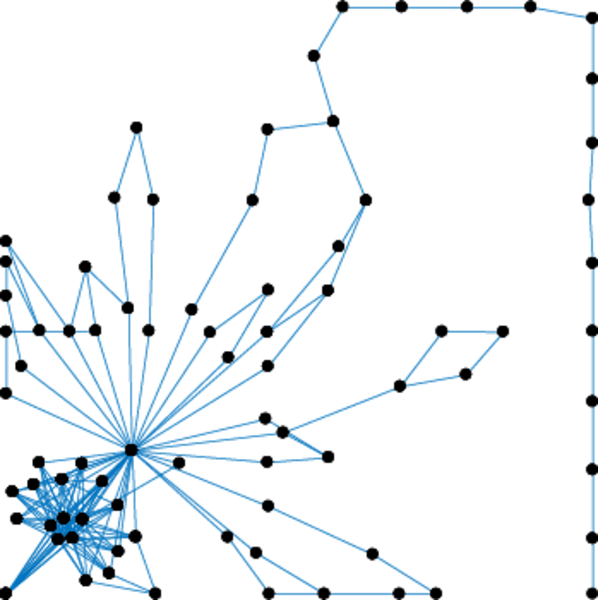
This undirected network contains co-occurances of characters in Victor Hugo's novel 'Les Misérables'. A node represents a character and an edge between two nodes shows that these two characters appeared in the same chapter of the the book. The weight of each link indicates how often such a co-appearance occured.

Metadata

CodeMl
Internal namemoreno_lesmis
NameLes Misérables
Data sourcehttp://moreno.ss.uci.edu/data.html#lesmis
AvailabilityDataset is available for download
Consistency checkDataset passed all tests
Category
Miscellaneous network
Node meaningCharacter
Edge meaningCo-occurence
Network formatUnipartite, undirected
Edge typePositive weights, no multiple edges
LoopsDoes not contain loops

Statistics

Size n =77
Volume m =254
Loop count l =0
Wedge count s =2,808
Claw count z =15,177
Cross count x =83,352
Triangle count t =467
Square count q =2,672
4-Tour count T4 =33,116
Maximum degree dmax =36
Average degree d =6.597 40
Fill p =0.086 807 9
Size of LCC N =77
Diameter δ =5
50-Percentile effective diameter δ0.5 =2.172 05
90-Percentile effective diameter δ0.9 =3.395 10
Median distance δM =3
Mean distance δm =2.635 58
Gini coefficient G =0.461 039
Balanced inequality ratio P =0.328 740
Relative edge distribution entropy Her =0.916 522
Power law exponent γ =1.691 13
Tail power law exponent γt =4.121 00
Tail power law exponent with p γ3 =4.121 00
p-value p =0.951 000
Degree assortativity ρ =−0.165 225
Degree assortativity p-value pρ =0.000 183 617
Clustering coefficient c =0.498 932
Spectral norm α =65.026 3
Algebraic connectivity a =0.554 360
Spectral separation 1[A] / λ2[A]| =1.333 38
Non-bipartivity bA =0.561 283
Normalized non-bipartivity bN =0.134 561
Algebraic non-bipartivity χ =0.240 638
Spectral bipartite frustration bK =0.009 118 68
Controllability C =15
Relative controllability Cr =0.194 805

Plots

Fruchterman–Reingold graph drawing

Degree distribution

Cumulative degree distribution

Lorenz curve

Spectral distribution of the adjacency matrix

Spectral distribution of the normalized adjacency matrix

Spectral distribution of the Laplacian

Spectral graph drawing based on the adjacency matrix

Spectral graph drawing based on the Laplacian

Spectral graph drawing based on the normalized adjacency matrix

Degree assortativity

Zipf plot

Hop distribution

Double Laplacian graph drawing

Delaunay graph drawing

Edge weight/multiplicity distribution

Clustering coefficient distribution

Average neighbor degree distribution

SynGraphy

Matrix decompositions plots

Downloads

References

[1] Jérôme Kunegis. KONECT – The Koblenz Network Collection. In Proc. Int. Conf. on World Wide Web Companion, pages 1343–1350, 2013. [ http ]
[2] Donald Ervin Knuth. The Stanford GraphBase: A Platform for Combinatorial Computing, volume 37. Addison-Wesley Reading, 1993.