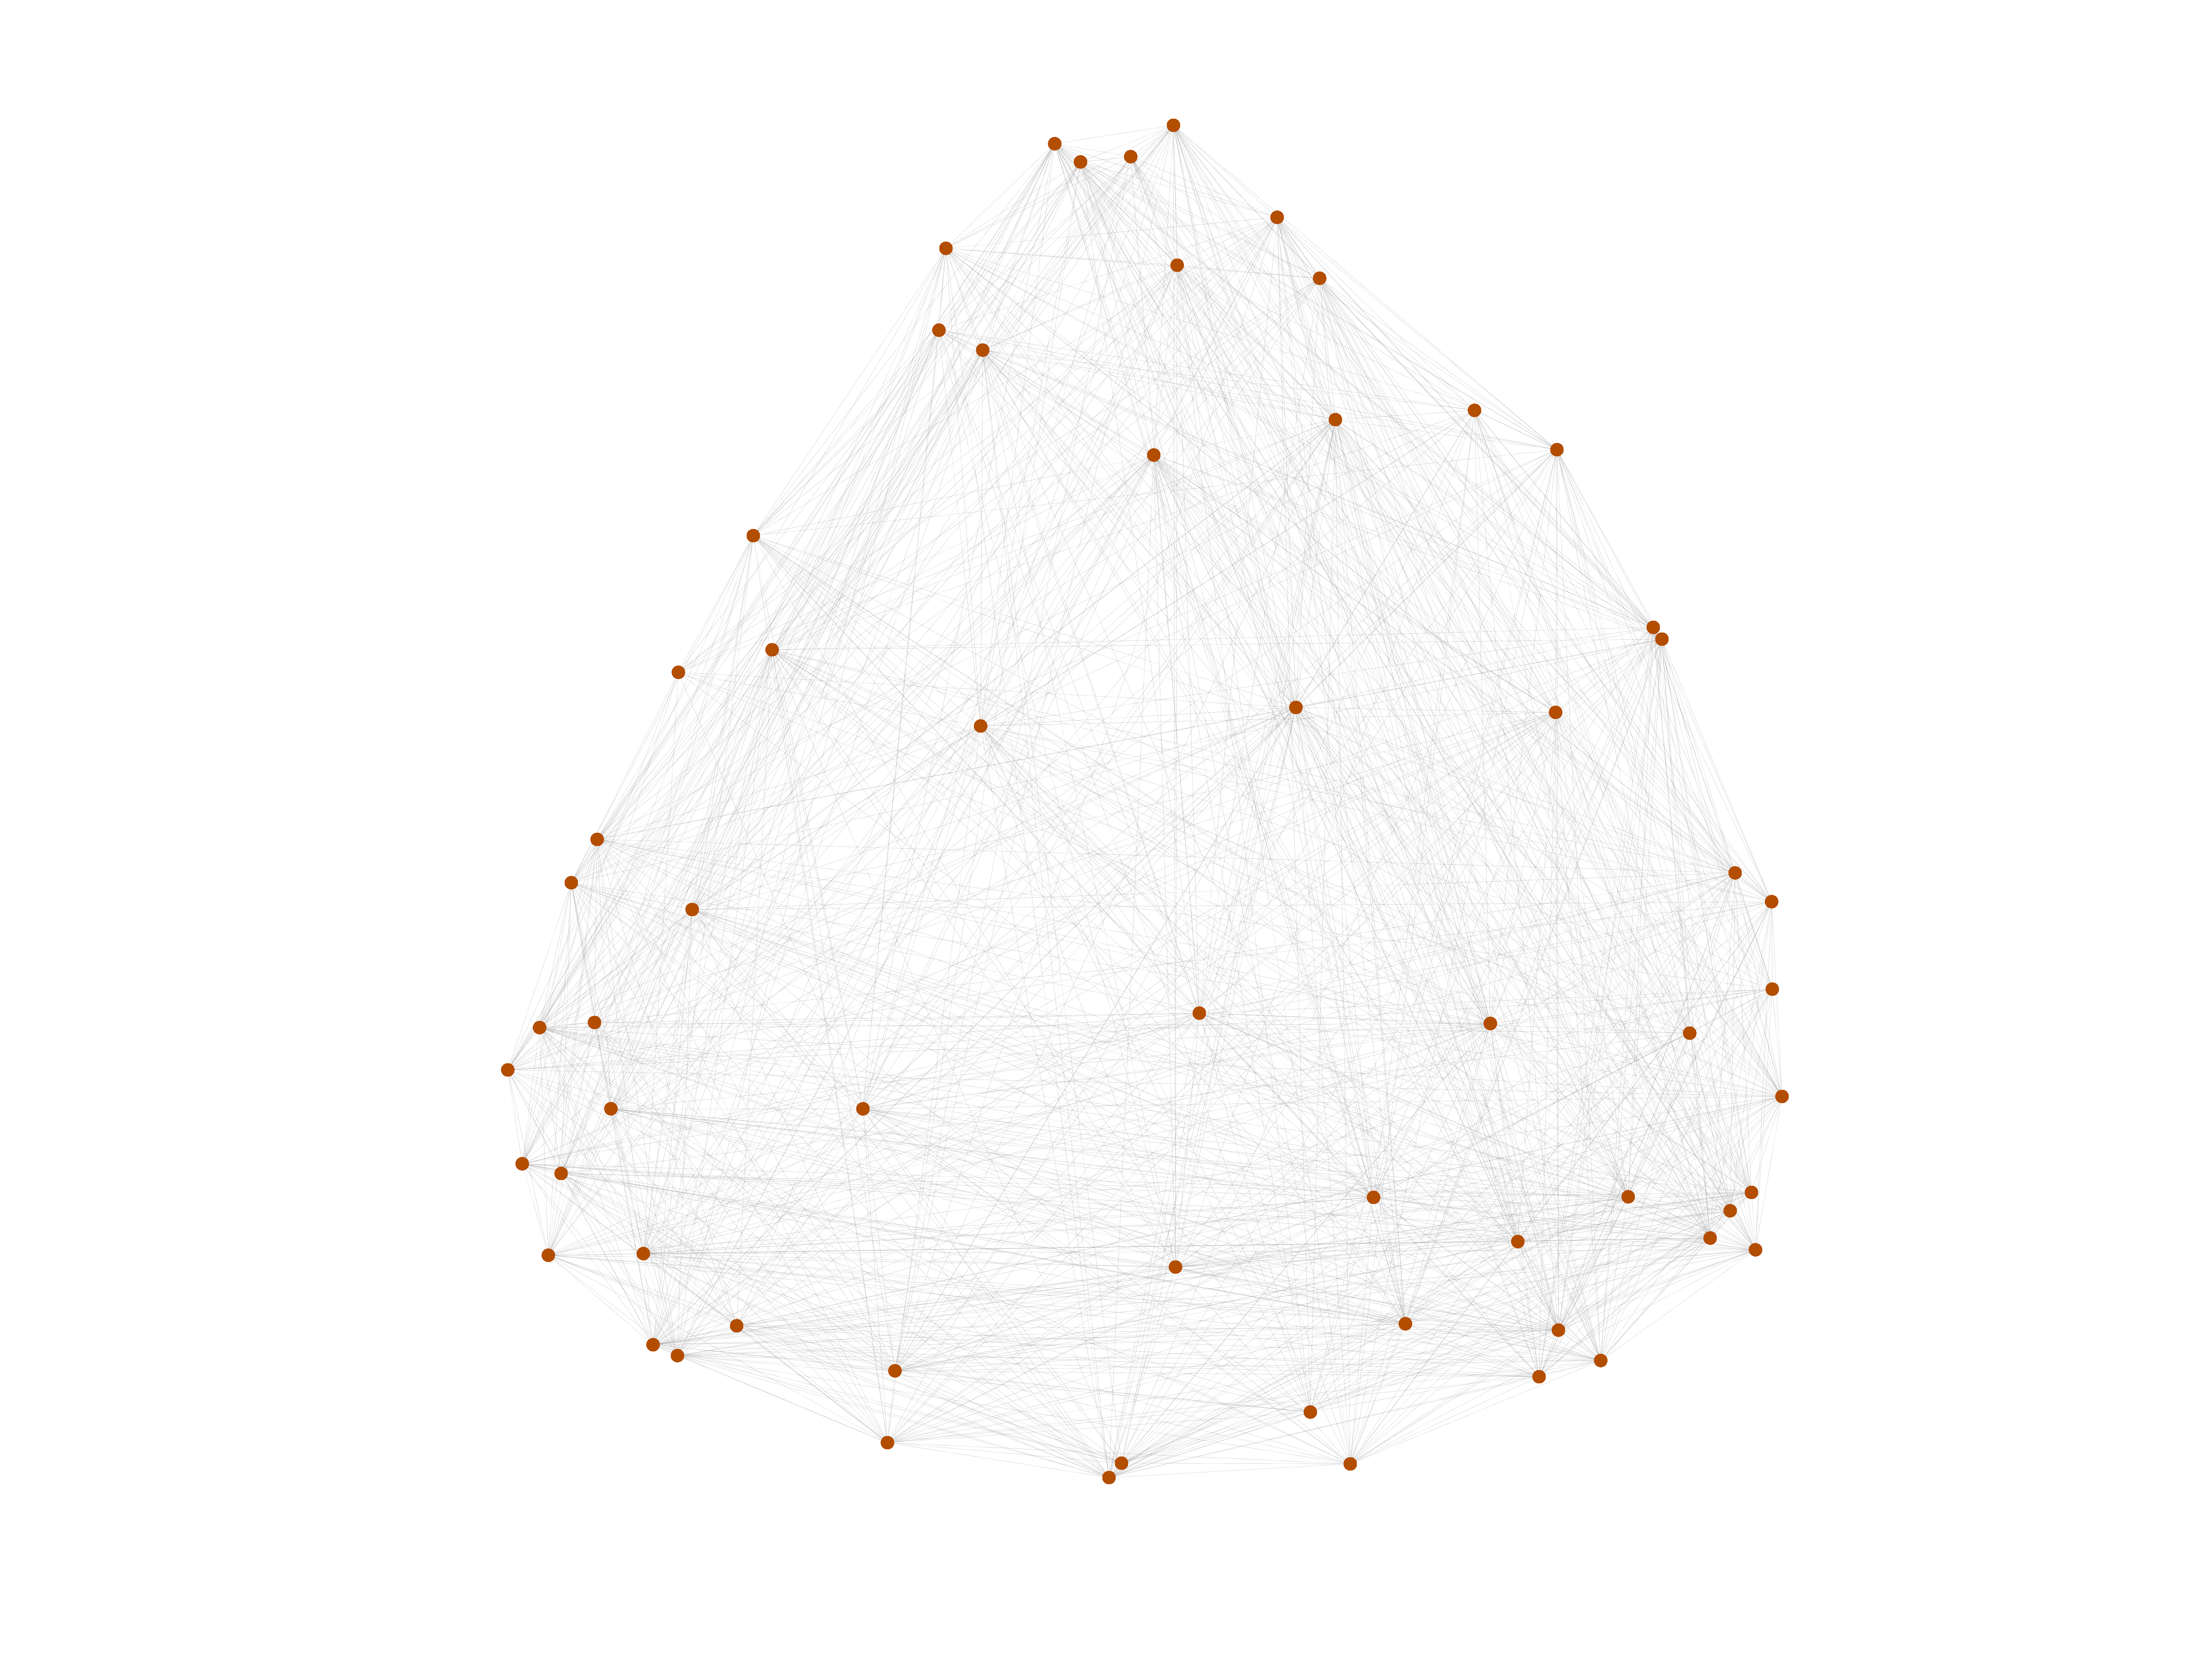
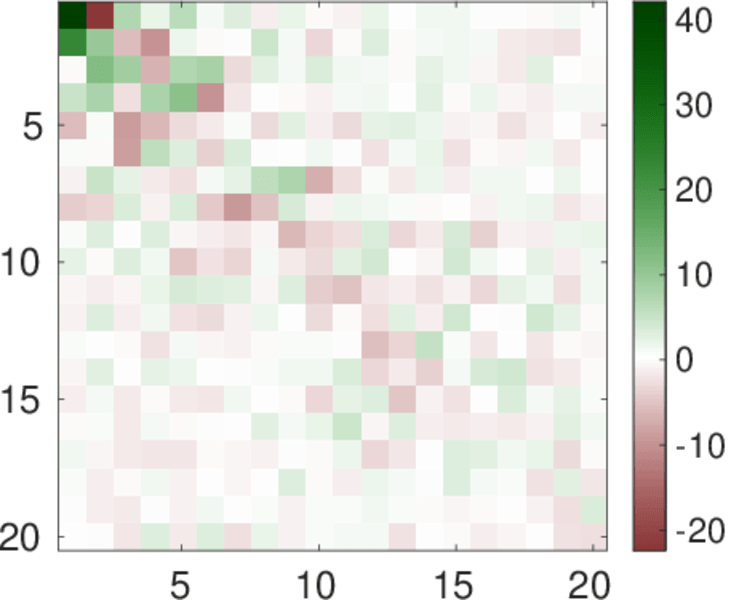
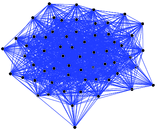
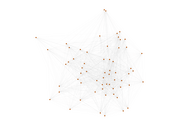
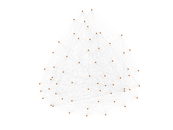
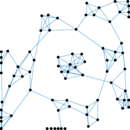
Japanese macaques
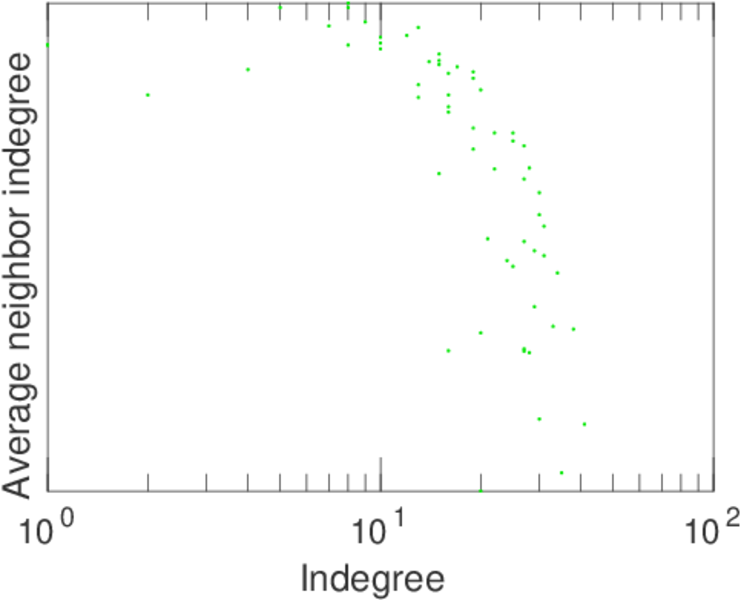
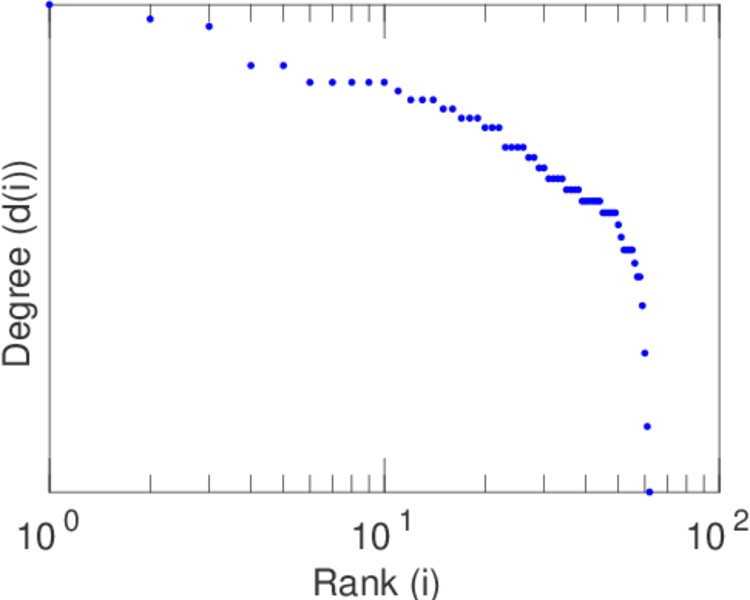
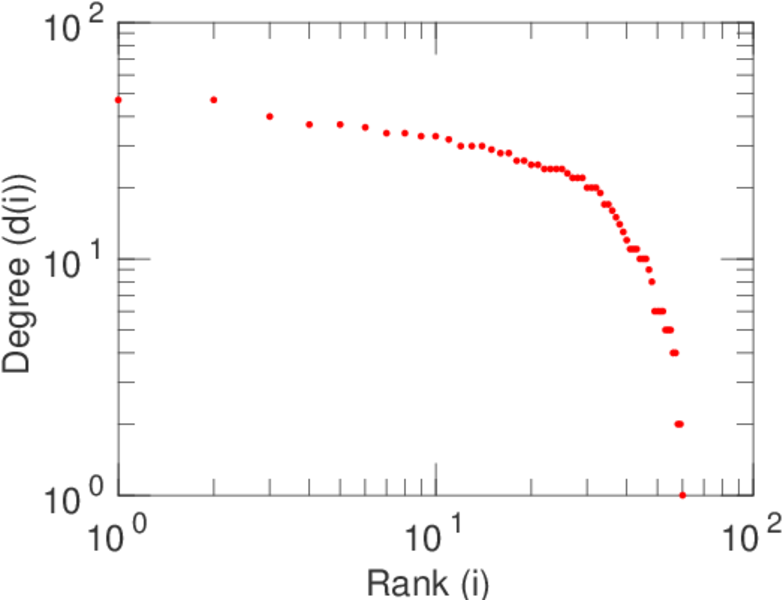
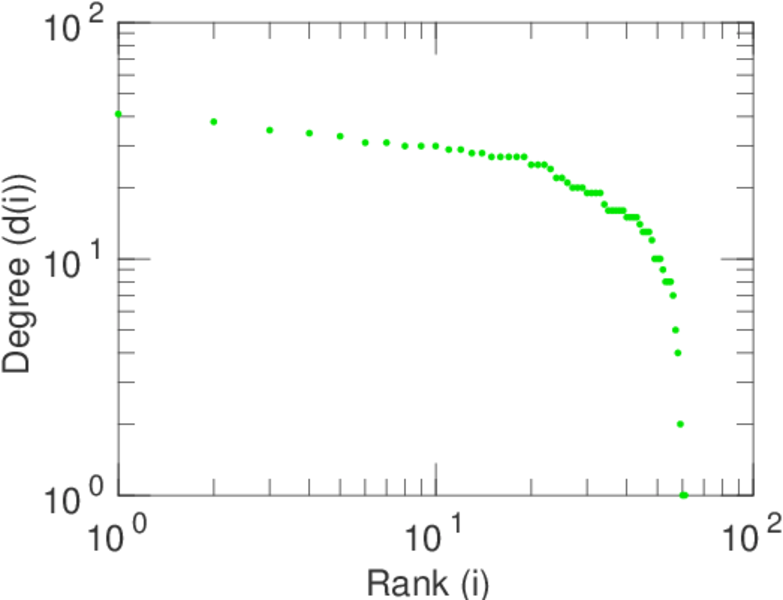
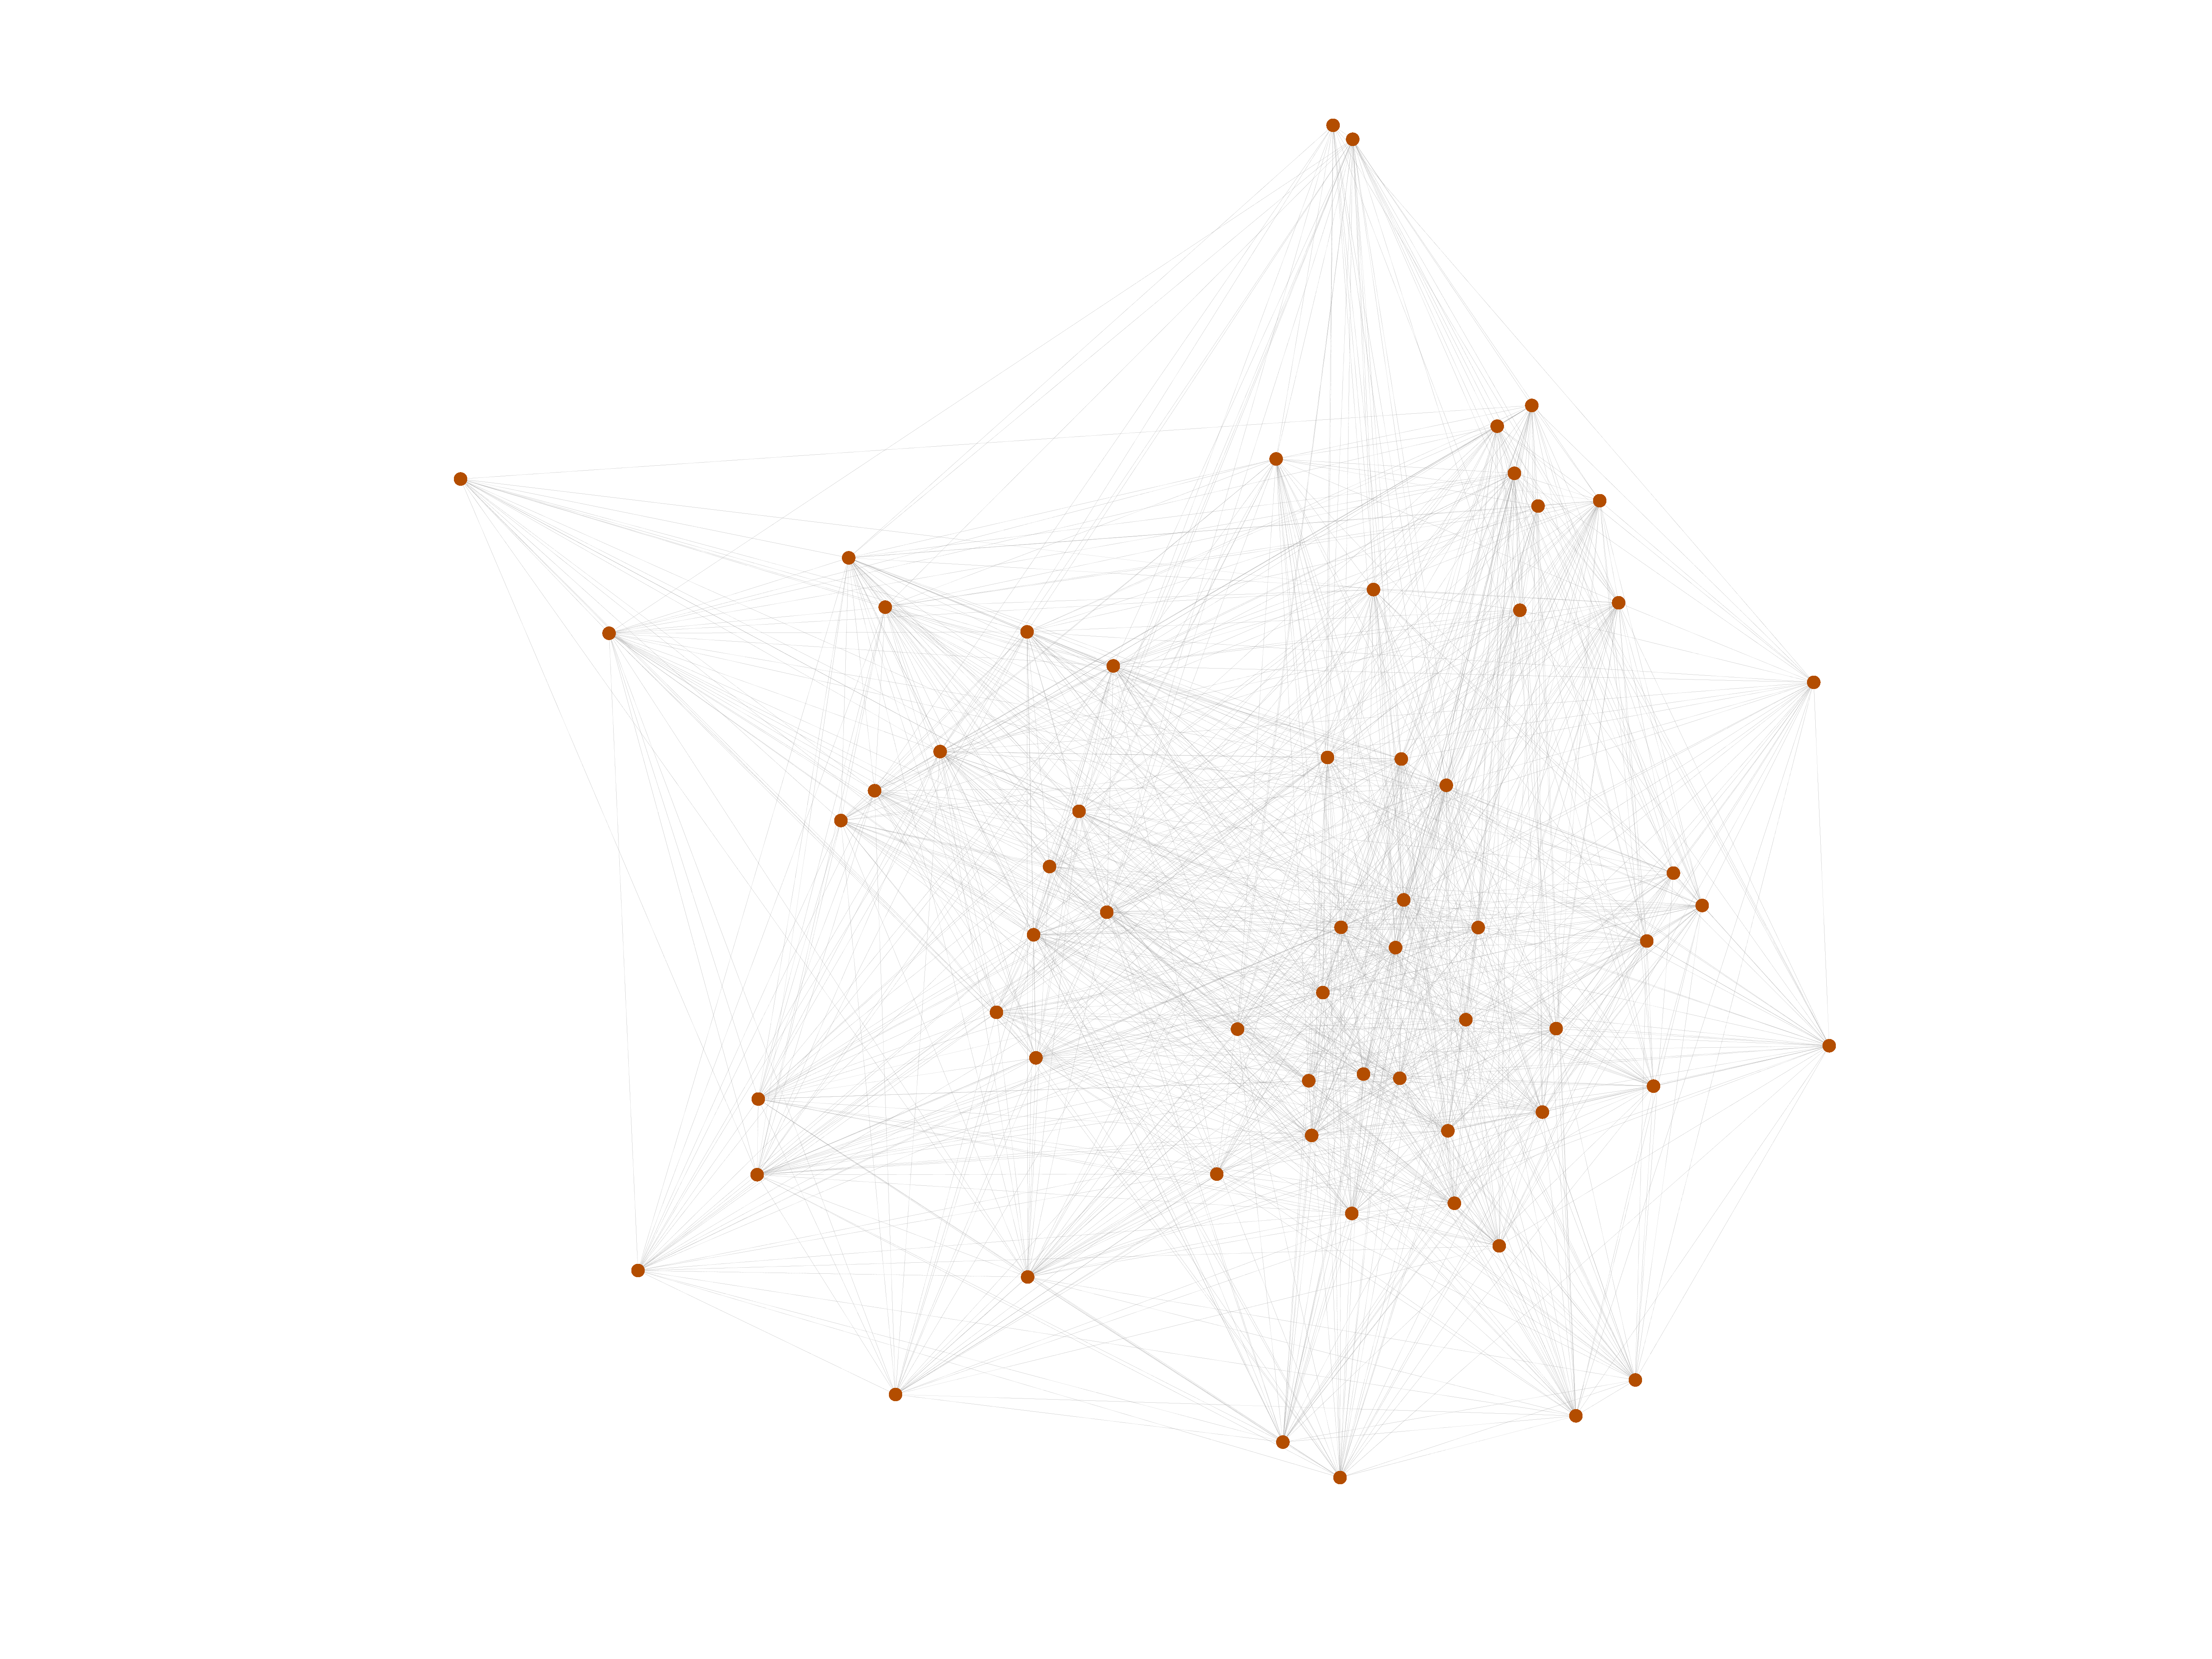
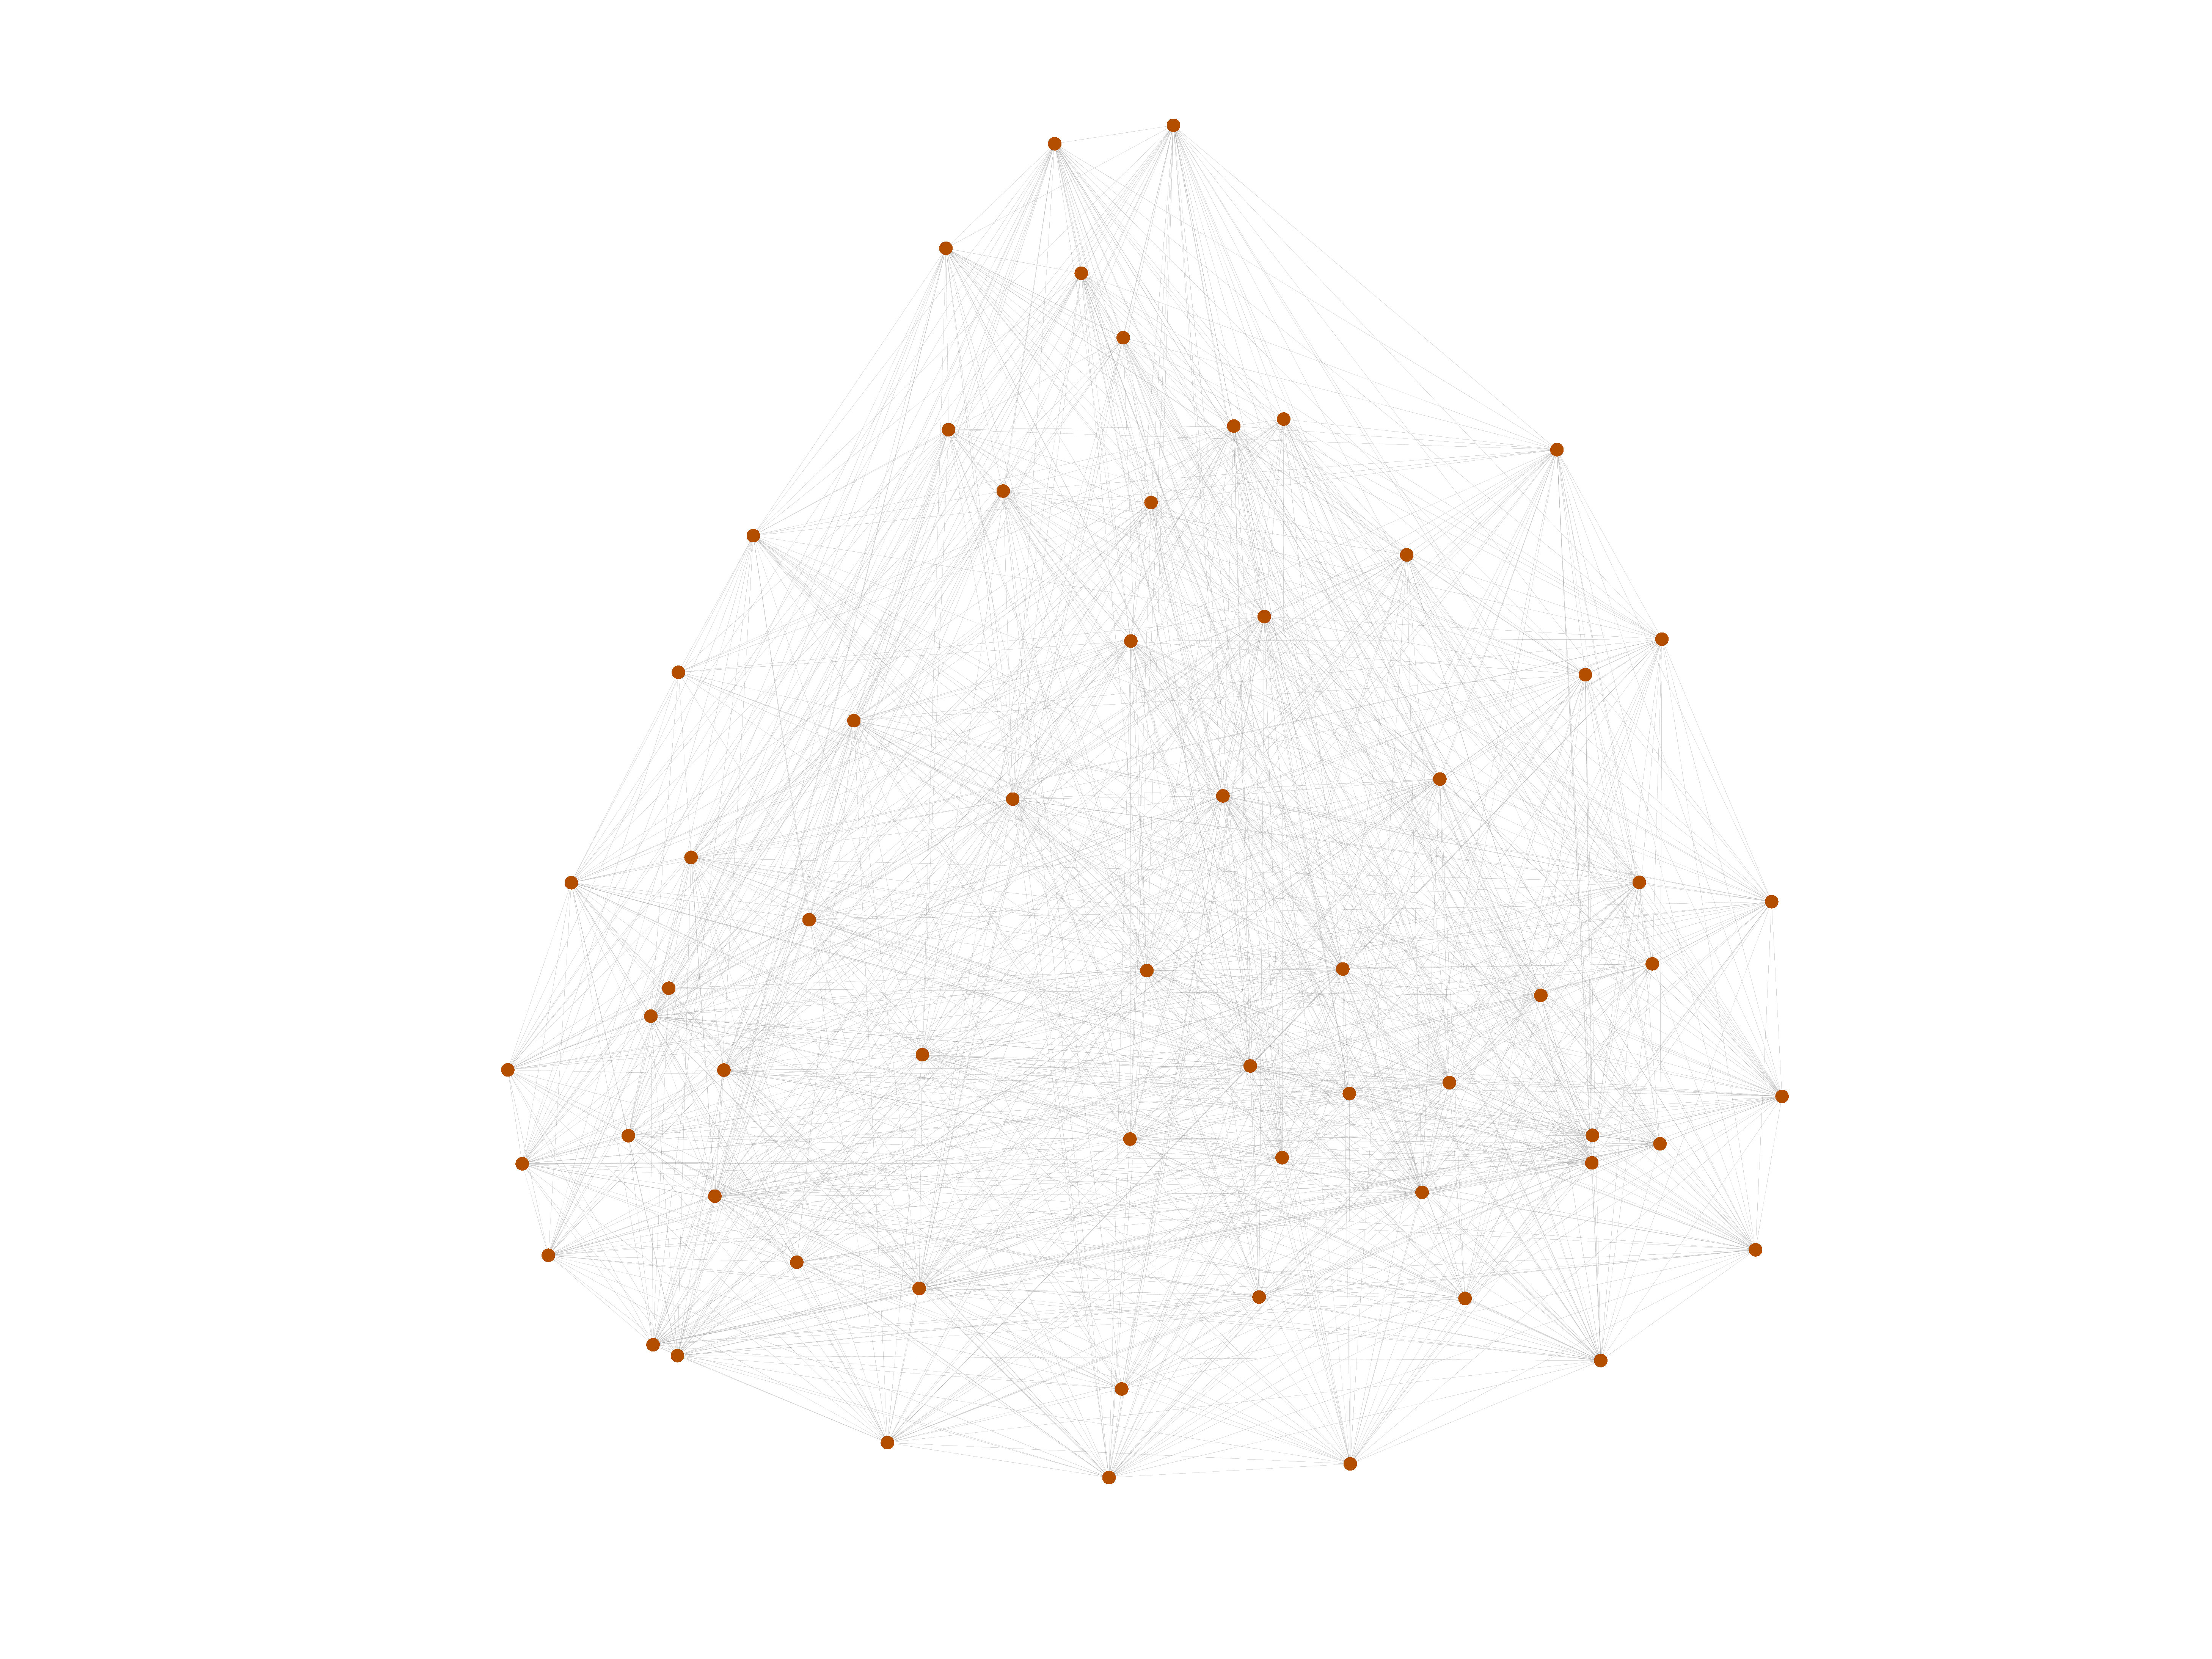
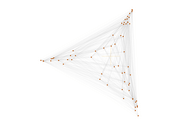
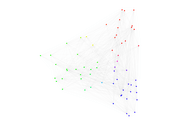
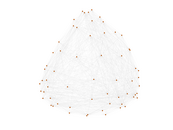
This directed network contains dominance behaviour in a colony of 62 adult
female Japanese macaques (Macaca fuscata fuscata). A node represents a
macaque and a directed edge A → B represents dominance of macaque A over
macaque B.
Metadata
Statistics
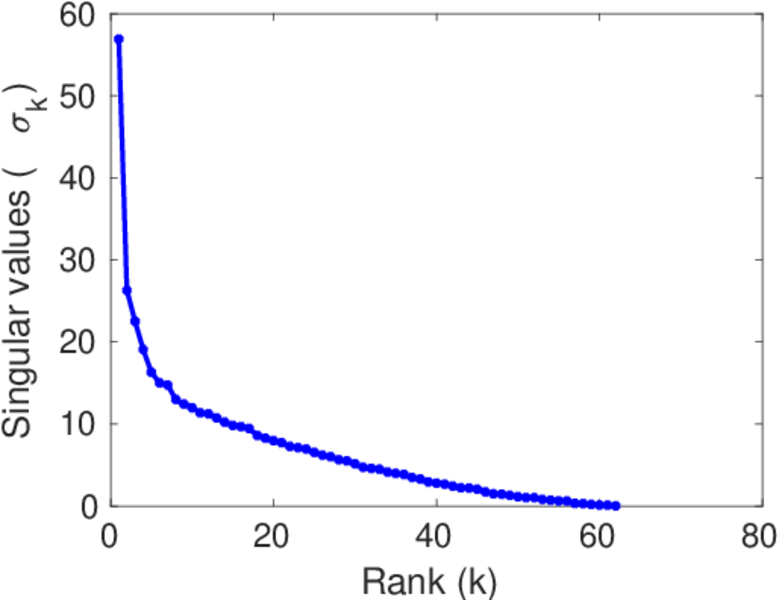
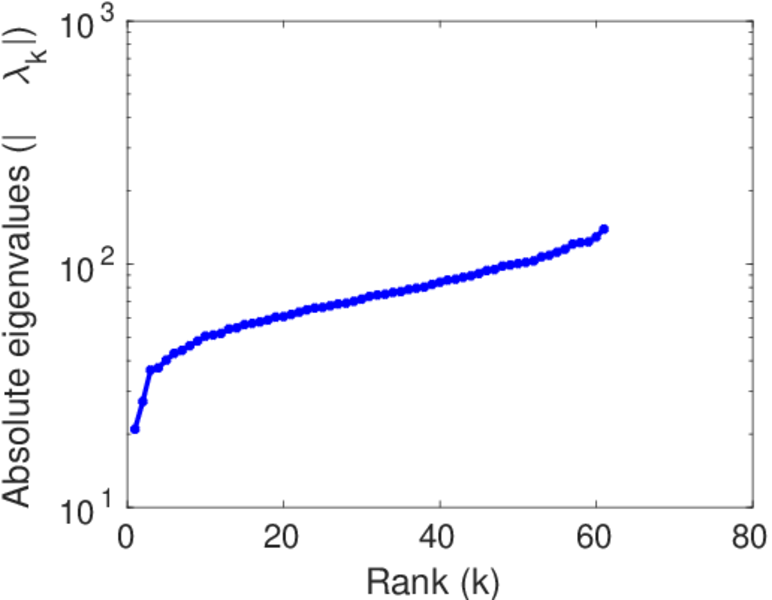
| Size | n = | 62
|
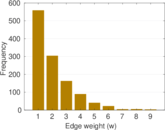
| Volume | m = | 1,187
|
| Loop count | l = | 0
|
| Wedge count | s = | 44,463
|
| Claw count | z = | 603,956
|
| Cross count | x = | 5,992,165
|
| Triangle count | t = | 9,781
|
| Square count | q = | 270,724
|
| 4-Tour count | T4 = | 2,345,978
|
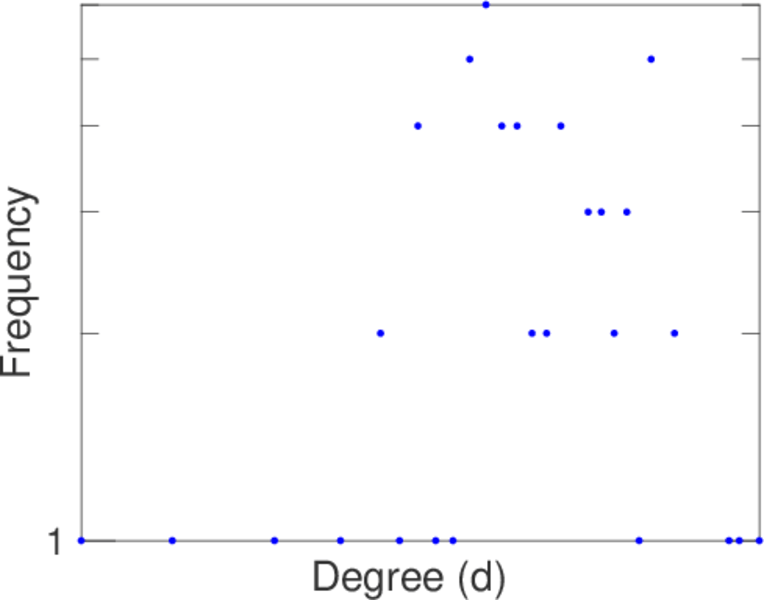
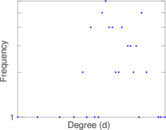
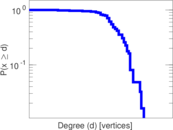
| Maximum degree | dmax = | 57
|
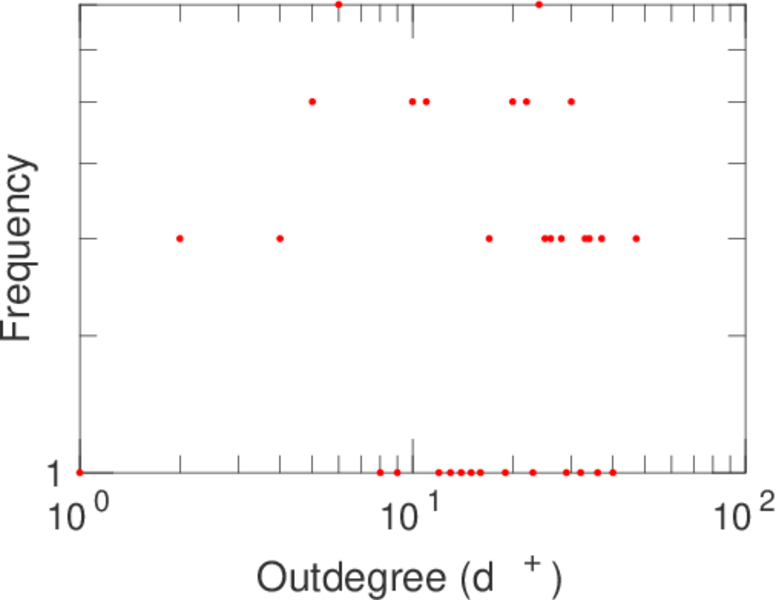
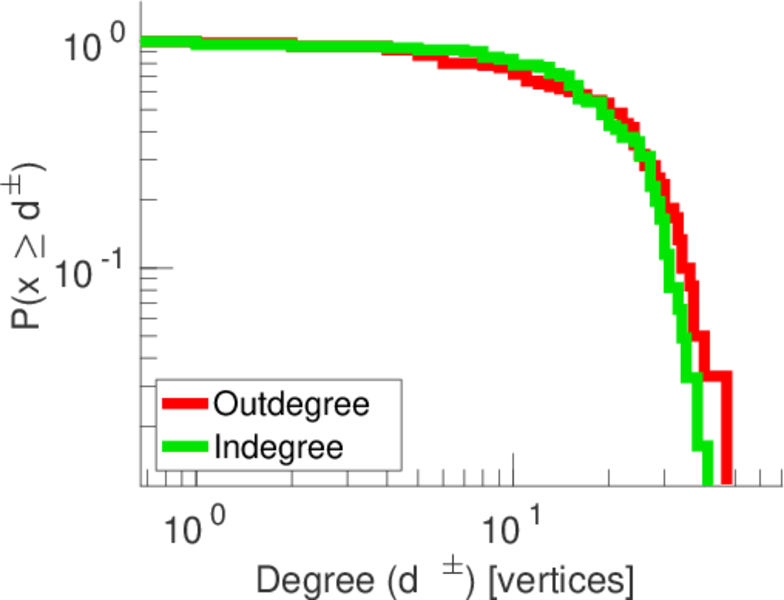
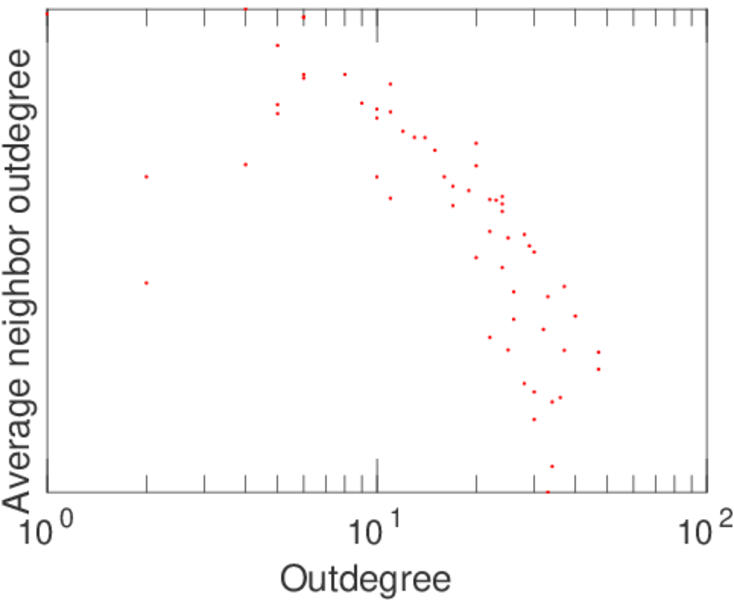
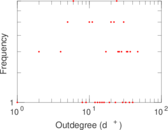
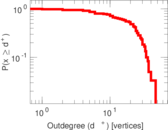
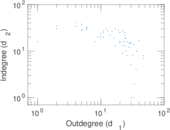
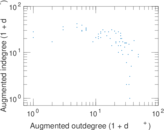
| Maximum outdegree | d+max = | 47
|
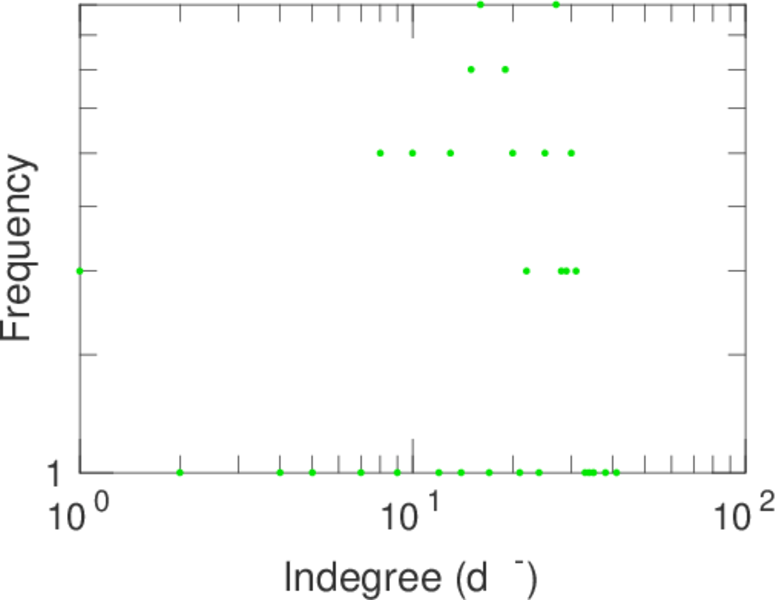
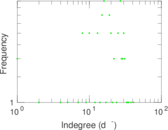
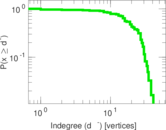
| Maximum indegree | d−max = | 41
|
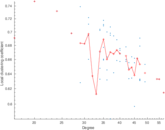
| Average degree | d = | 38.290 3
|
| Fill | p = | 0.313 855
|
| Size of LCC | N = | 62
|
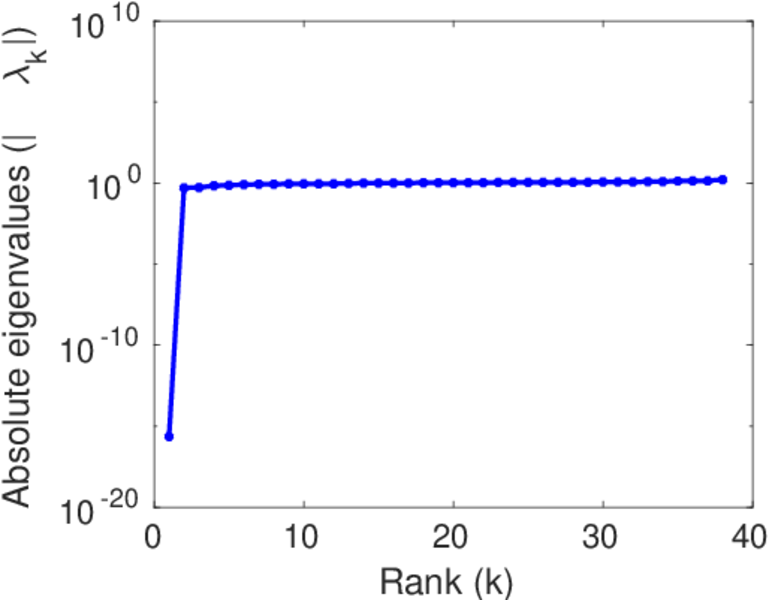
| Size of LSCC | Ns = | 38
|
| Relative size of LSCC | Nrs = | 0.612 903
|
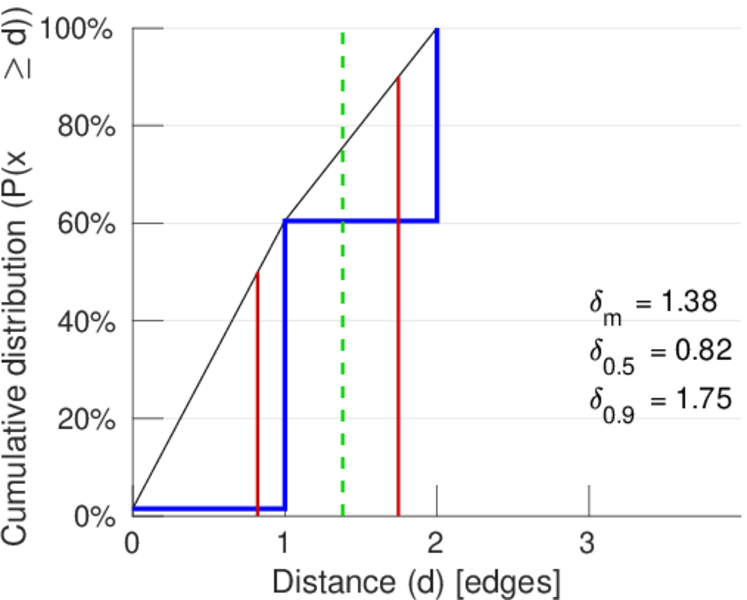
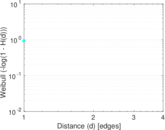
| Diameter | δ = | 2
|
| 50-Percentile effective diameter | δ0.5 = | 0.822 929
|
| 90-Percentile effective diameter | δ0.9 = | 1.747 20
|
| Median distance | δM = | 1
|
| Mean distance | δm = | 1.380 93
|
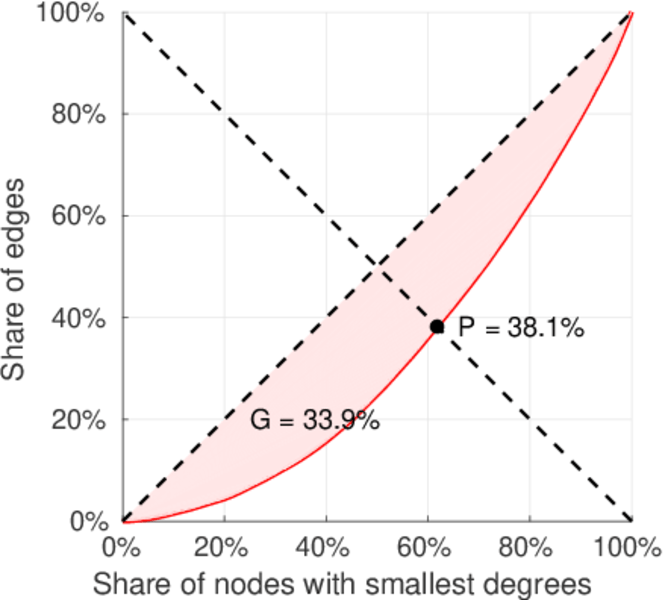
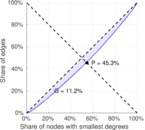
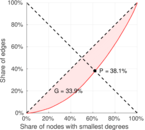
| Gini coefficient | G = | 0.111 721
|
| Balanced inequality ratio | P = | 0.452 822
|
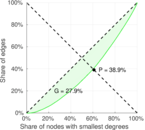
| Outdegree balanced inequality ratio | P+ = | 0.380 792
|
| Indegree balanced inequality ratio | P− = | 0.389 217
|
| Relative edge distribution entropy | Her = | 0.994 930
|
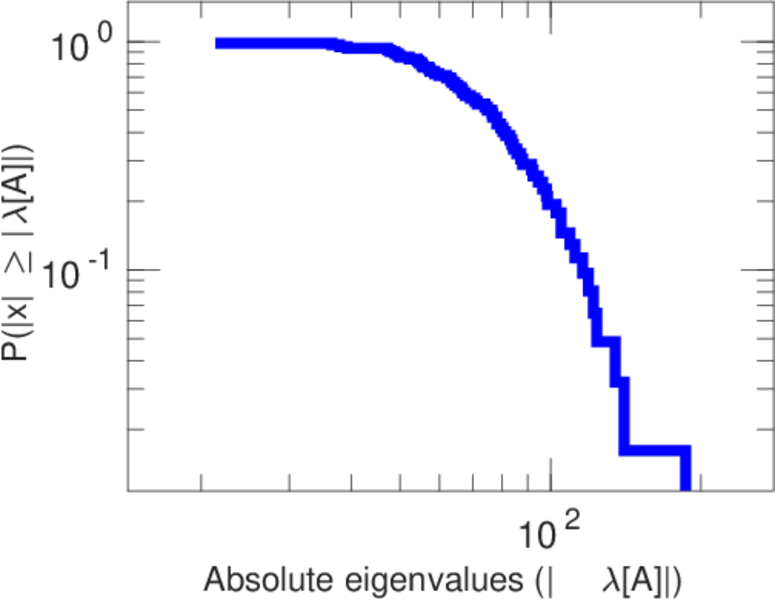
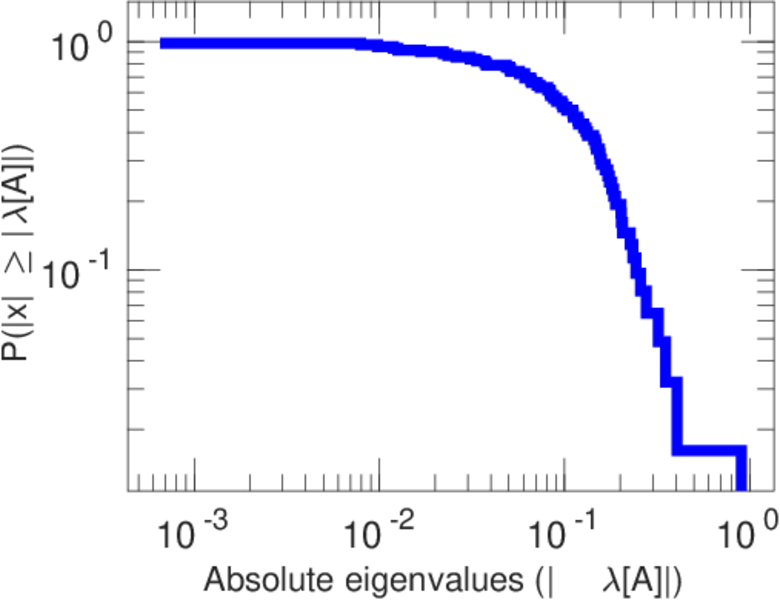
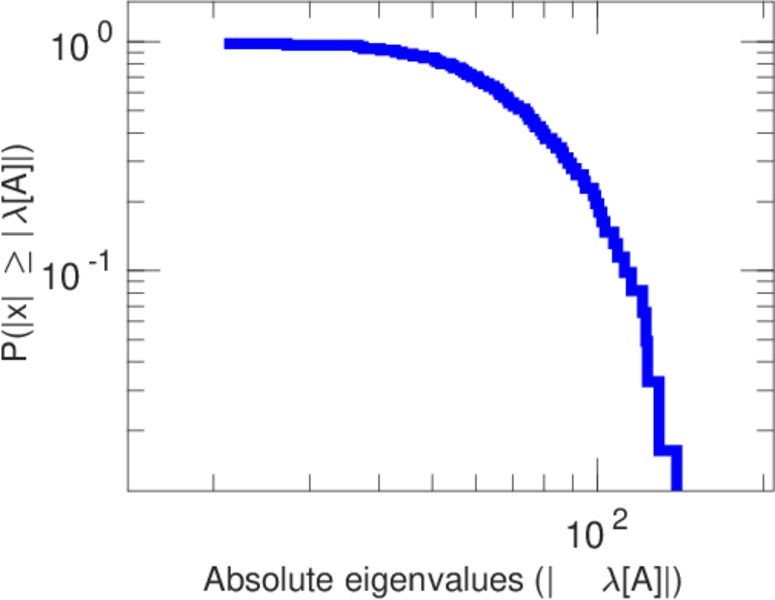
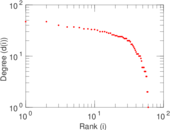
| Power law exponent | γ = | 2.292 46
|
| Tail power law exponent | γt = | 5.781 00
|
| Tail power law exponent with p | γ3 = | 5.781 00
|
| p-value | p = | 0.018 000 0
|
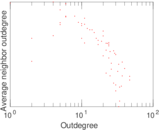
| Outdegree tail power law exponent with p | γ3,o = | 7.271 00
|
| Outdegree p-value | po = | 0.785 000
|
| Indegree tail power law exponent with p | γ3,i = | 8.341 00
|
| Indegree p-value | pi = | 0.916 000
|
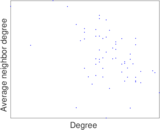
| Degree assortativity | ρ = | −0.072 580 0
|
| Degree assortativity p-value | pρ = | 0.000 449 461
|
| In/outdegree correlation | ρ± = | −0.552 571
|
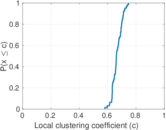
| Clustering coefficient | c = | 0.659 942
|
| Directed clustering coefficient | c± = | 0.602 249
|
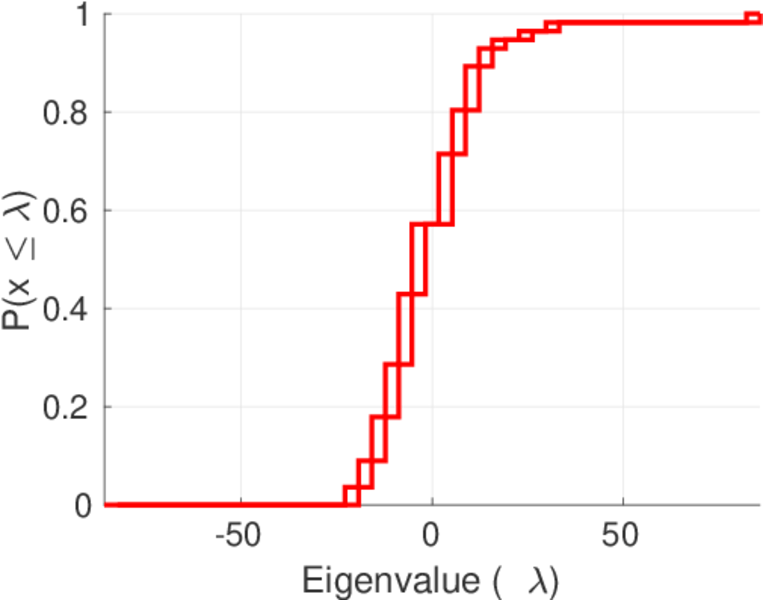
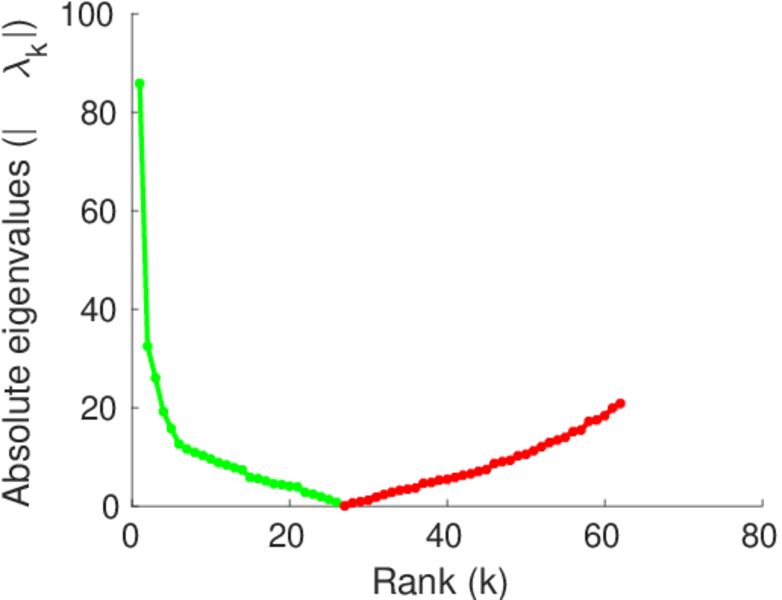
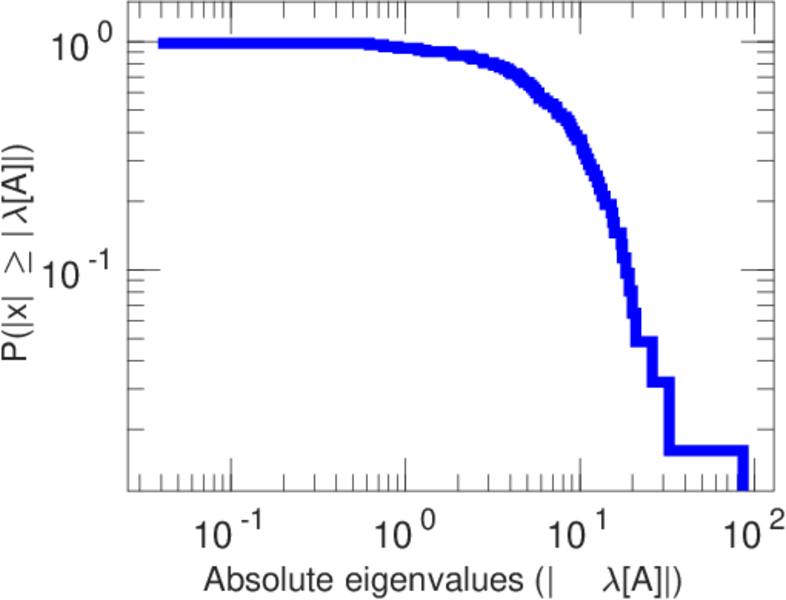
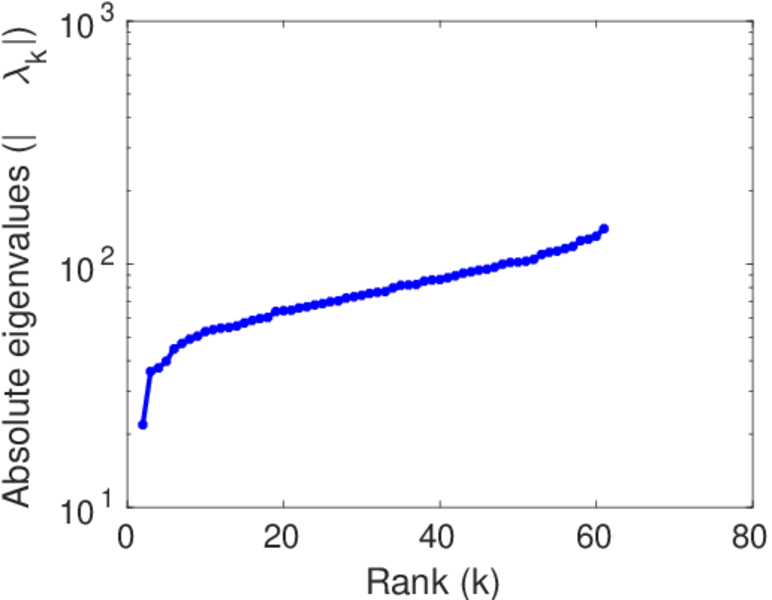
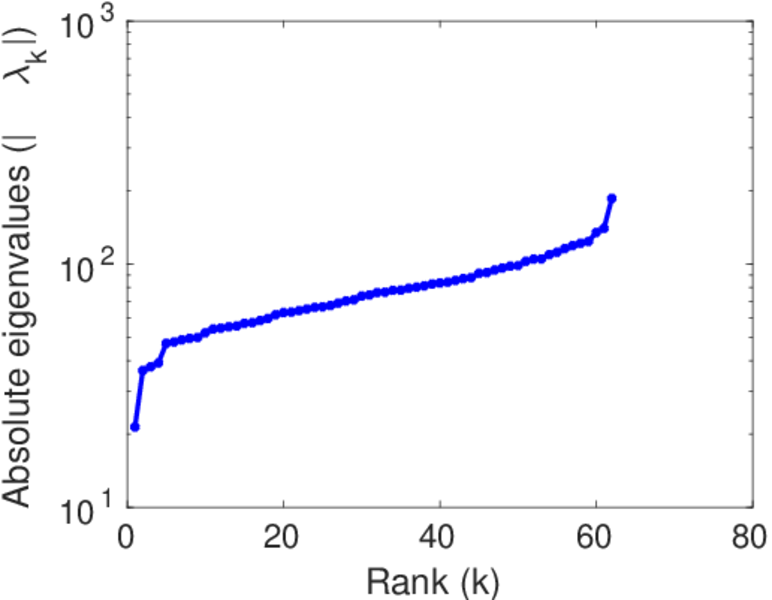
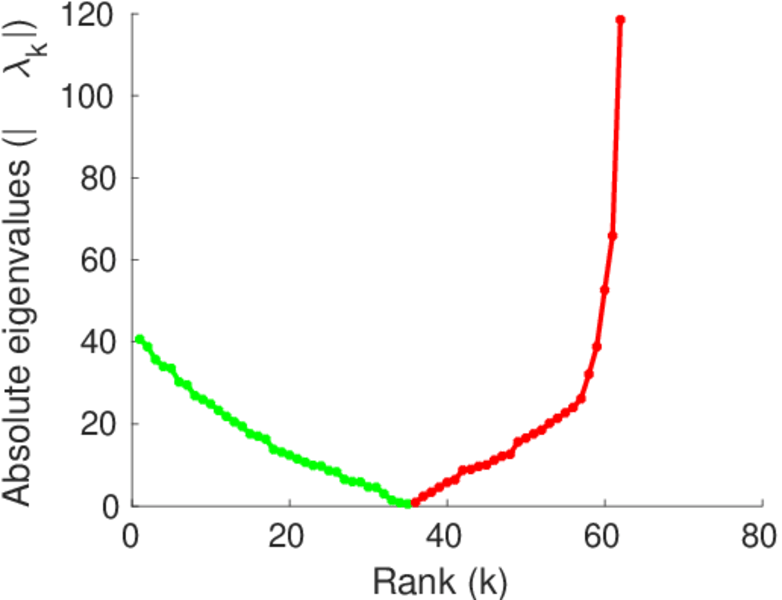
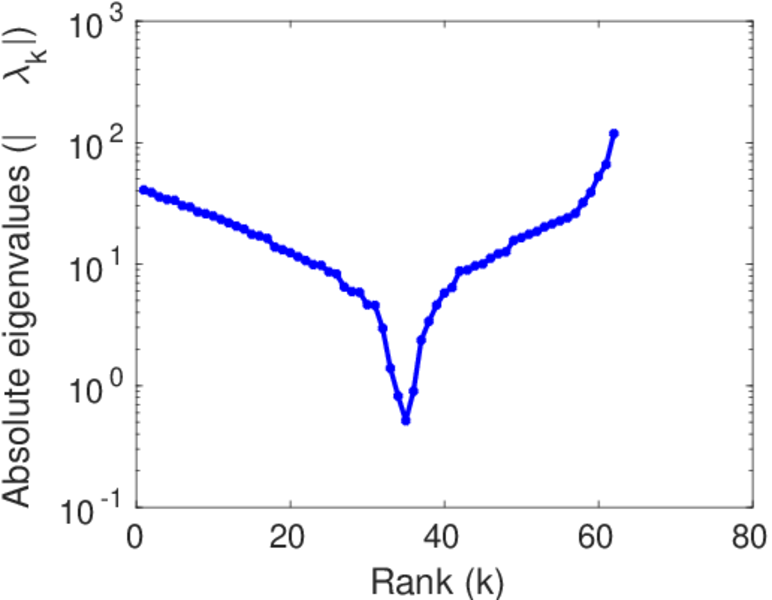
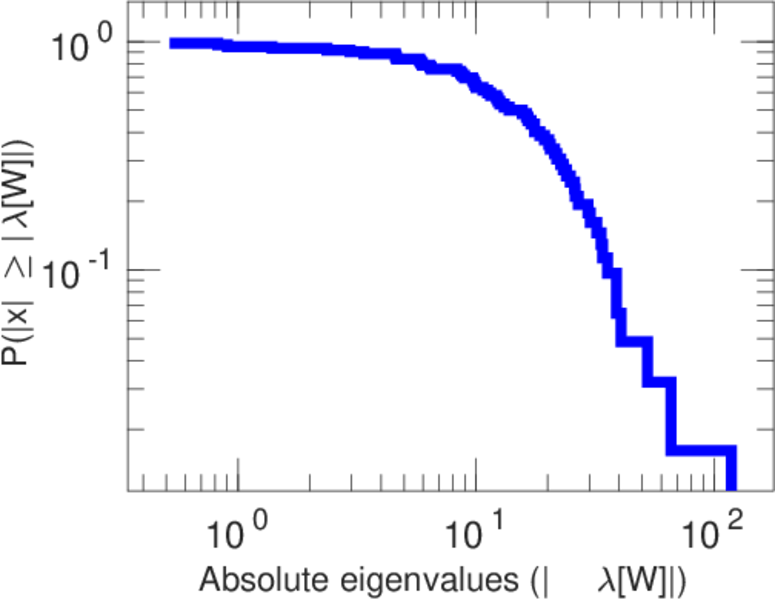
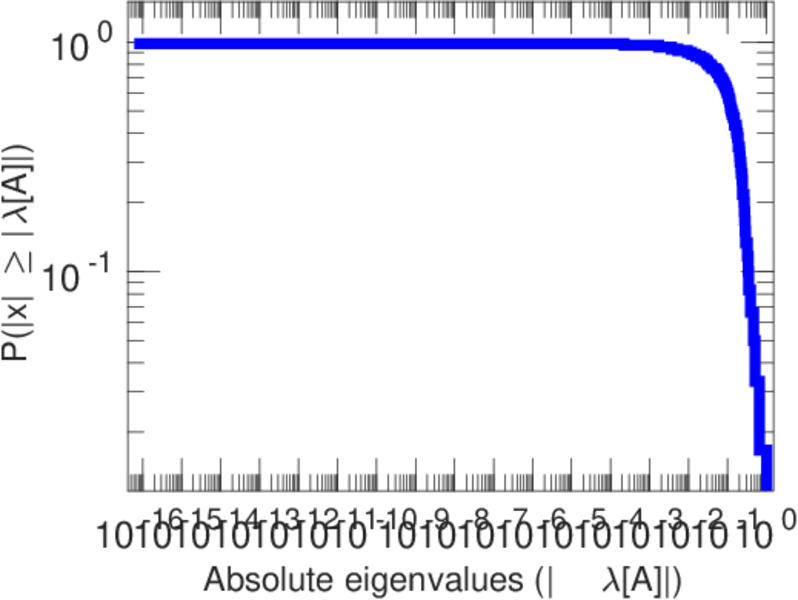
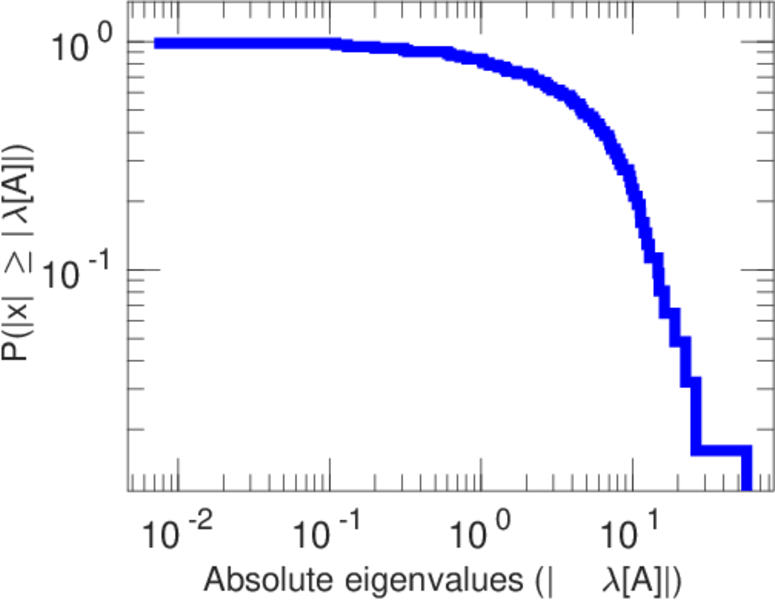
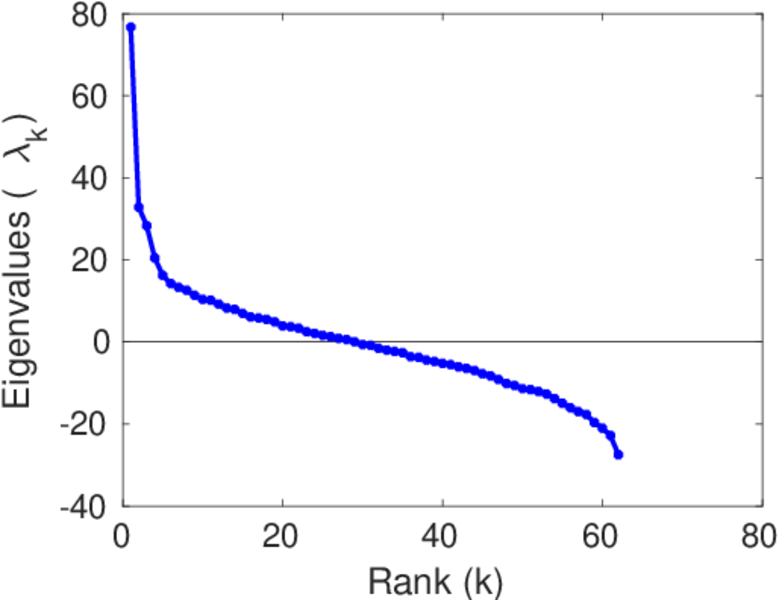
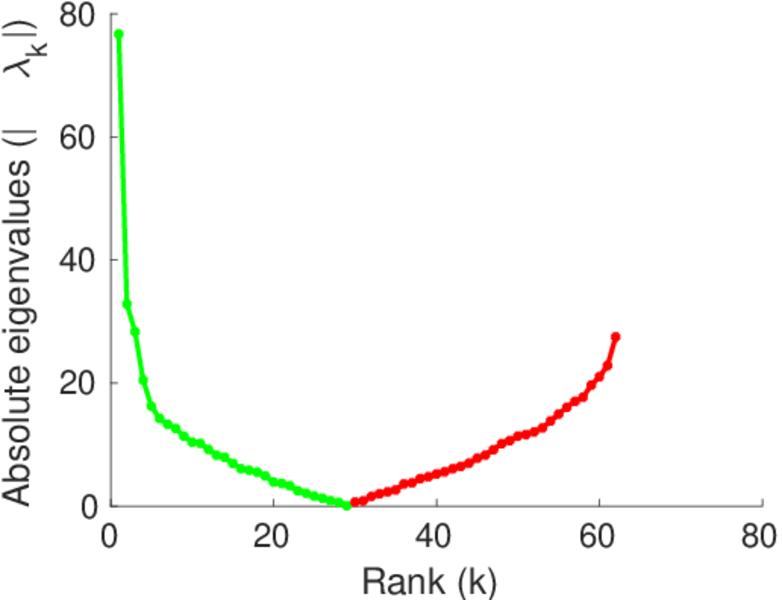
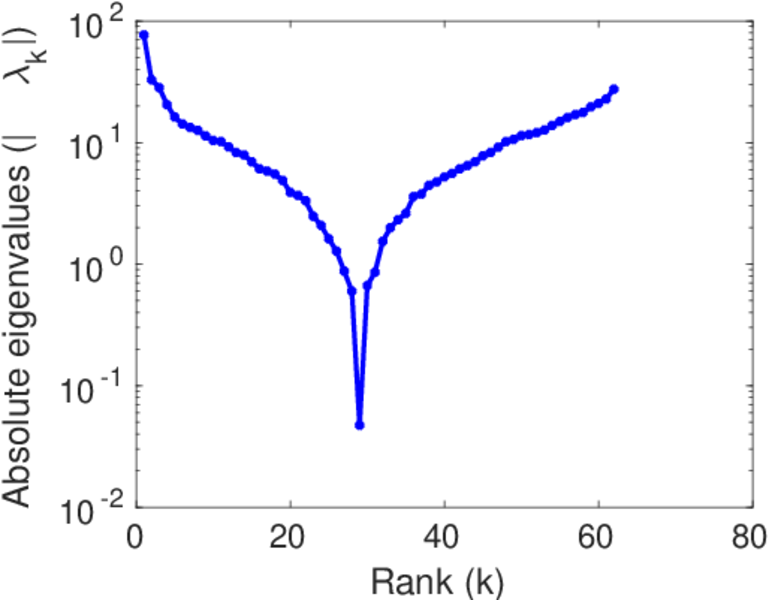
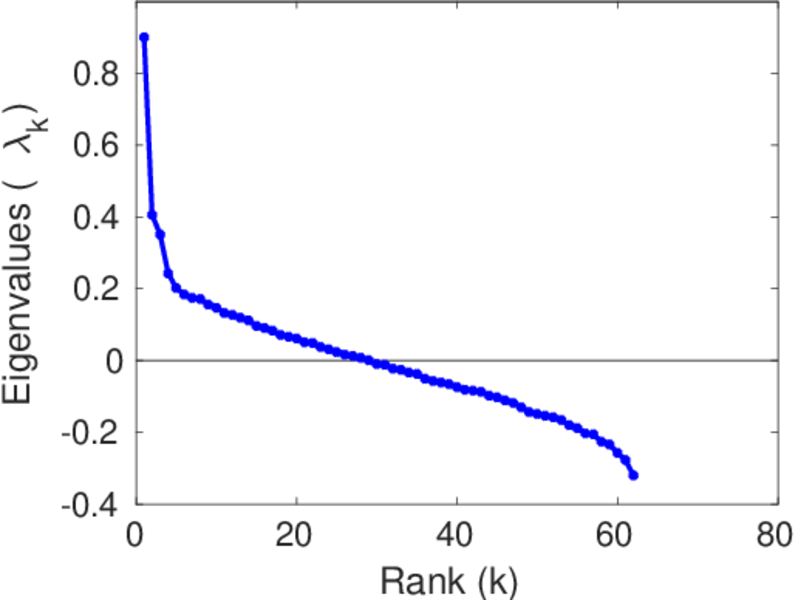
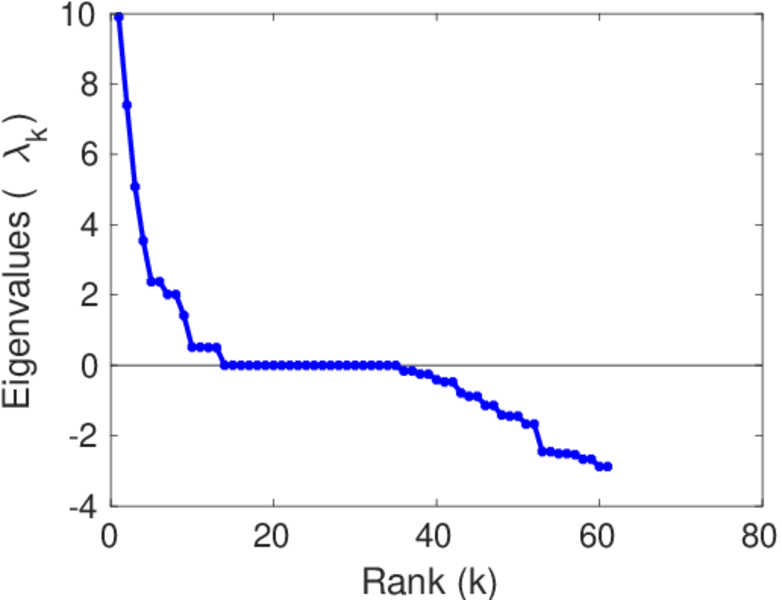
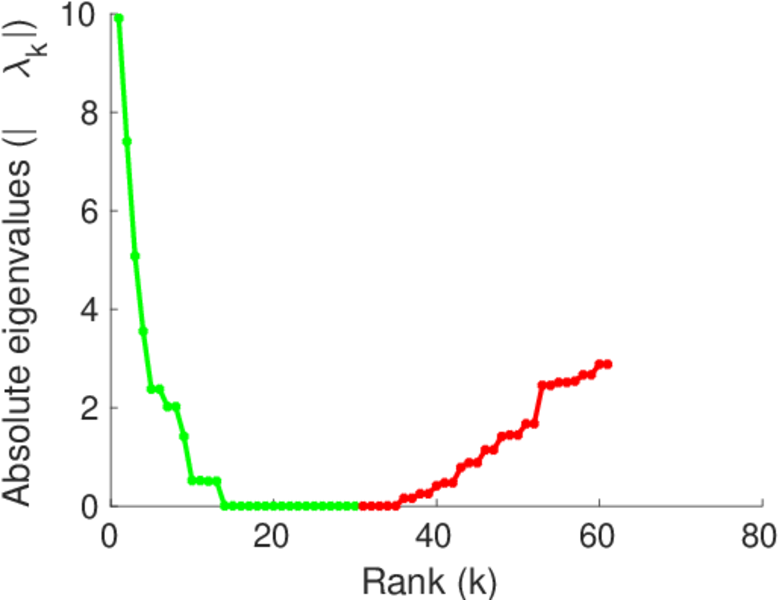
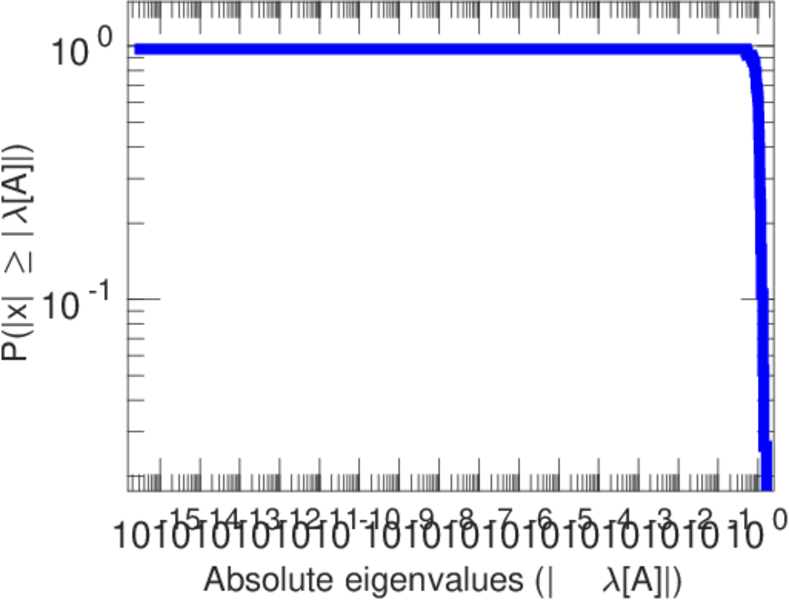
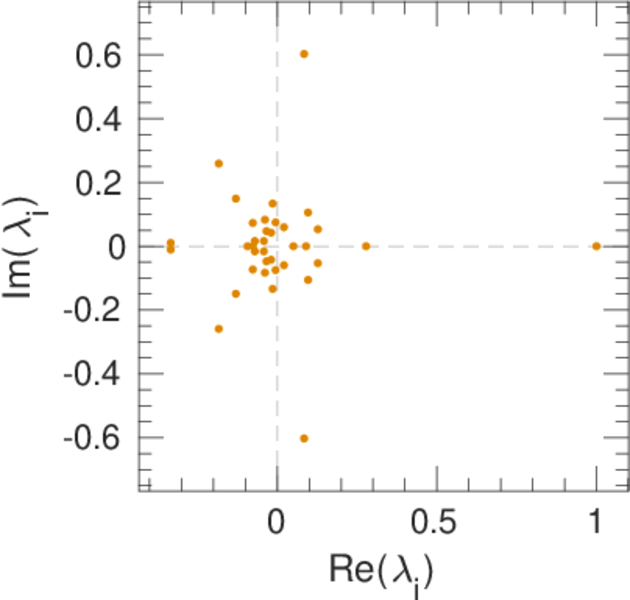
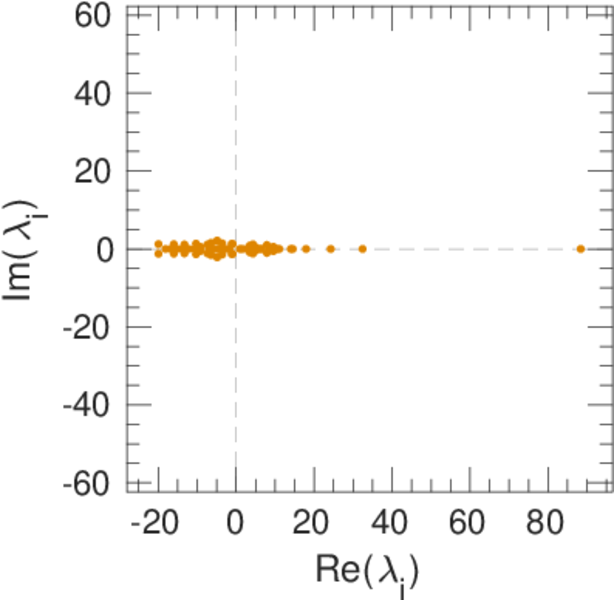
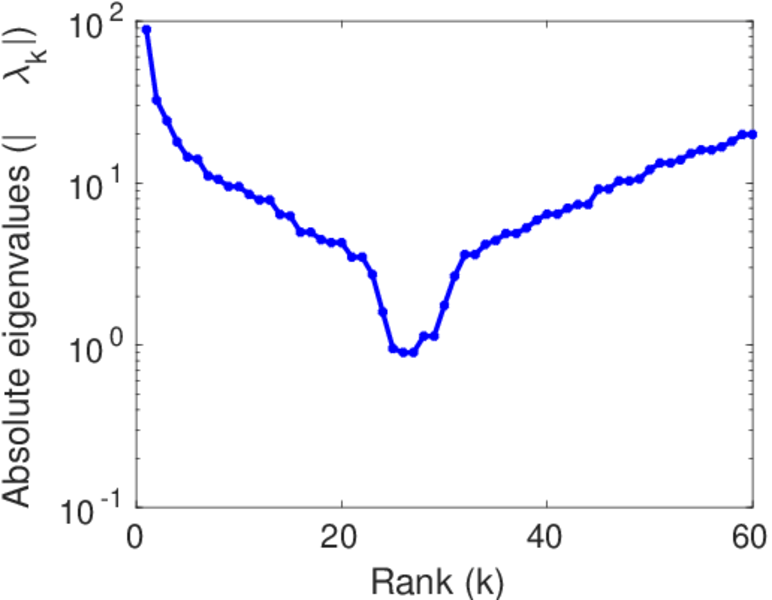
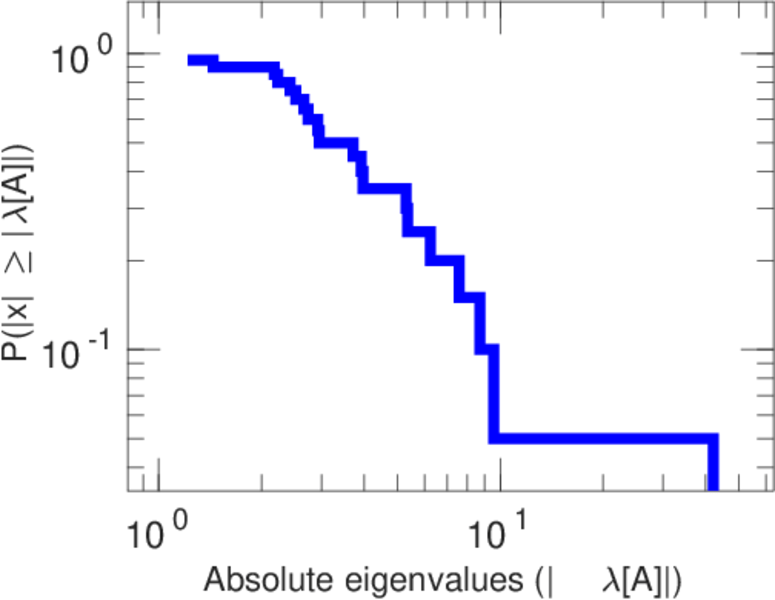
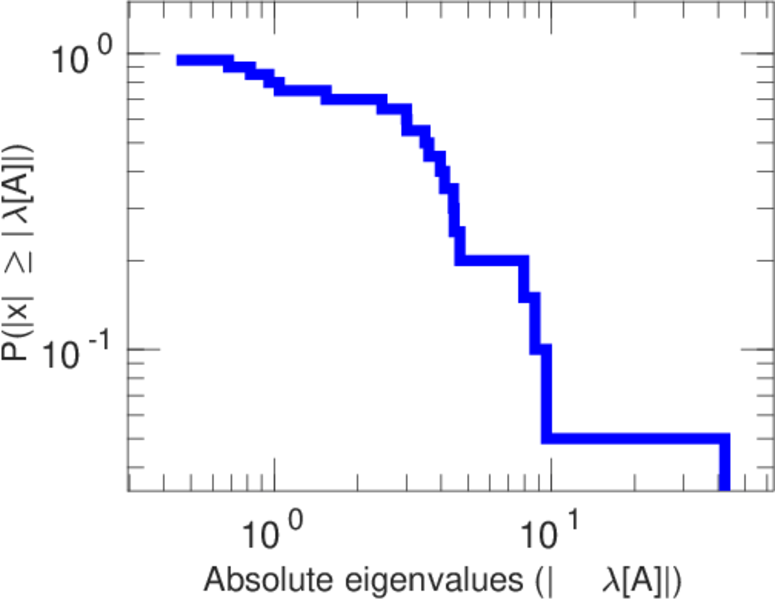
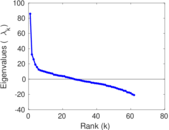
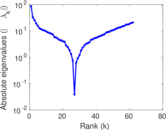
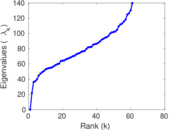
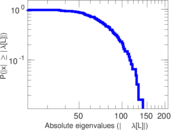
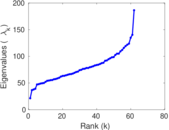
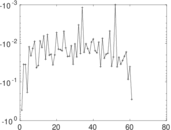
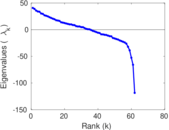
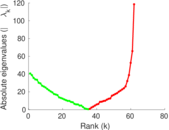
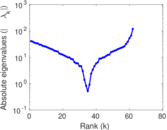
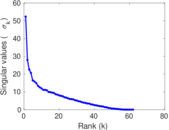
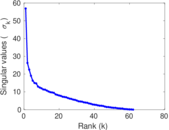
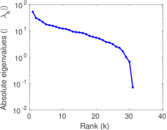
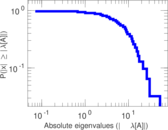
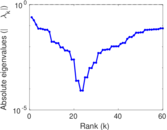
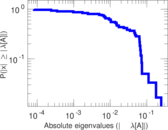
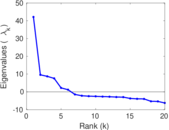
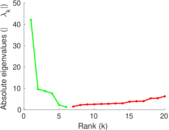
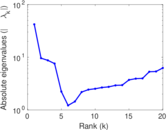
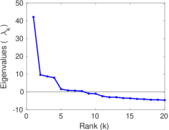
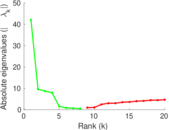
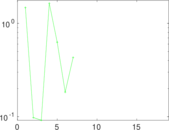
| Spectral norm | α = | 85.836 3
|
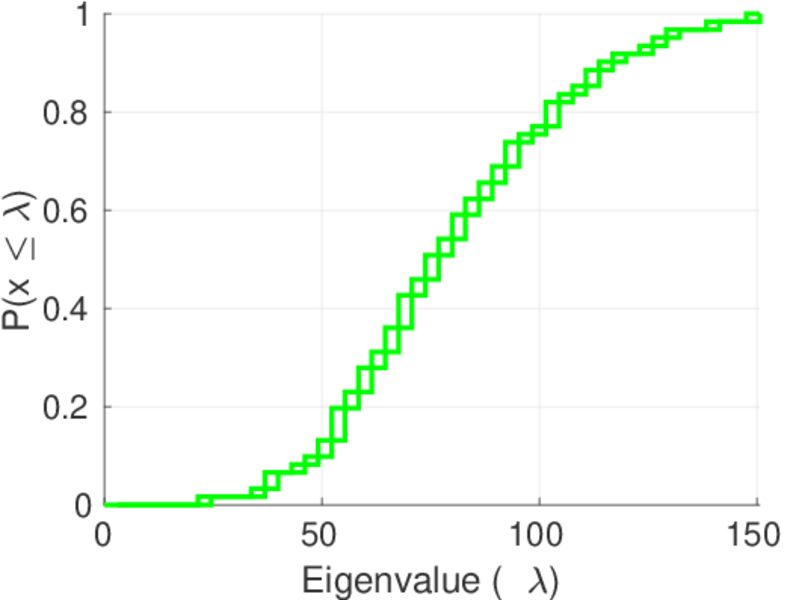
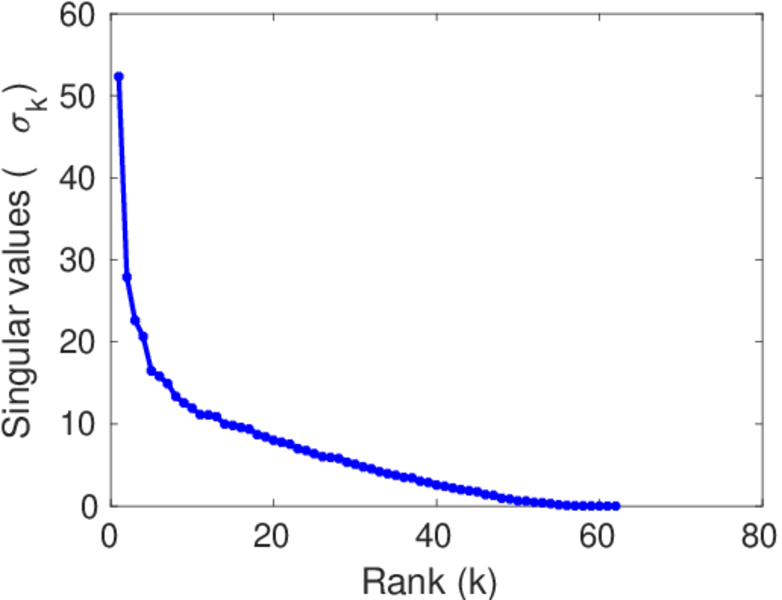
| Operator 2-norm | ν = | 52.331 1
|
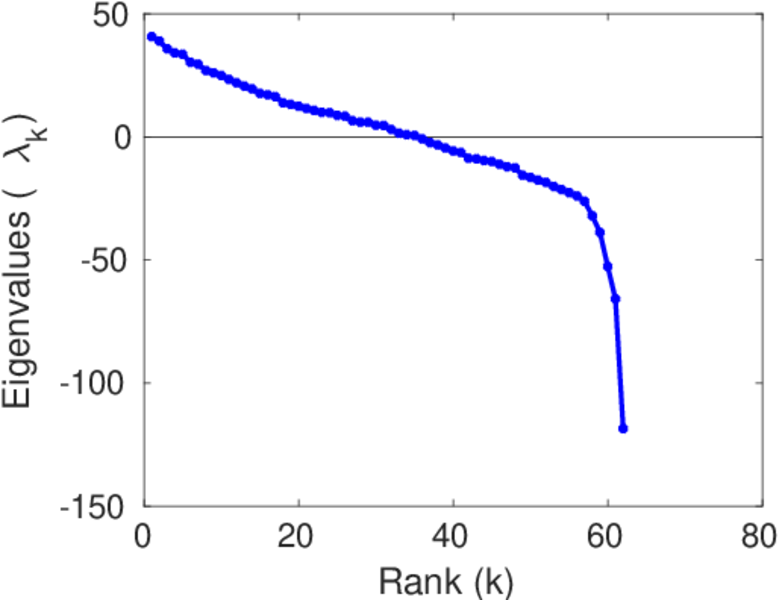
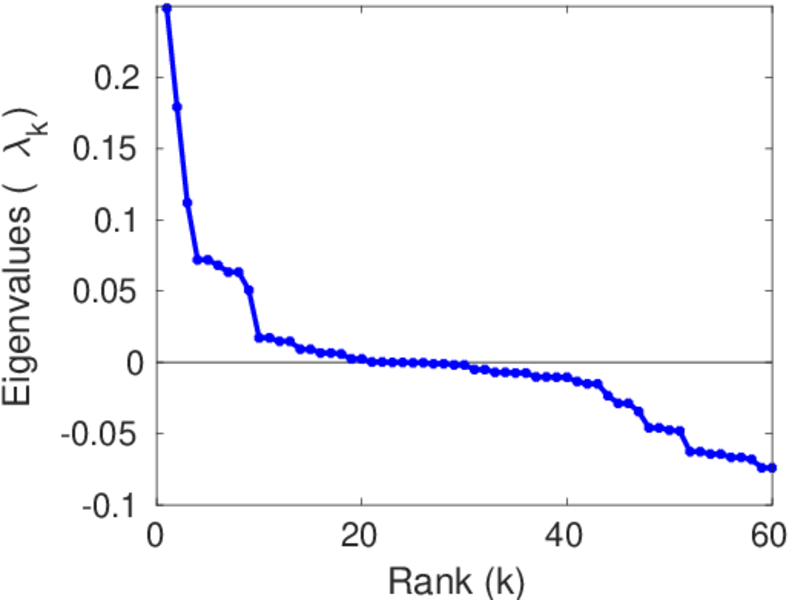
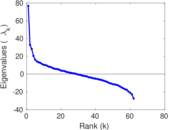
| Cyclic eigenvalue | π = | 9.907 16
|
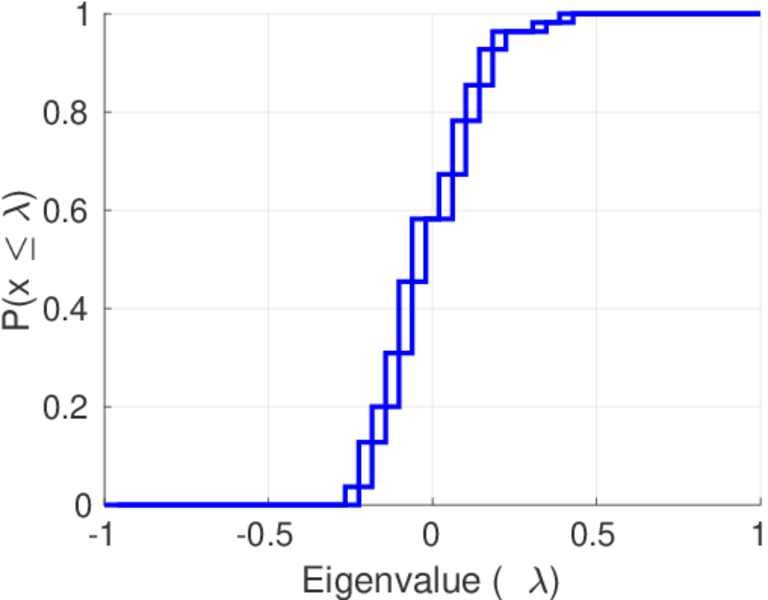
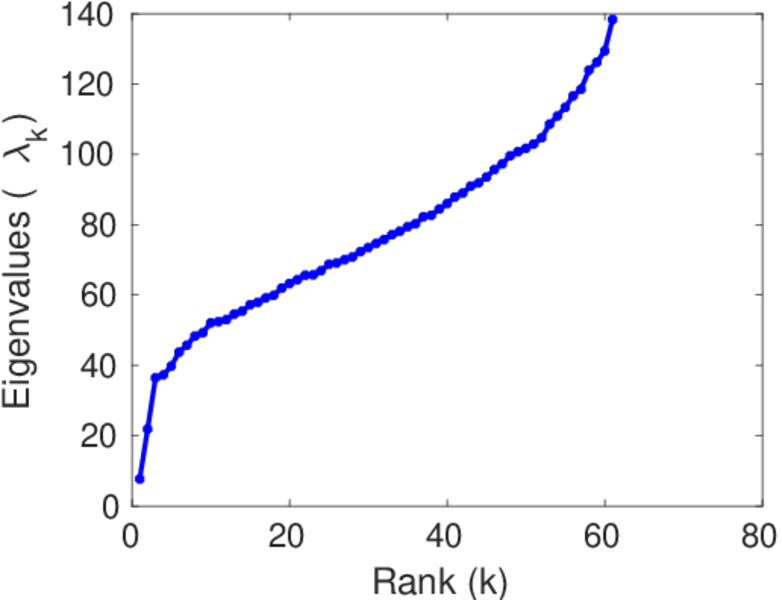
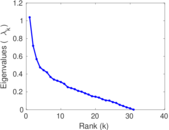
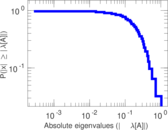
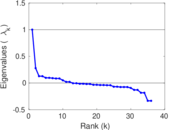
| Algebraic connectivity | a = | 21.822 1
|
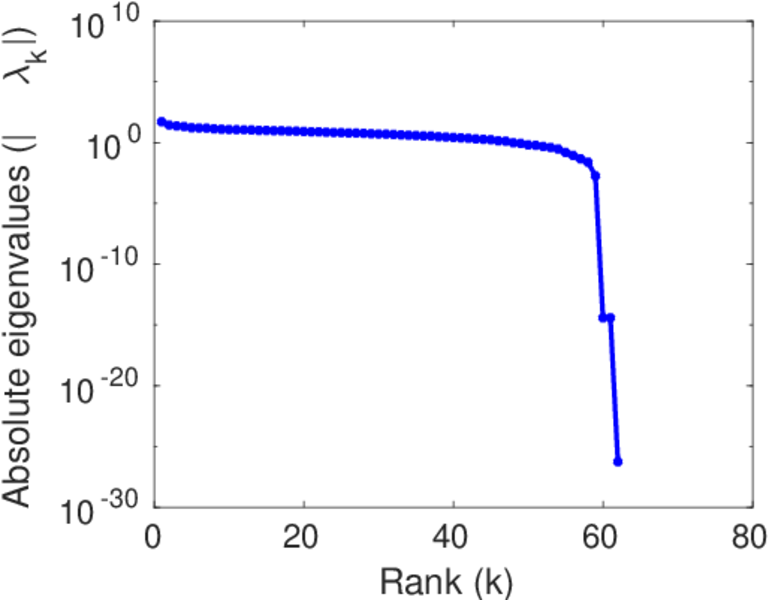
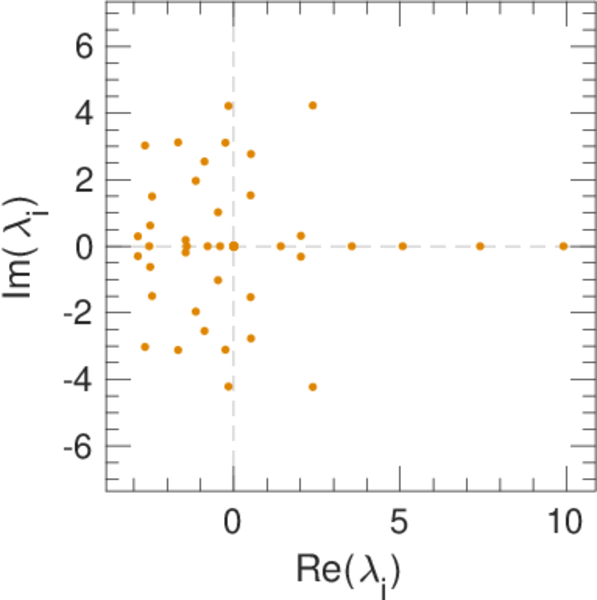
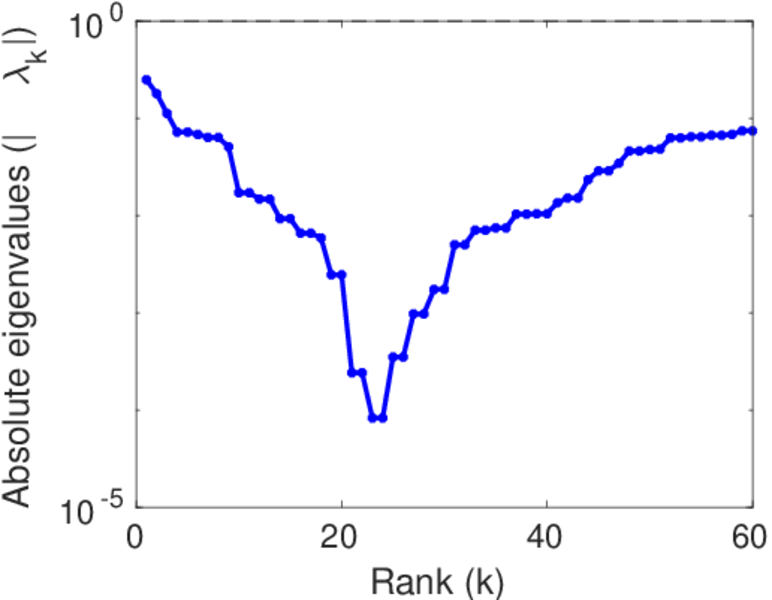
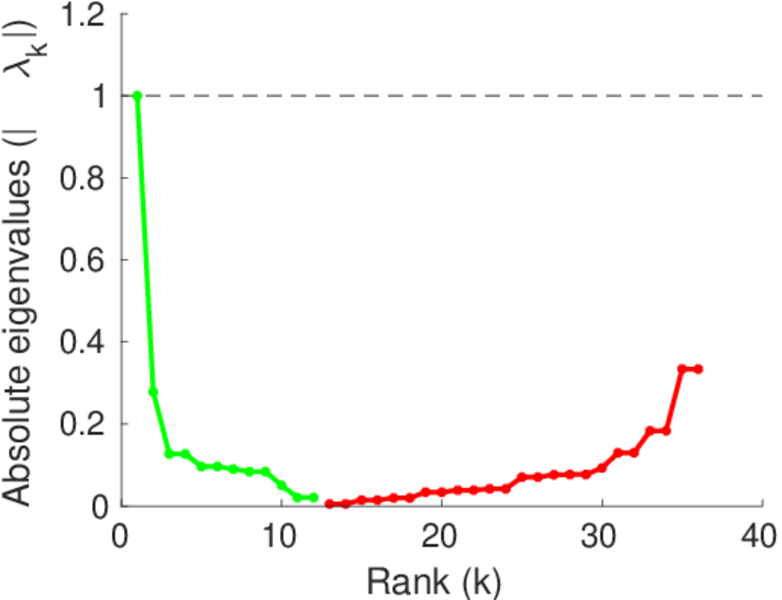
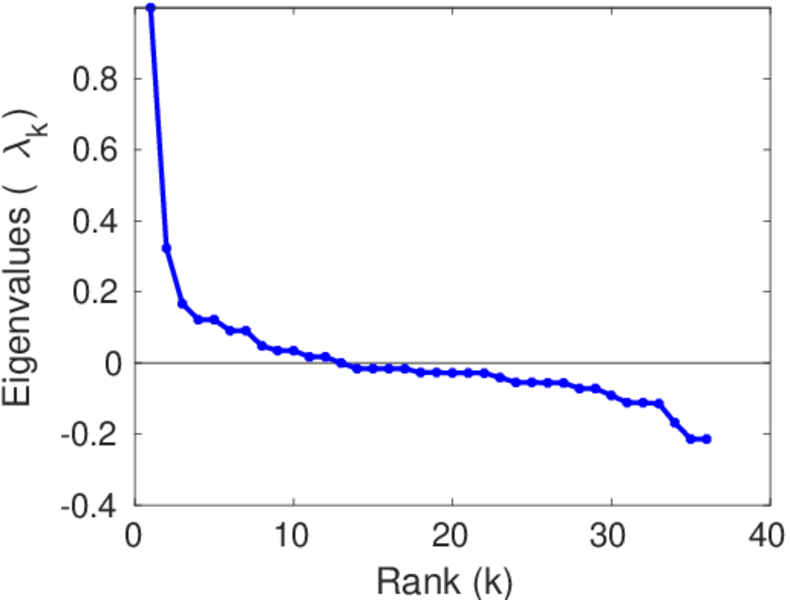
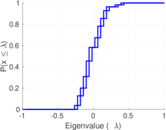
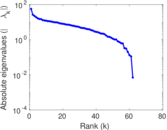
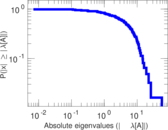
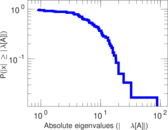
| Spectral separation | |λ1[A] / λ2[A]| = | 2.643 52
|
| Reciprocity | y = | 0.033 698 4
|
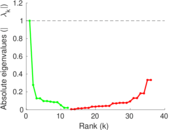
| Non-bipartivity | bA = | 0.811 084
|
| Normalized non-bipartivity | bN = | 0.781 341
|
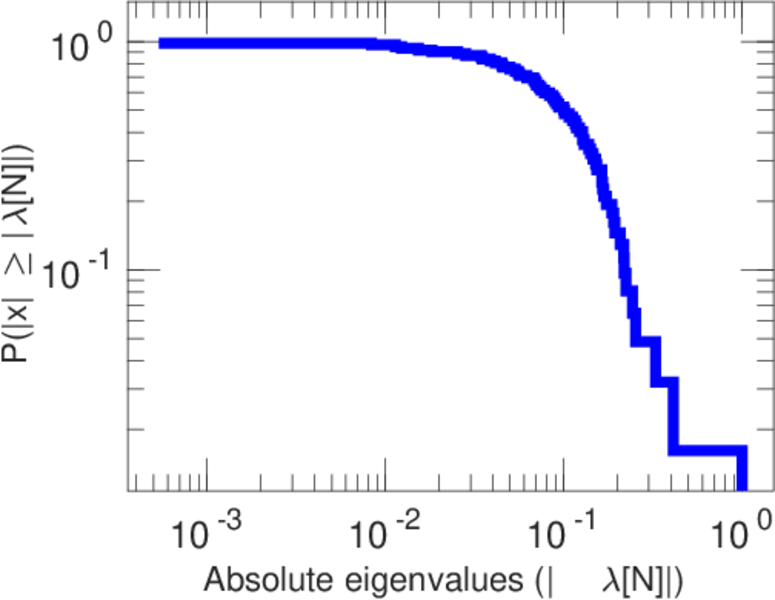
| Algebraic non-bipartivity | χ = | 16.311 6
|
| Spectral bipartite frustration | bK = | 0.108 325
|
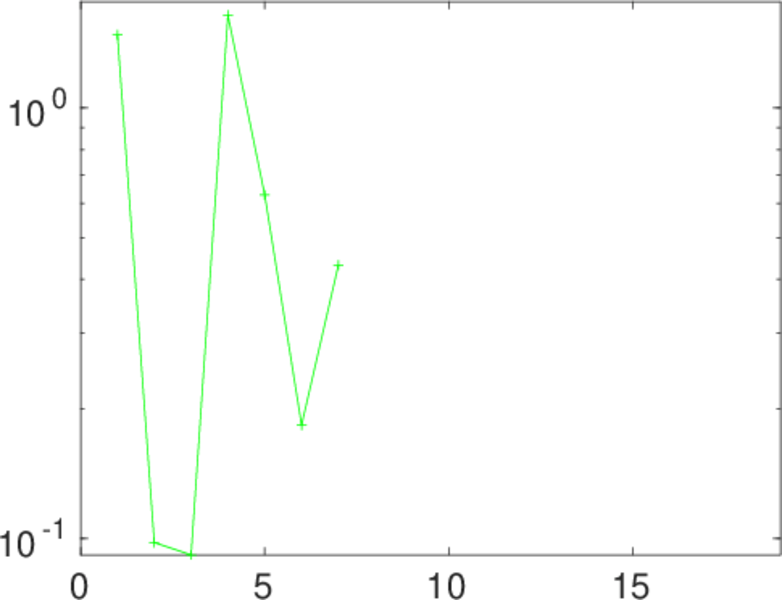
| Controllability | C = | 3
|
| Relative controllability | Cr = | 0.048 387 1
|
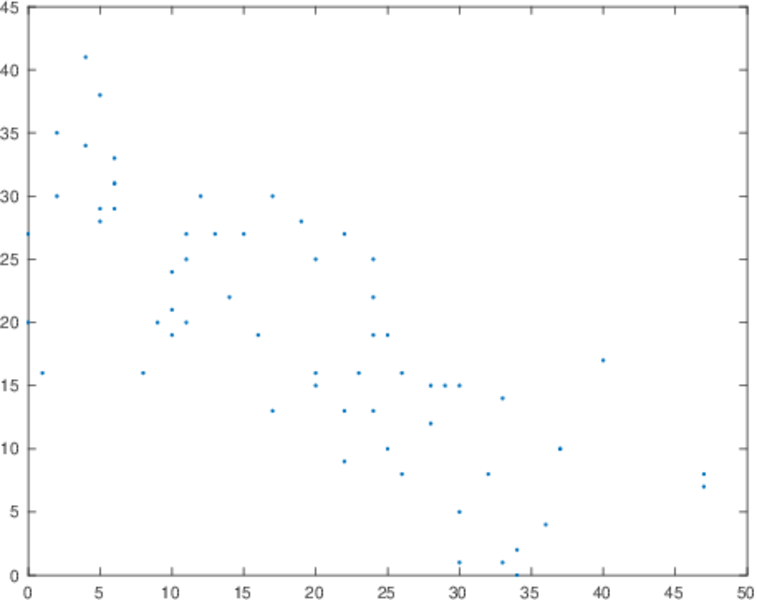
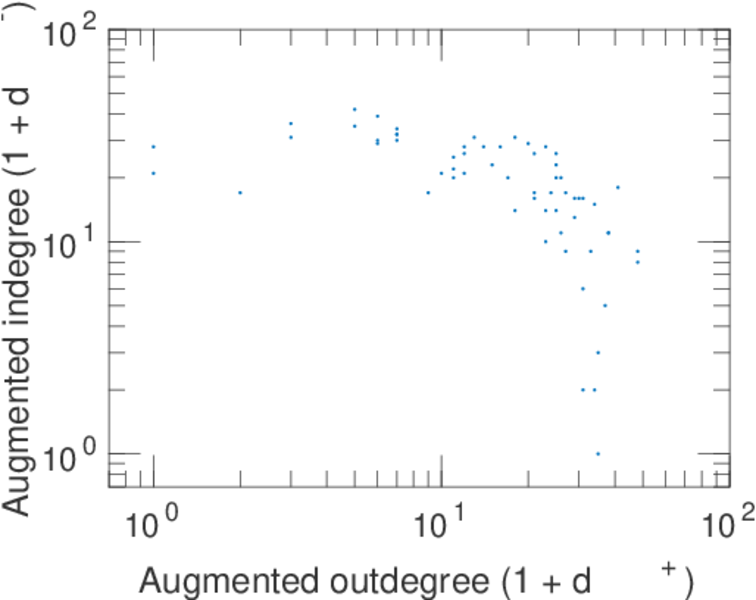
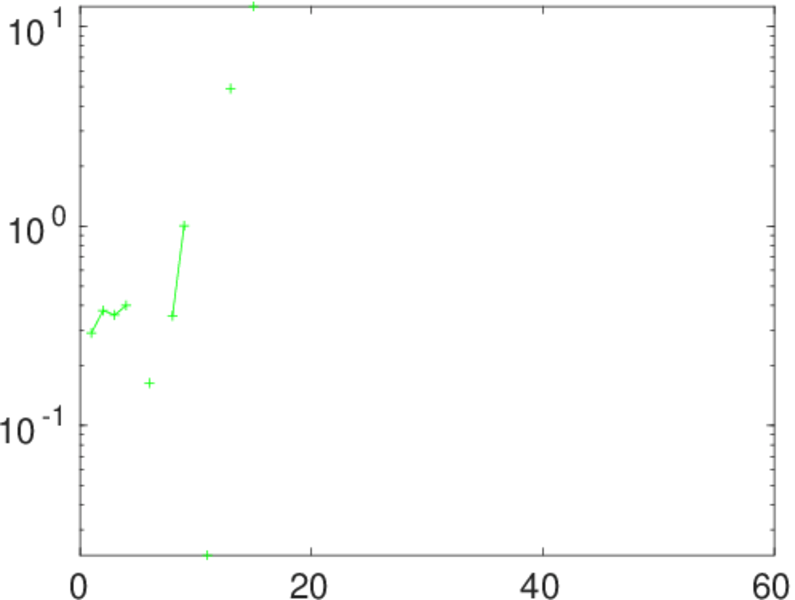
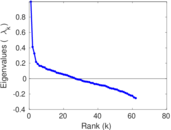
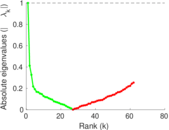
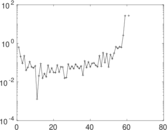
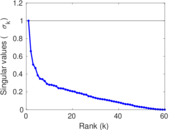
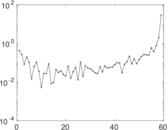
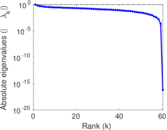
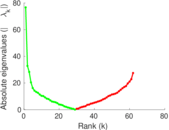
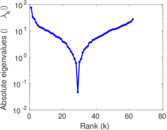
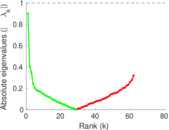
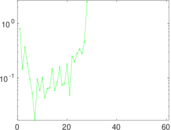
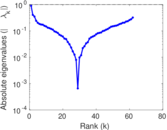
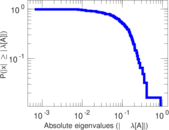
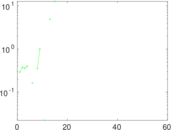
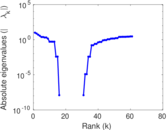
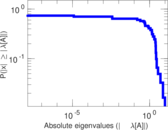
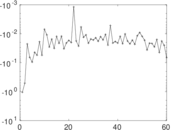
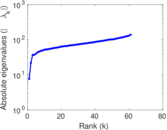
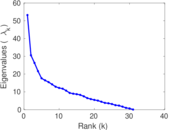
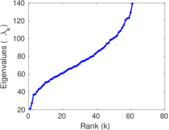
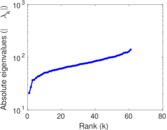
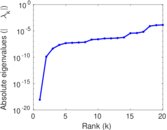
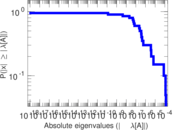
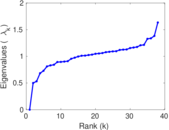
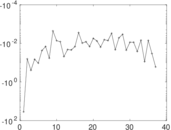
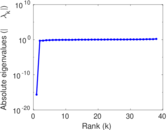
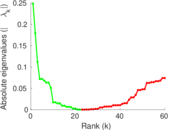
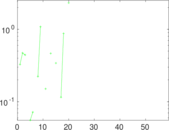
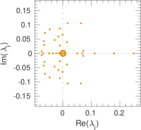
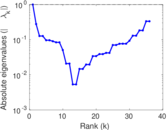
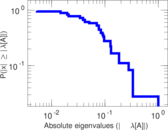
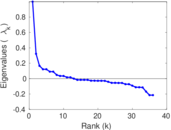
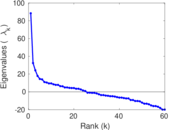
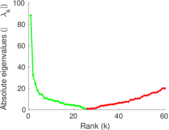
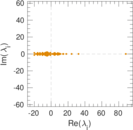
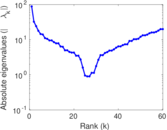
Plots


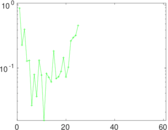
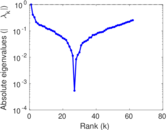
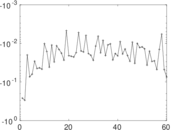
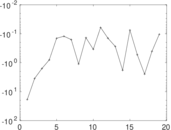
Matrix decompositions plots


Downloads
References
|
[1]
|
Jérôme Kunegis.
KONECT – The Koblenz Network Collection.
In Proc. Int. Conf. on World Wide Web Companion, pages
1343–1350, 2013.
[ http ]
|
|
[2]
|
Yukio Takahata.
Diachronic changes in the dominance relations of adult female
Japanese monkeys of the Arashiyama B group.
In L. M. Fedigan and P. J. Asquith, editors, The Monkeys of
Arashiyama: Thirty-five Years of Res. in Japan and the West, pages
123–139. 1991.
|
 KONECT ‣ Networks ‣
Buy Me a Coffee
KONECT ‣ Networks ‣
Buy Me a Coffee