Bible
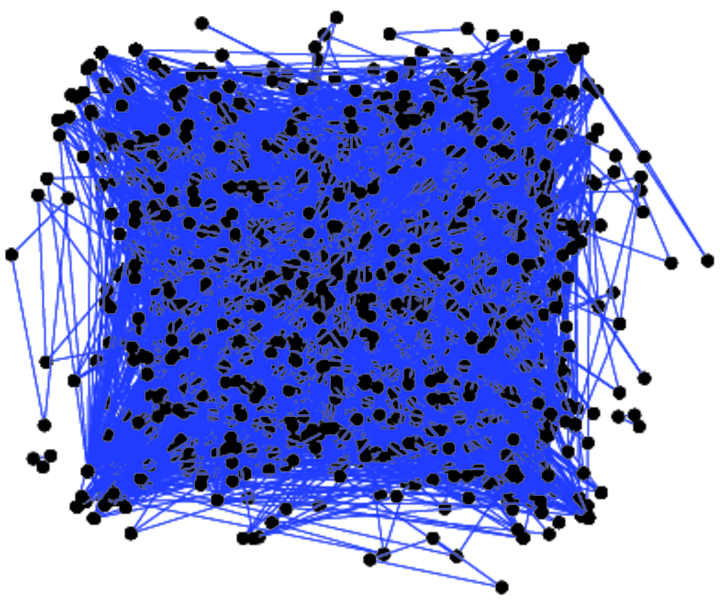
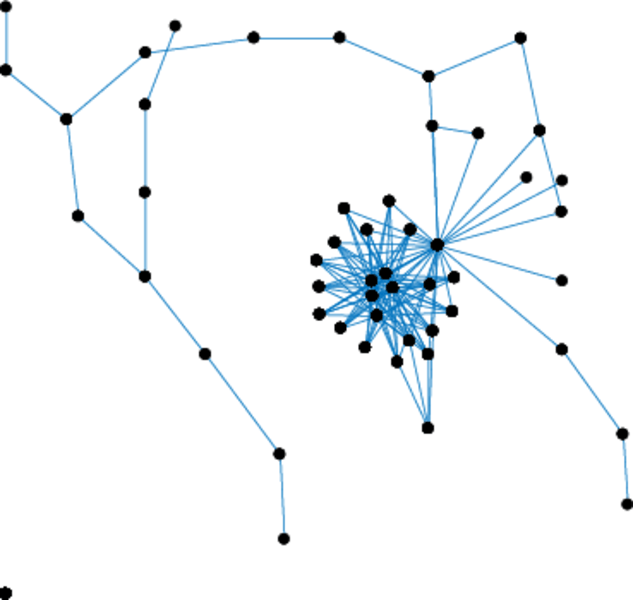
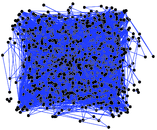
This undirected network contains nouns (places and names) of the King James
Version of the Bible (KJV, also known as the Authorised Version) and
information about their co-occurrences. A node represents one of the above noun
types and an edge indicates that two nouns appeared together in the same Bible
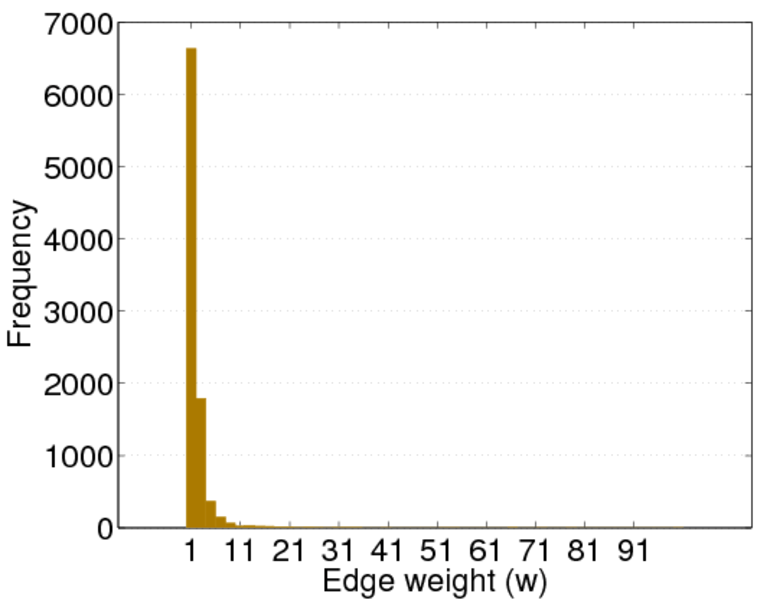
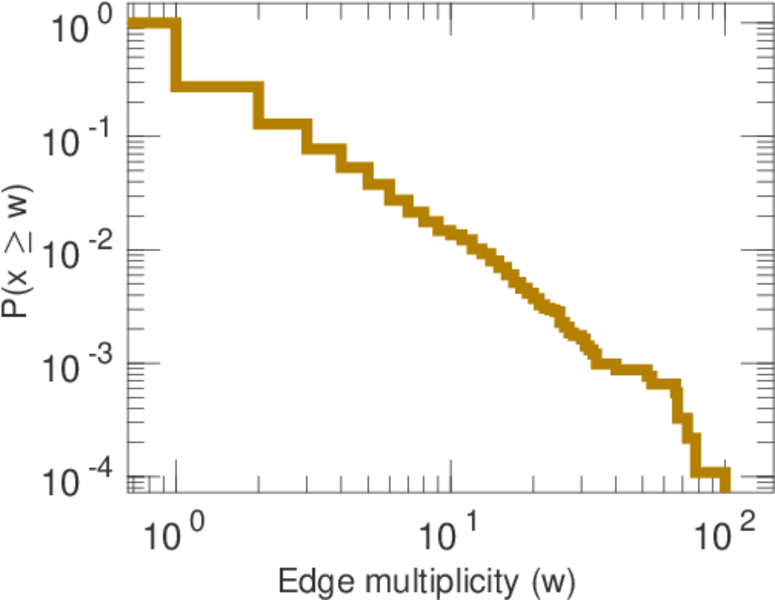
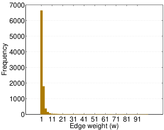
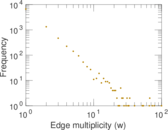
verse. The edge multiplicity denotes how often two nouns occured together.
Metadata
Statistics
| Size | n = | 1,773
|
| Volume | m = | 16,401
|
| Unique edge count | m̿ = | 9,131
|
| Loop count | l = | 0
|
| Wedge count | s = | 368,148
|
| Claw count | z = | 17,750,527
|
| Cross count | x = | 1,124,672,369
|
| Triangle count | t = | 19,966
|
| Square count | q = | 321,883
|
| 4-Tour count | T4 = | 4,065,918
|
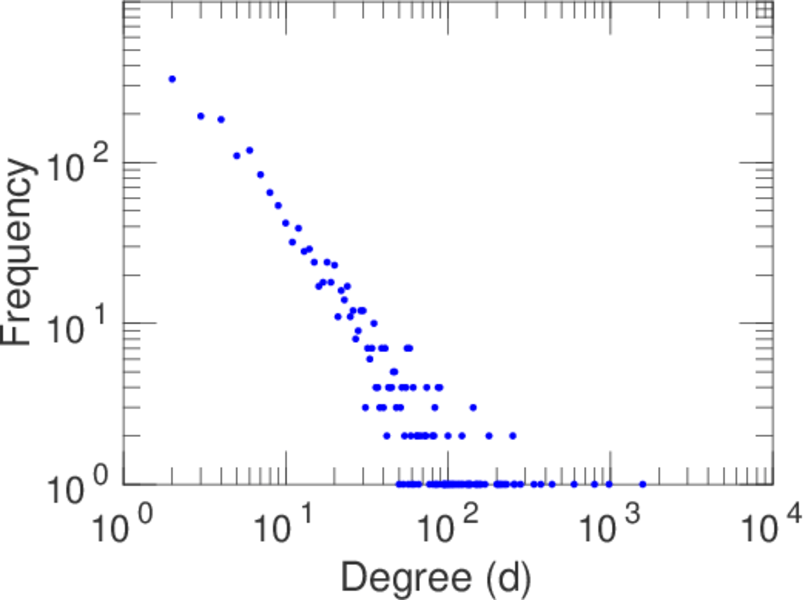
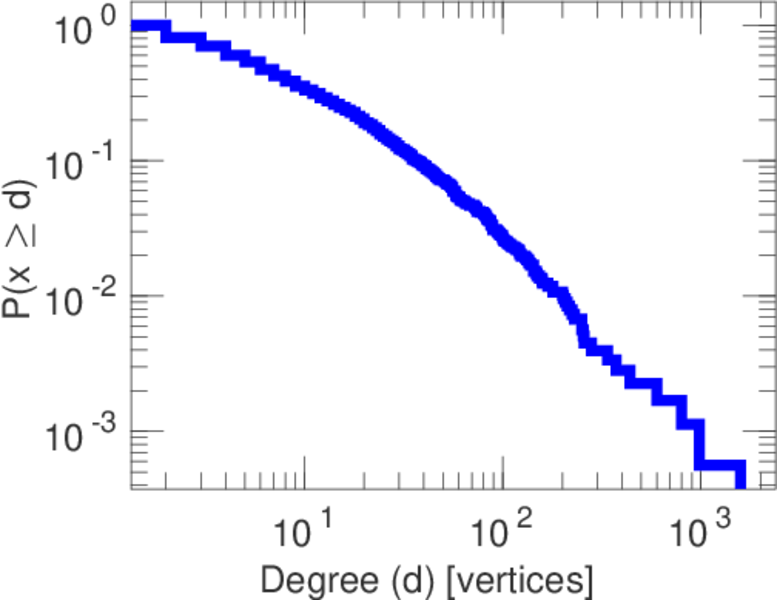
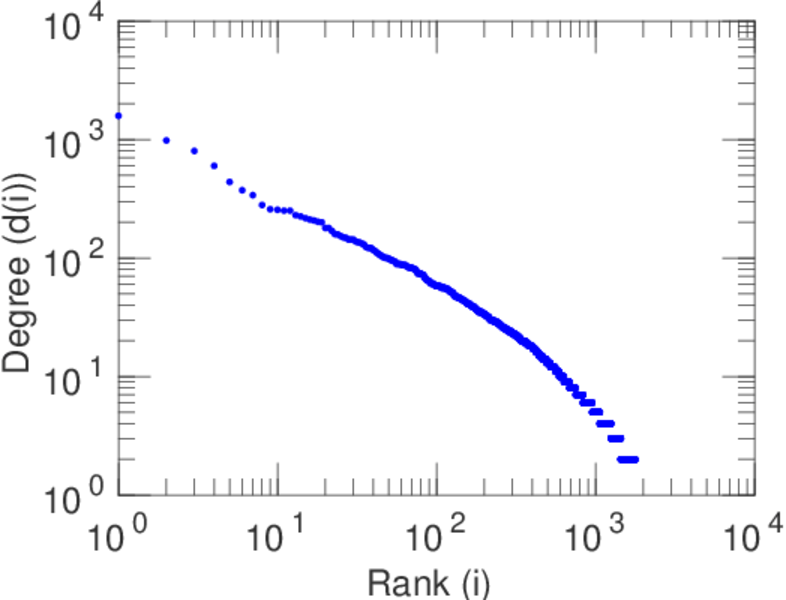
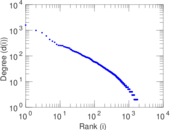
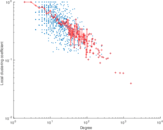
| Maximum degree | dmax = | 364
|
| Average degree | d = | 18.500 8
|
| Fill | p = | 0.005 812 67
|
| Average edge multiplicity | m̃ = | 1.796 19
|
| Size of LCC | N = | 1,707
|
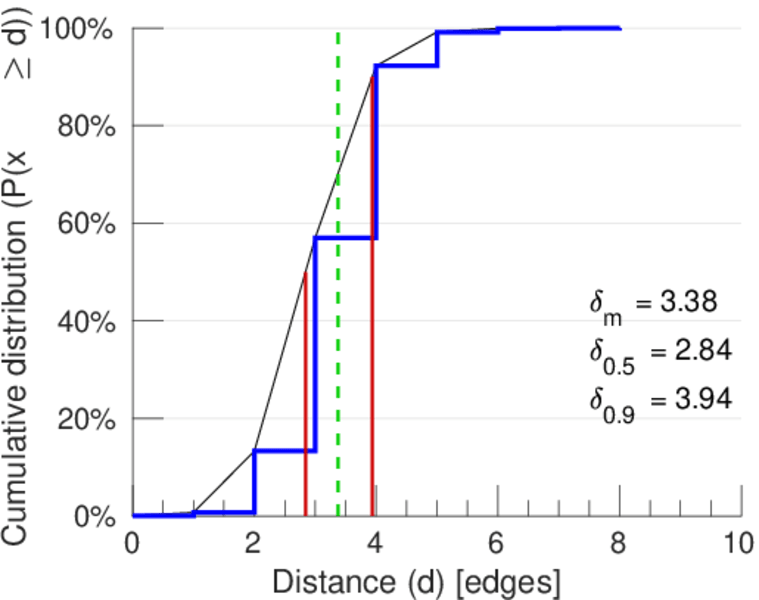
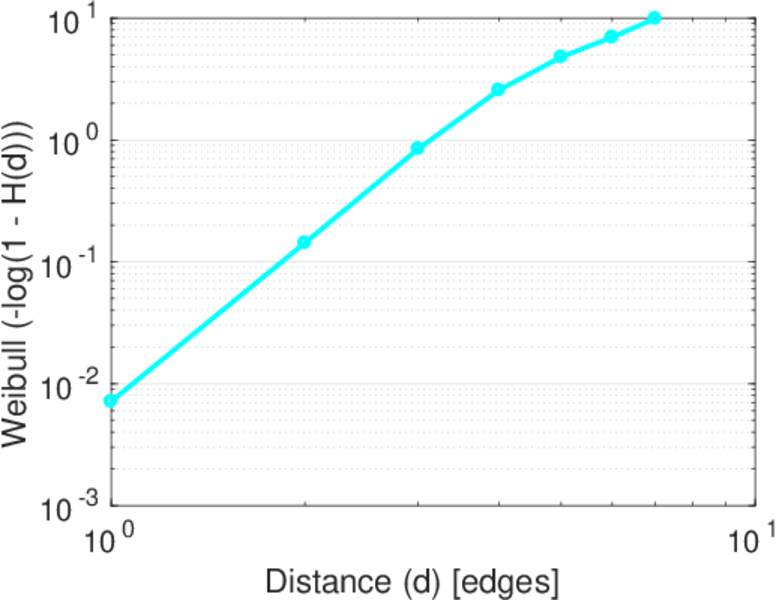
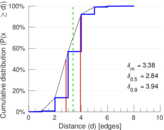
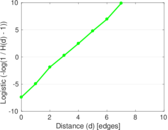
| Diameter | δ = | 8
|
| 50-Percentile effective diameter | δ0.5 = | 2.839 84
|
| 90-Percentile effective diameter | δ0.9 = | 3.936 54
|
| Median distance | δM = | 3
|
| Mean distance | δm = | 3.376 34
|
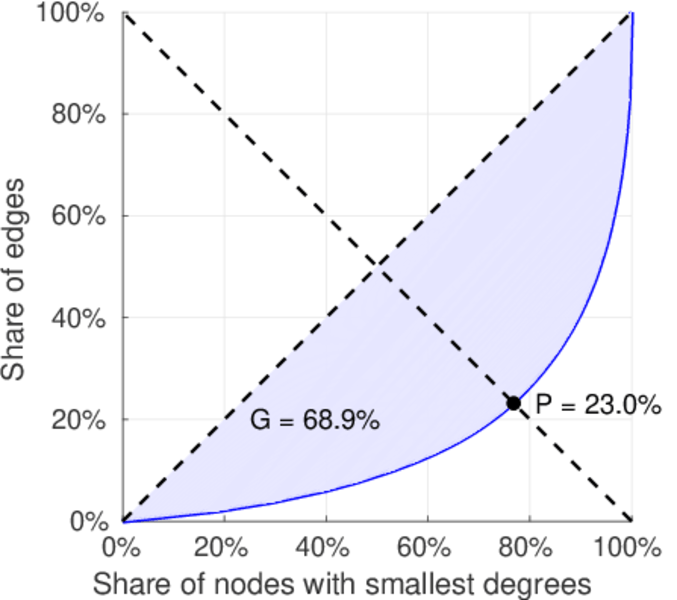
| Gini coefficient | G = | 0.688 745
|
| Balanced inequality ratio | P = | 0.230 169
|
| Relative edge distribution entropy | Her = | 0.914 733
|
| Power law exponent | γ = | 1.907 14
|
| Tail power law exponent | γt = | 2.341 00
|
| Tail power law exponent with p | γ3 = | 2.341 00
|
| p-value | p = | 0.000 00
|
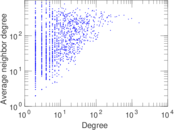
| Degree assortativity | ρ = | −0.048 849 7
|
| Degree assortativity p-value | pρ = | 3.978 12 × 10−11
|
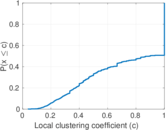
| Clustering coefficient | c = | 0.162 701
|
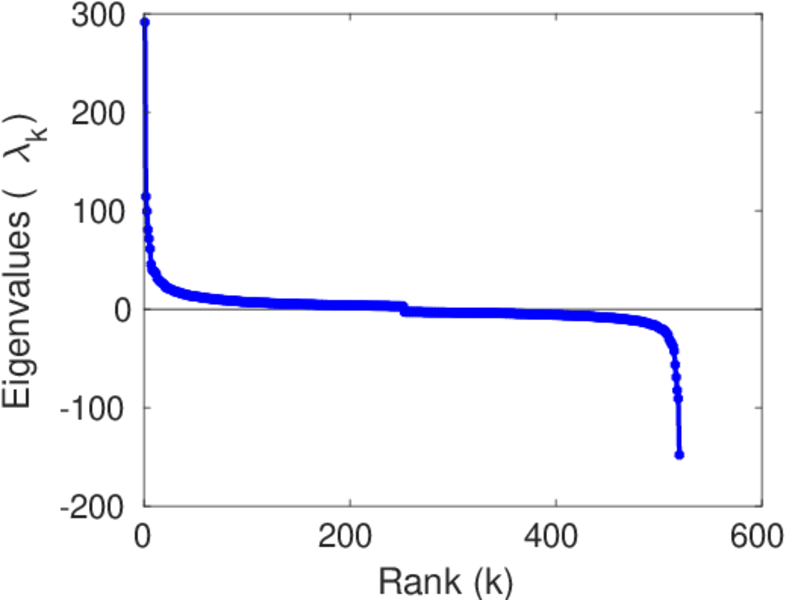
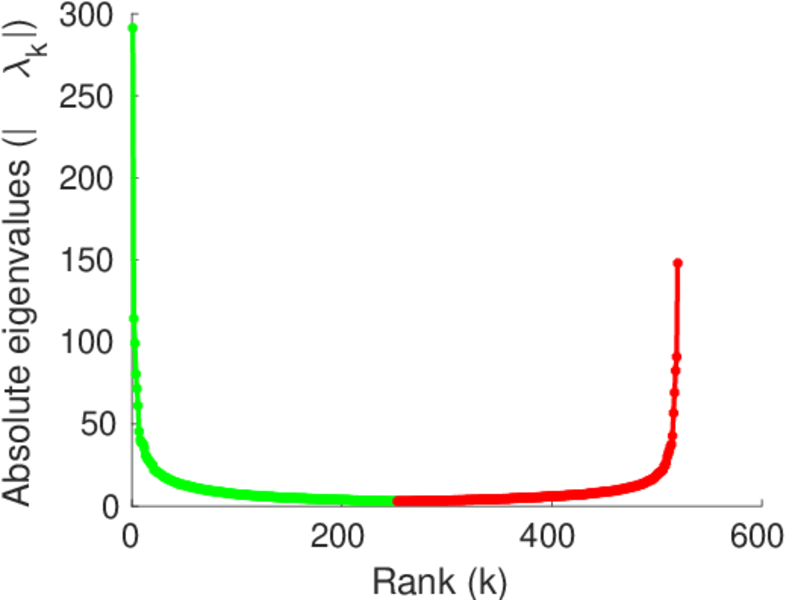
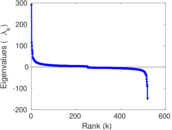
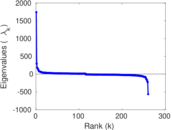
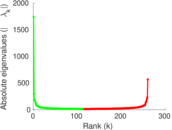
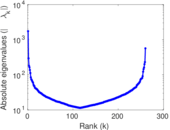
| Spectral norm | α = | 291.251
|
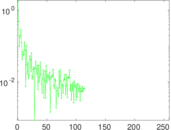
| Algebraic connectivity | a = | 0.234 757
|
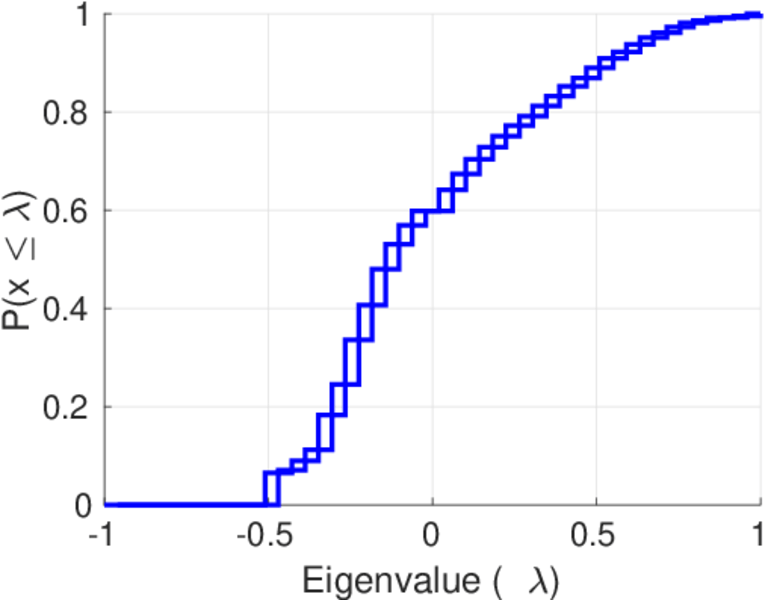
| Spectral separation | |λ1[A] / λ2[A]| = | 1.968 42
|
| Non-bipartivity | bA = | 0.491 978
|
| Normalized non-bipartivity | bN = | 0.403 984
|
| Algebraic non-bipartivity | χ = | 0.983 261
|
| Spectral bipartite frustration | bK = | 0.023 159 6
|
| Controllability | C = | 43
|
| Relative controllability | Cr = | 0.024 252 7
|
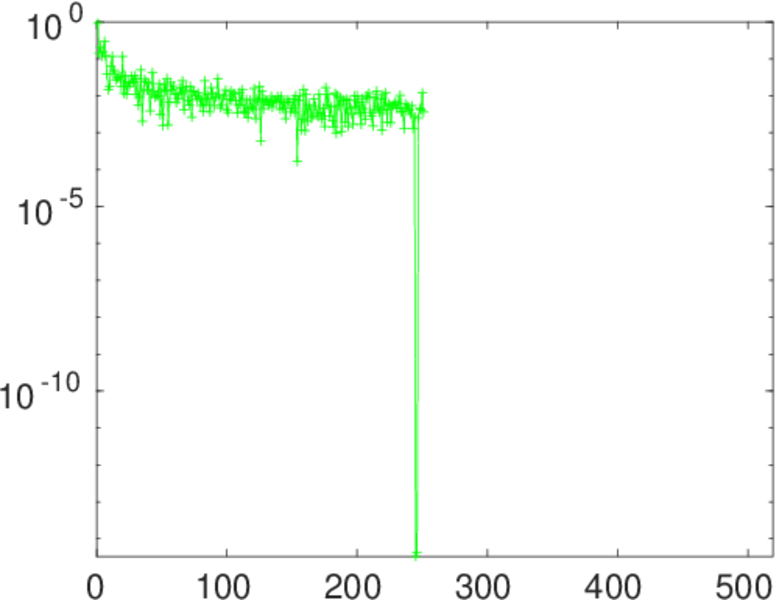
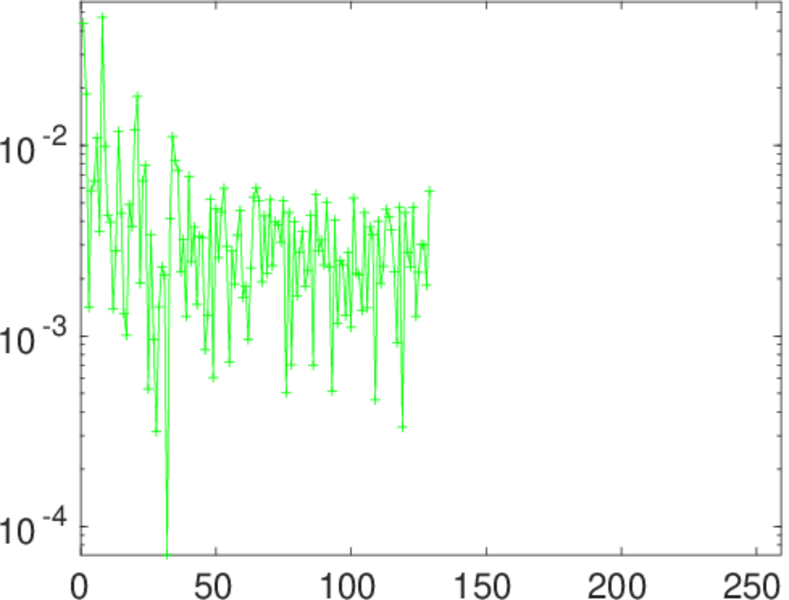
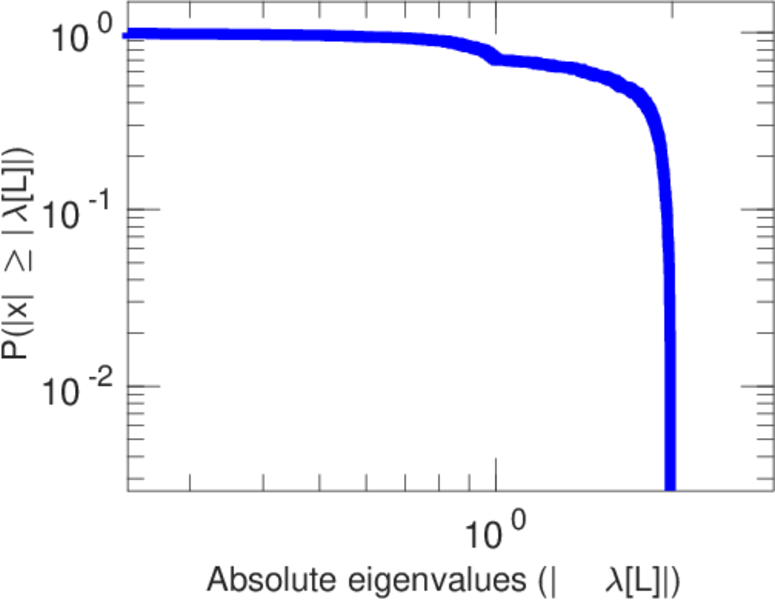
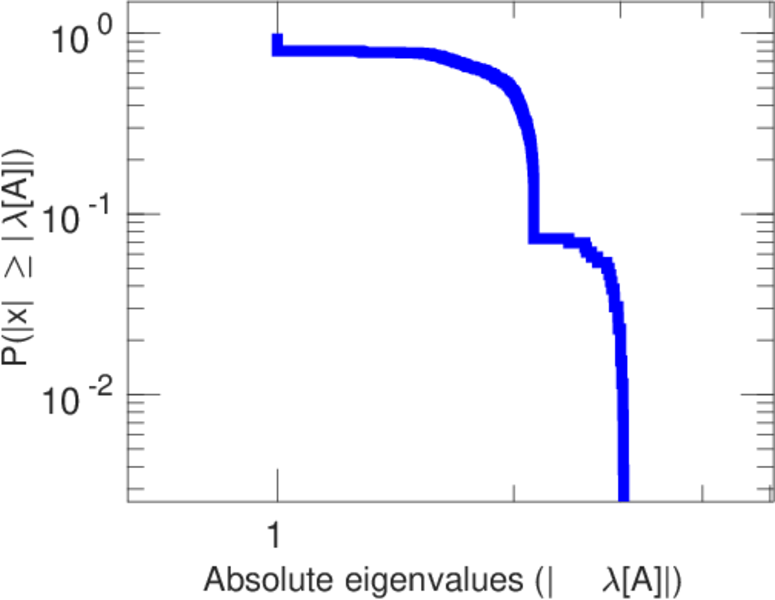
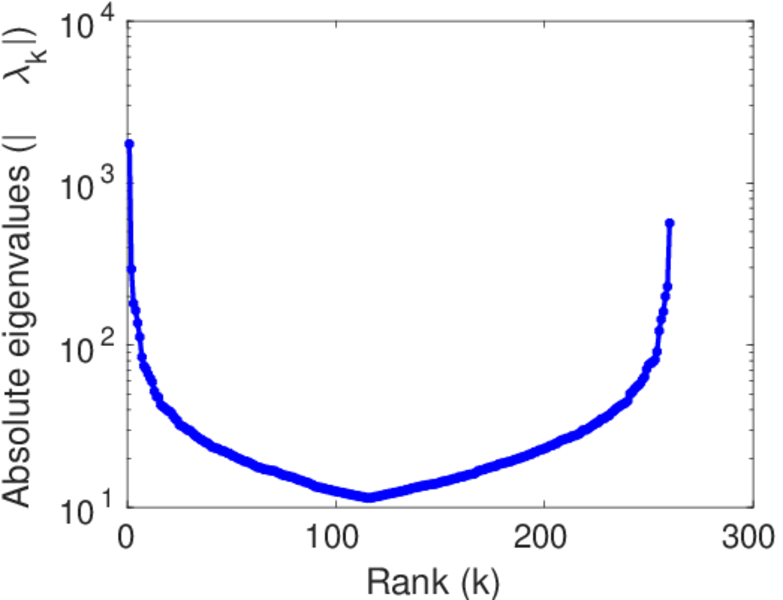
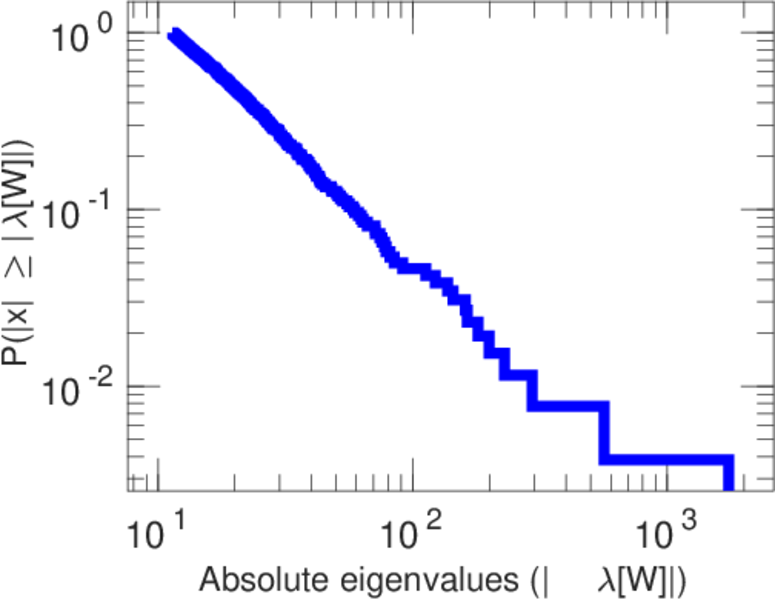
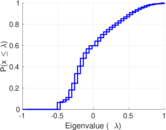
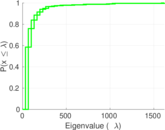
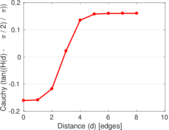
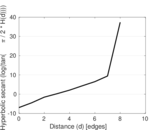
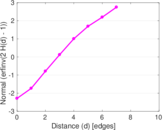
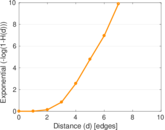
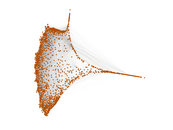
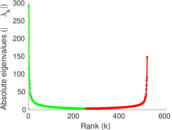
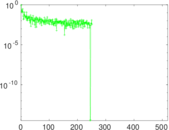
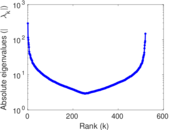
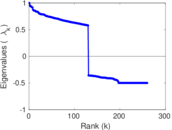
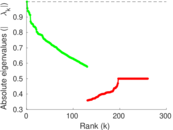
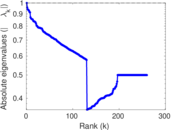
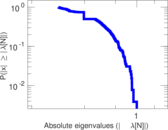
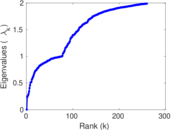
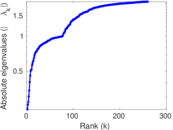
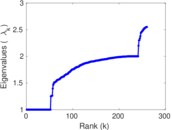
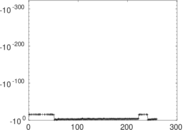
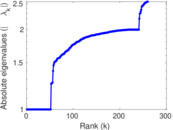
Plots


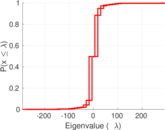

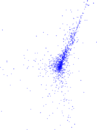
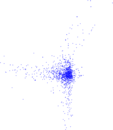


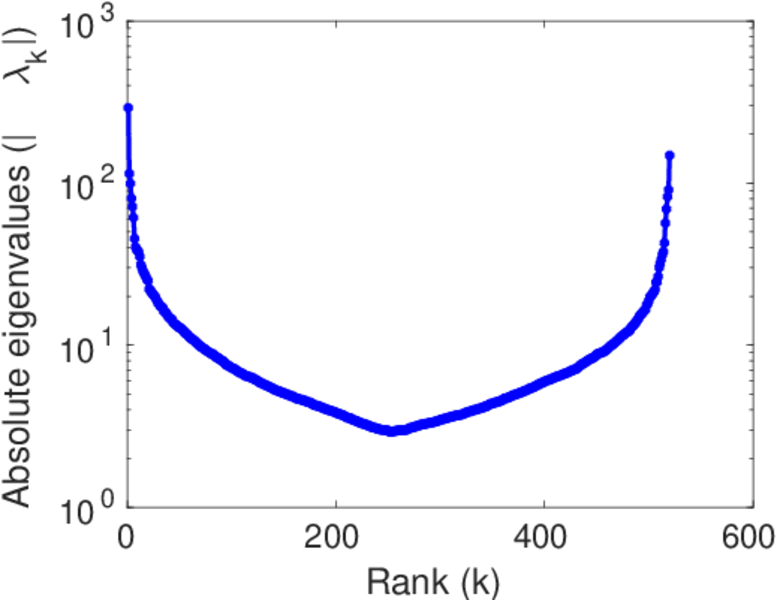
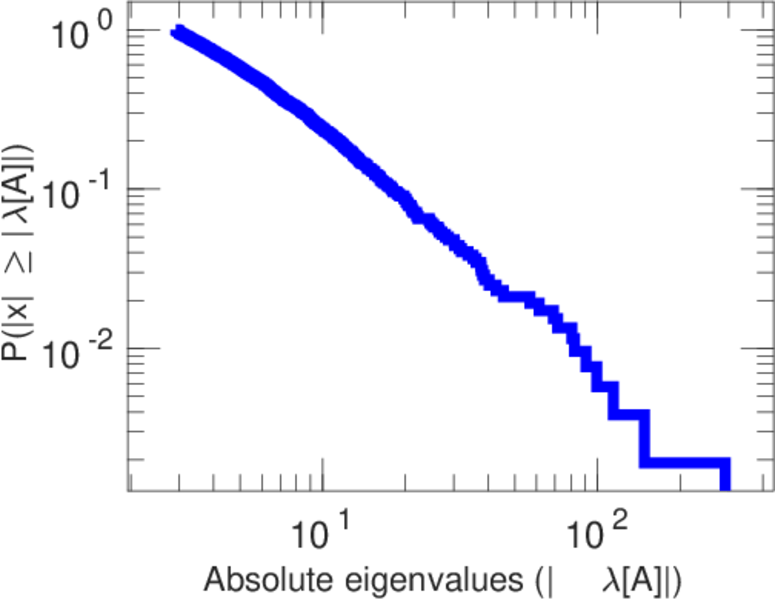
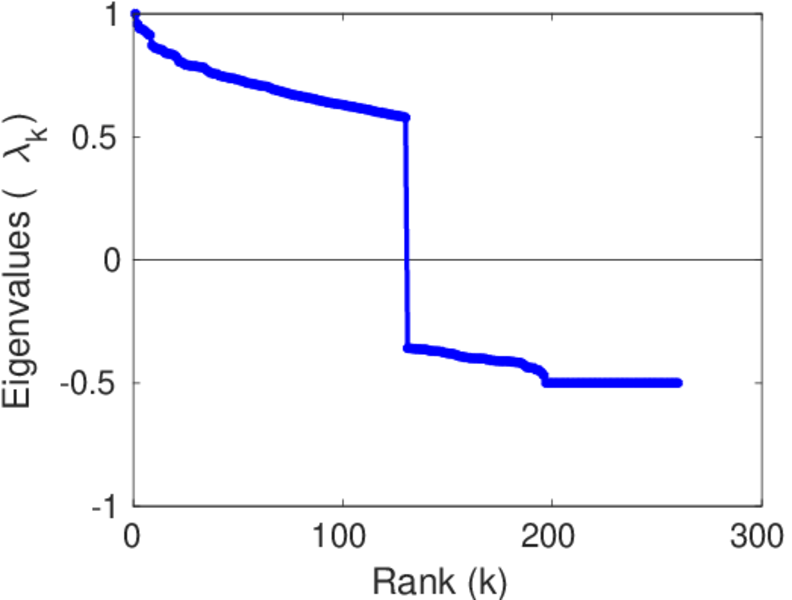
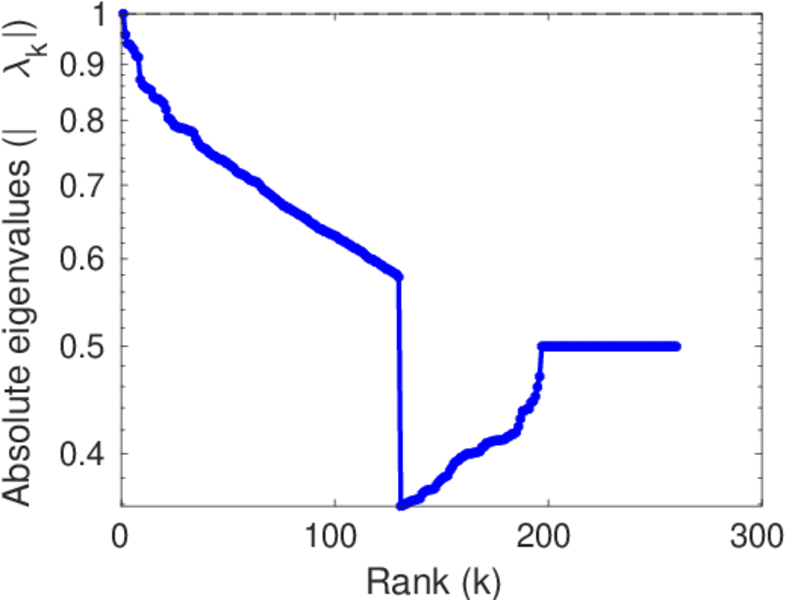
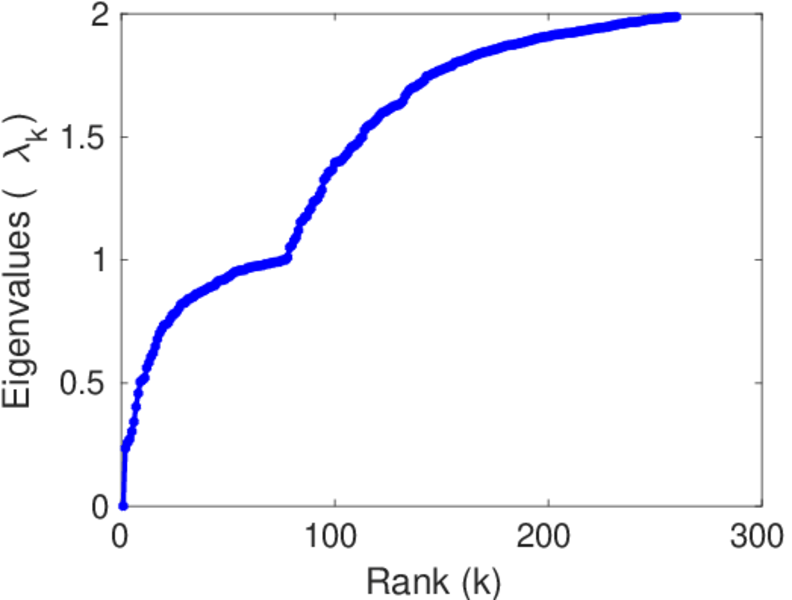
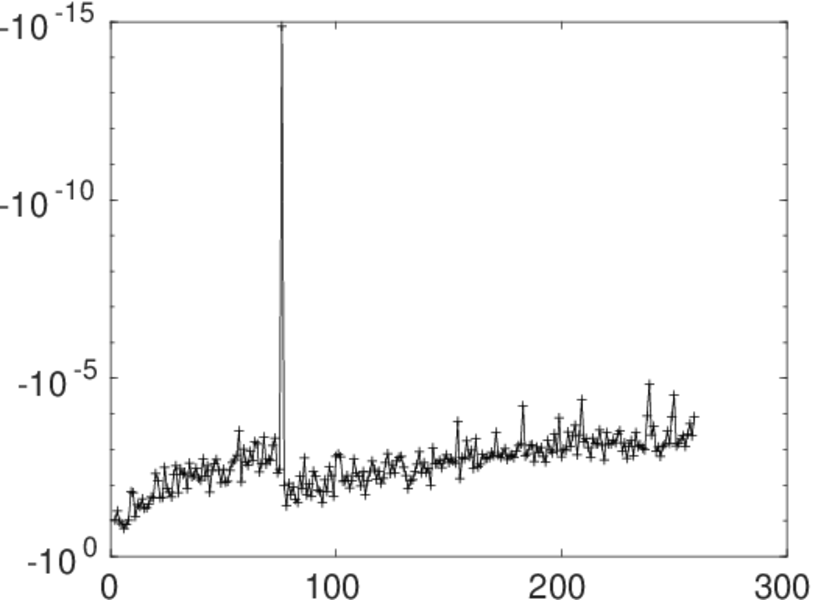
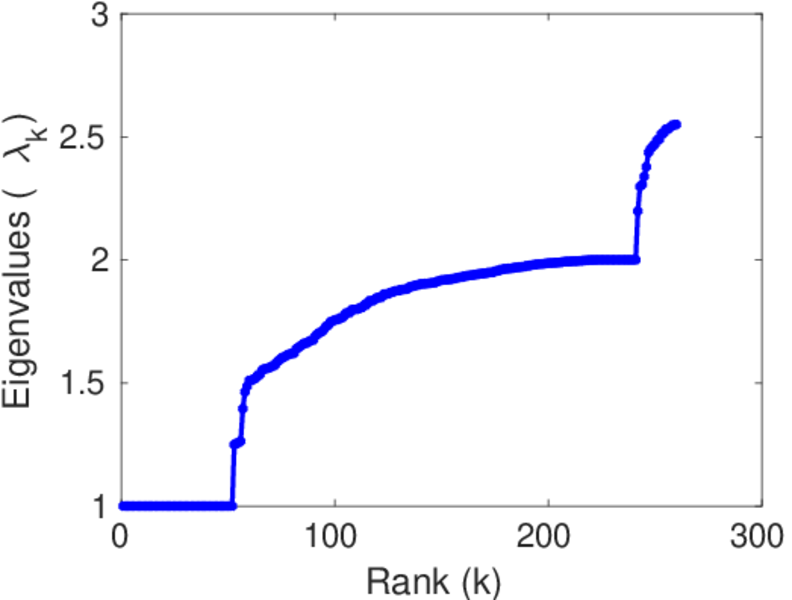
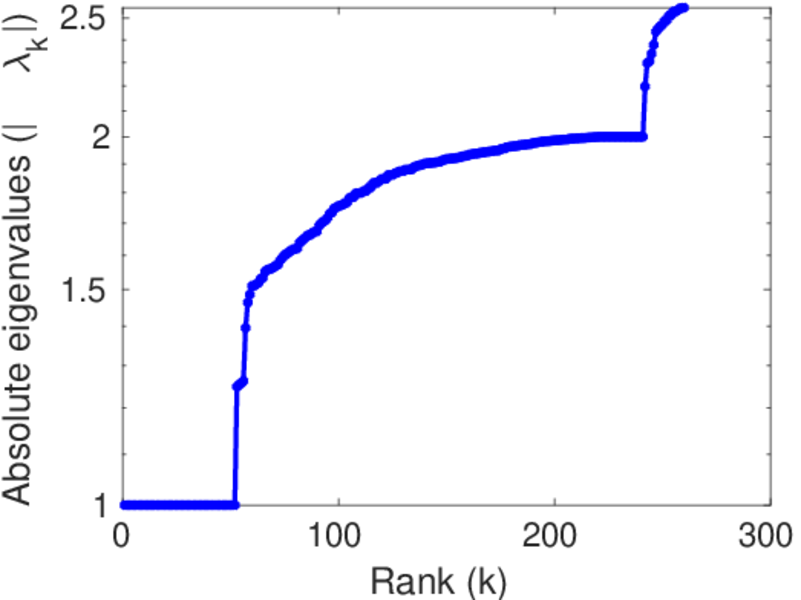
Matrix decompositions plots


Downloads
References
 KONECT ‣ Networks ‣
Buy Me a Coffee
KONECT ‣ Networks ‣
Buy Me a Coffee