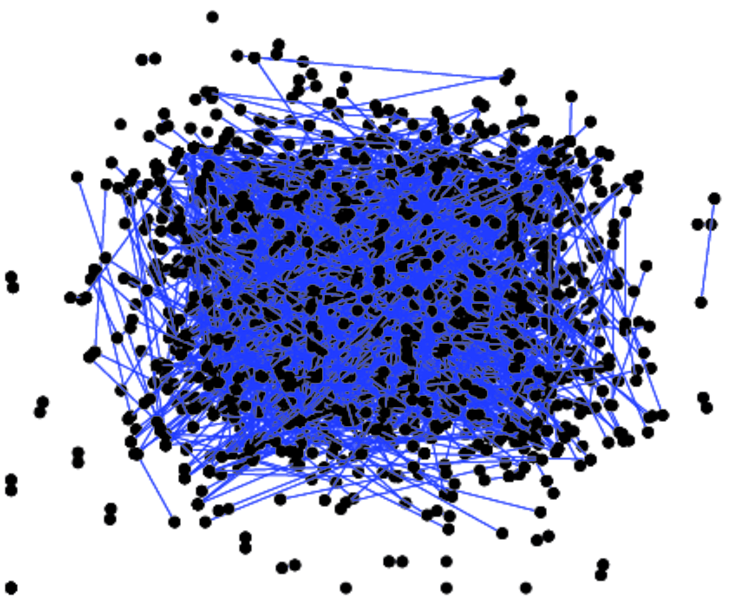
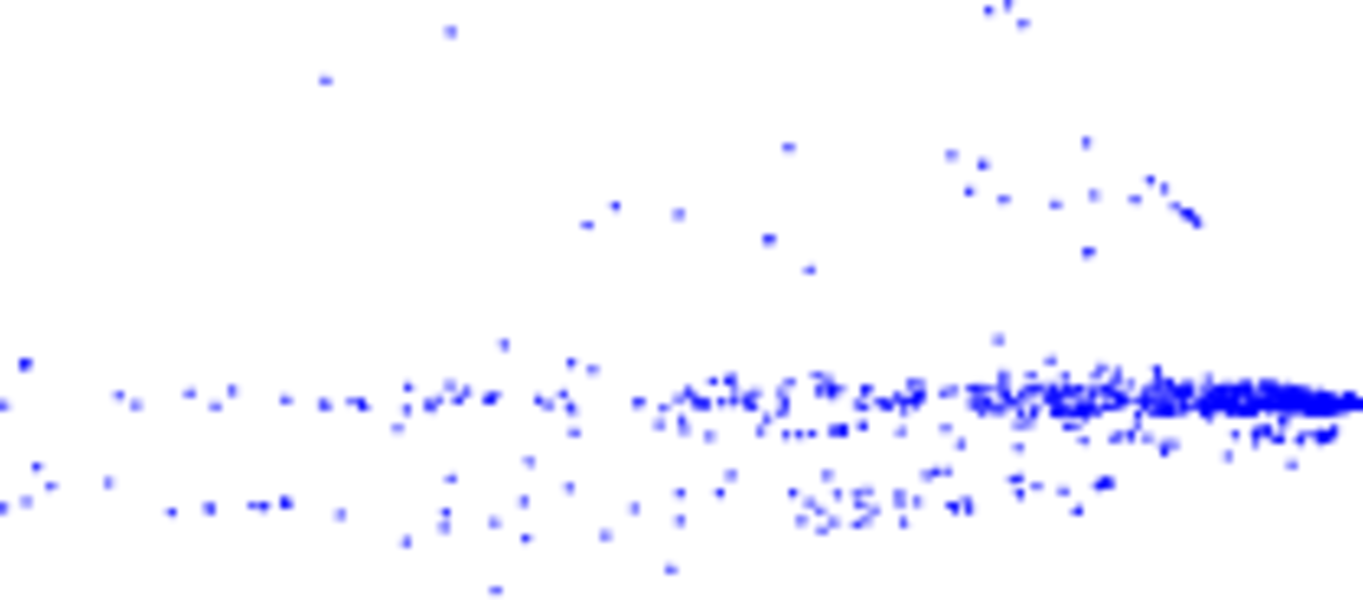
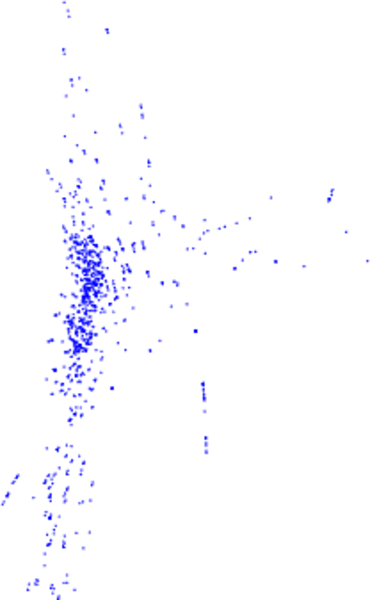
Yeast
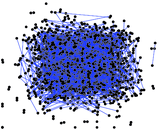
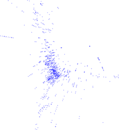
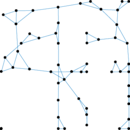
This undirected network contains protein interactions contained in yeast.
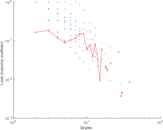
Research showed that proteins with a high degree were more important for the
surivial of the yeast than others. A node represents a protein and an edge
represents a metabolic interaction between two proteins. The network contains
loops.
Metadata
Statistics
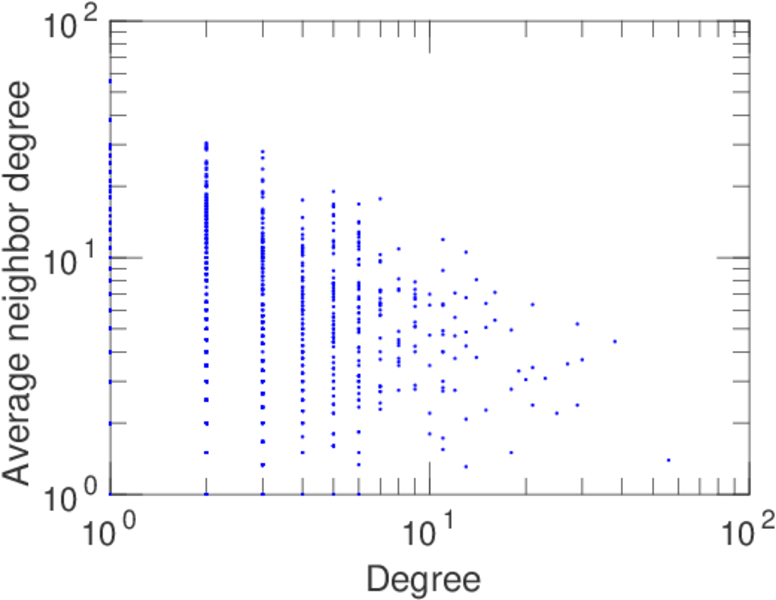
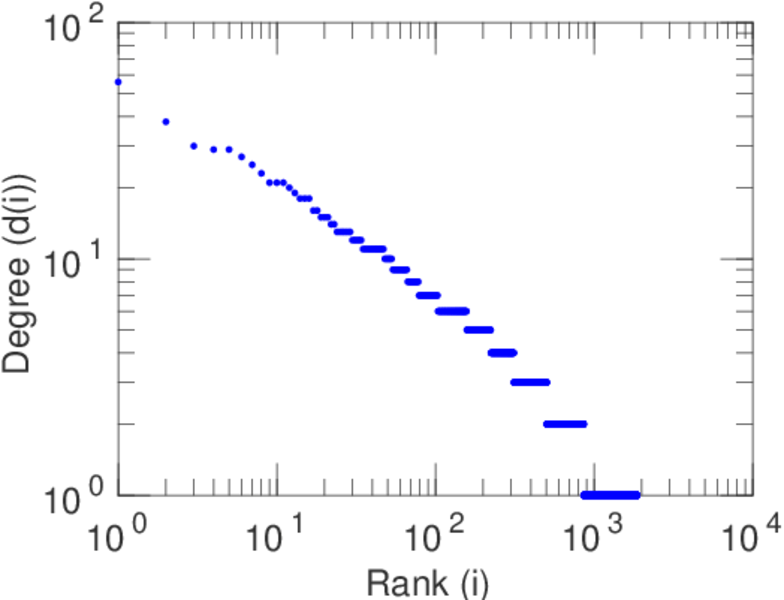
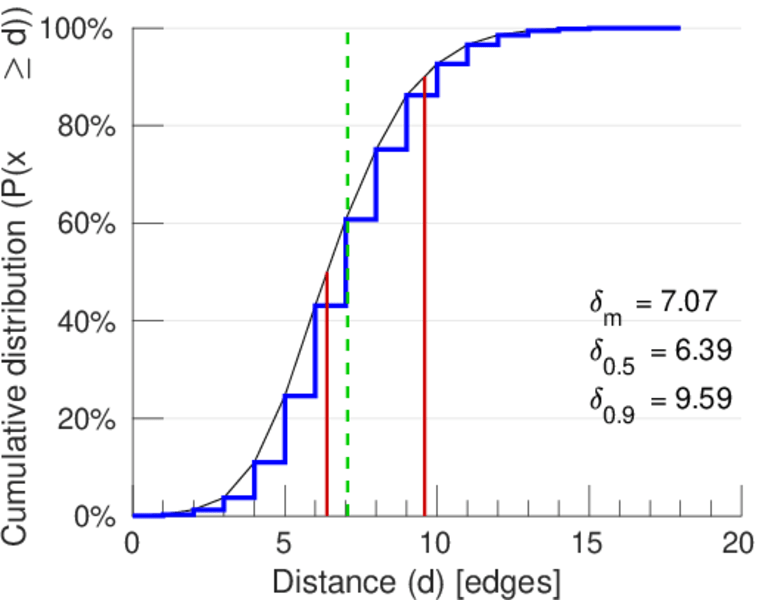
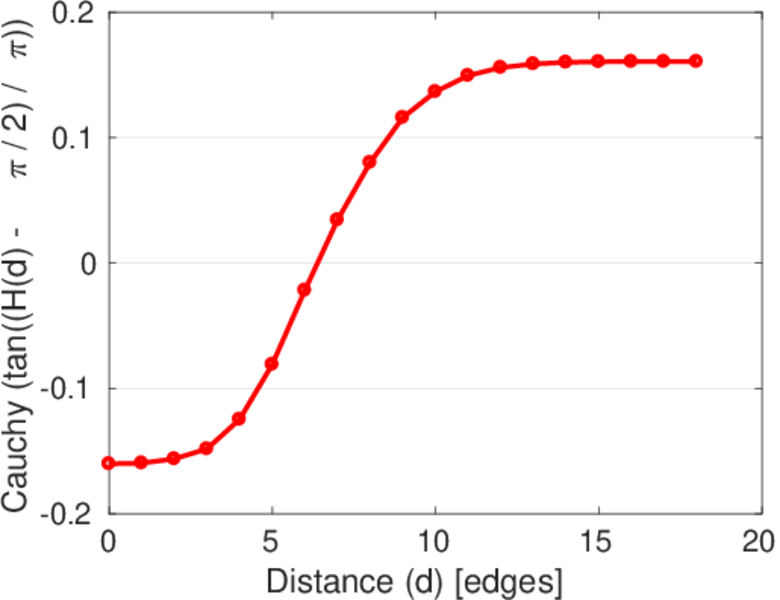
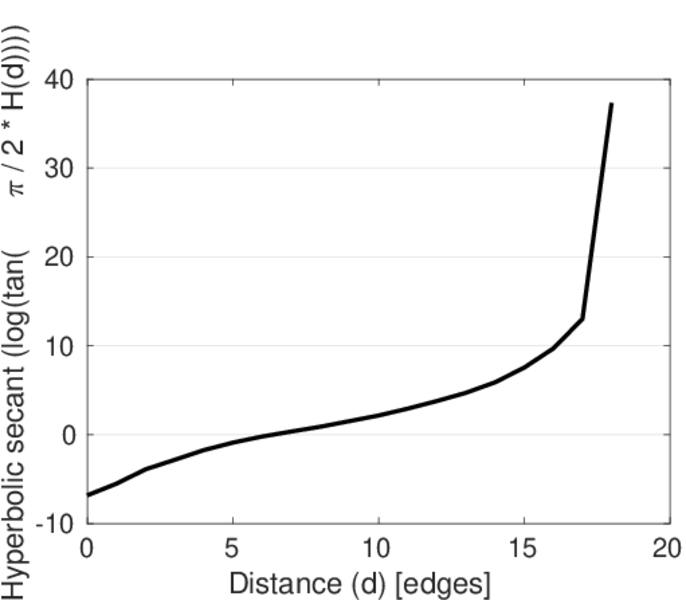
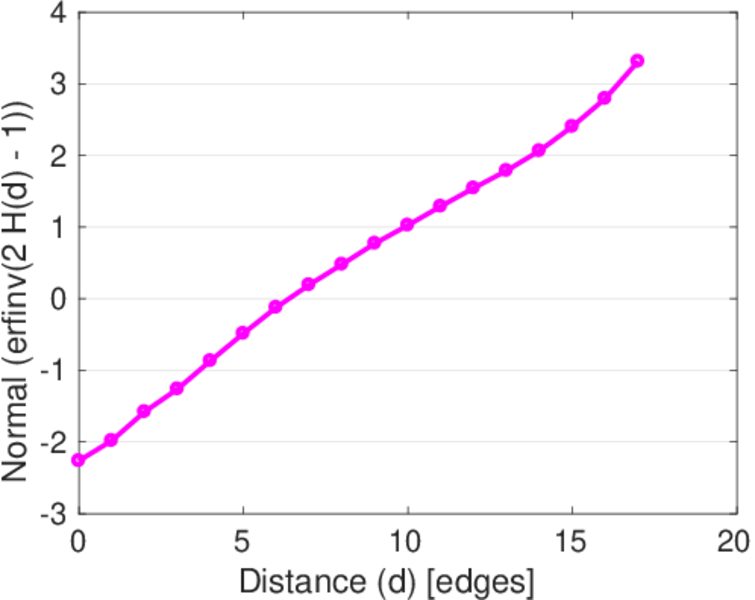
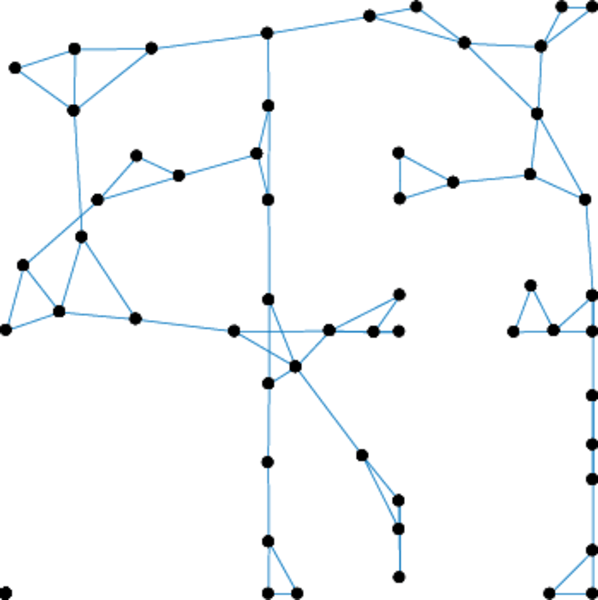
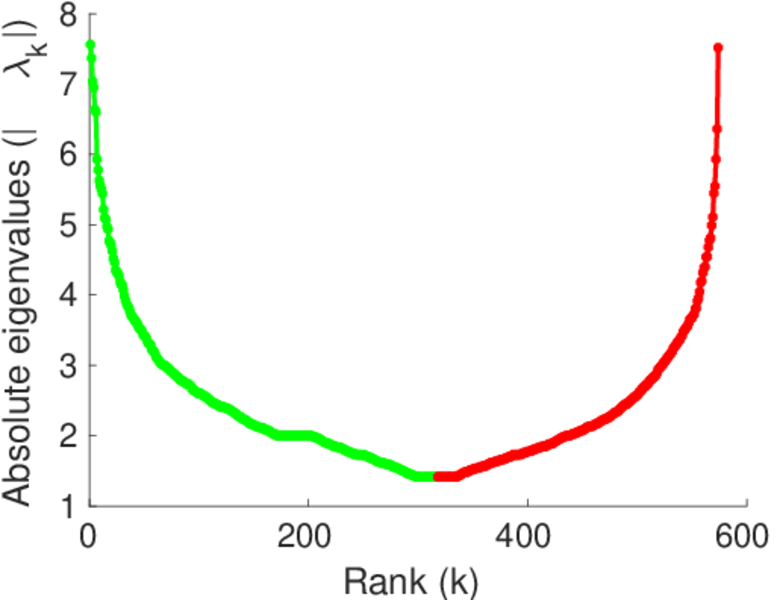
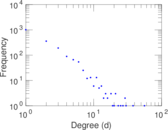
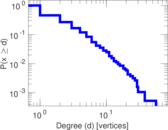
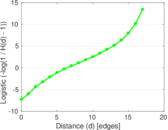
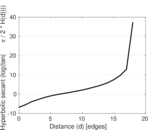
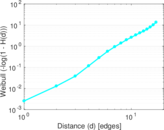
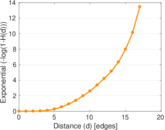
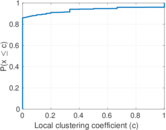
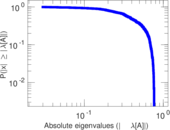
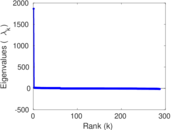
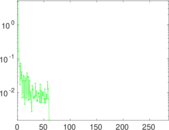
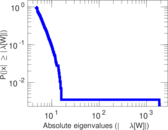
Plots

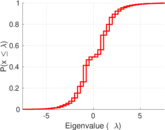

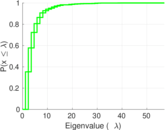


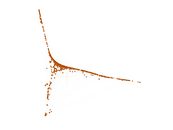
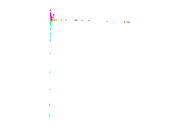

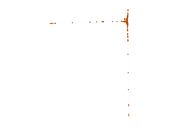

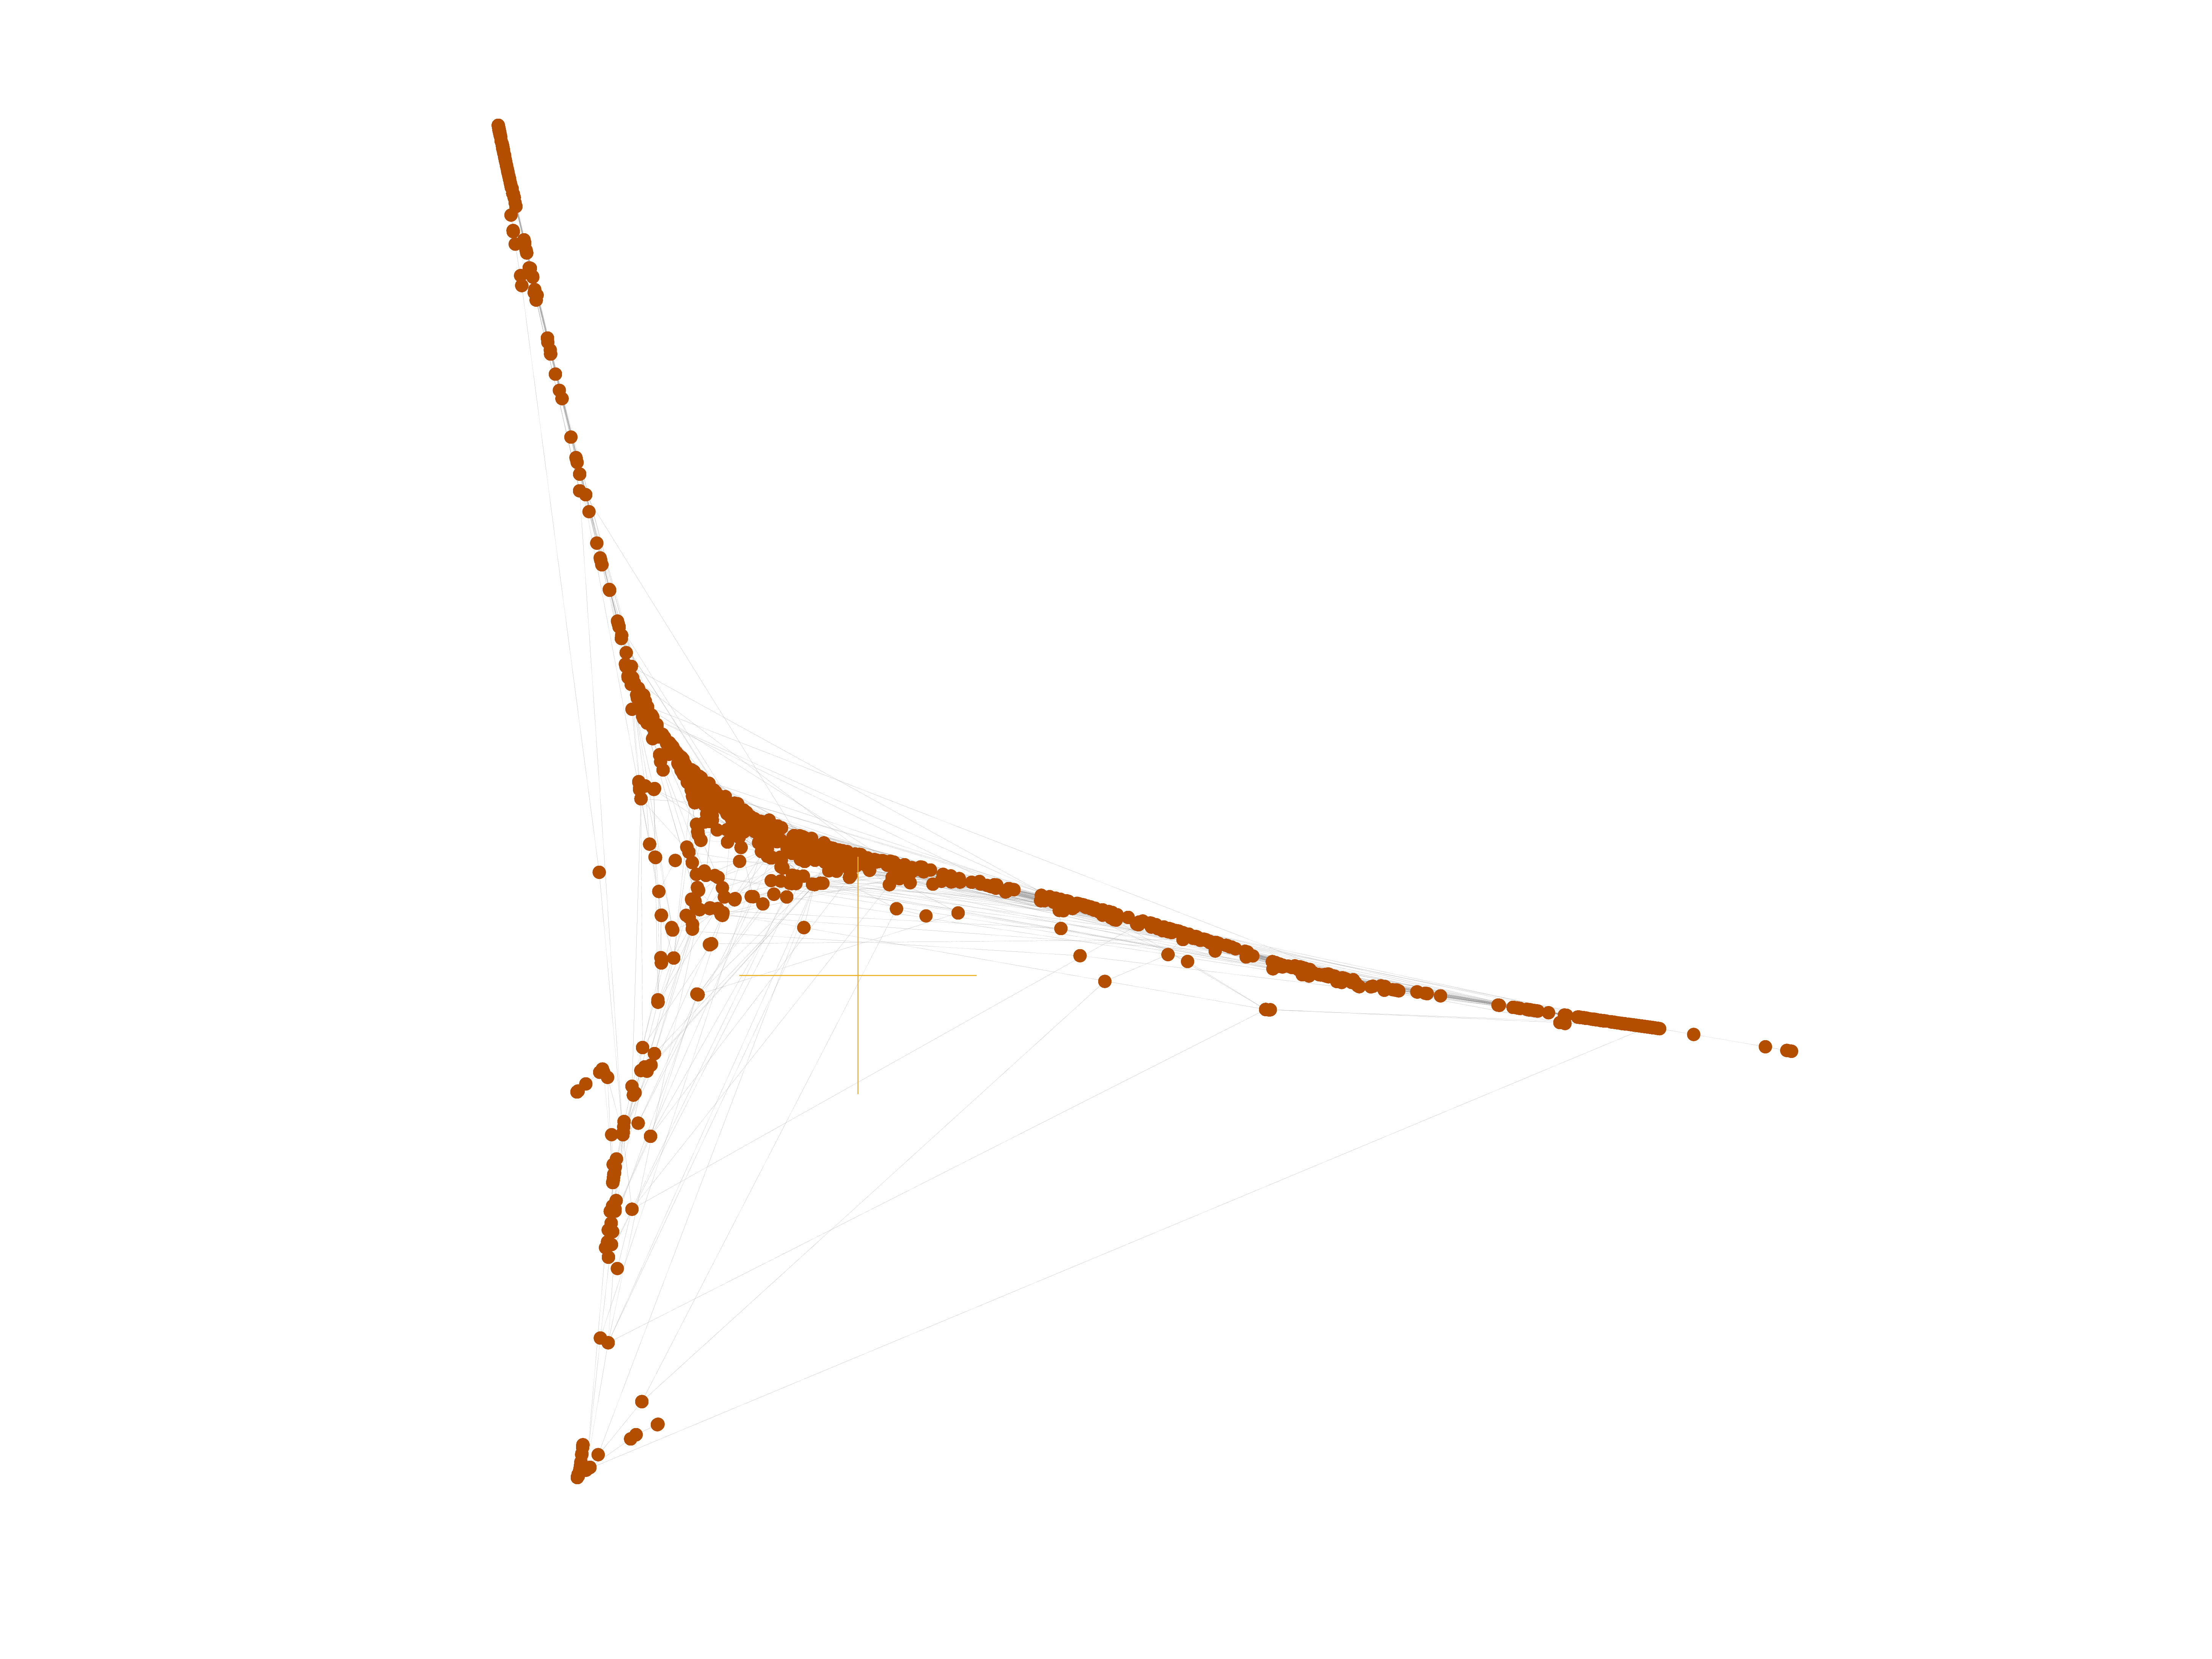
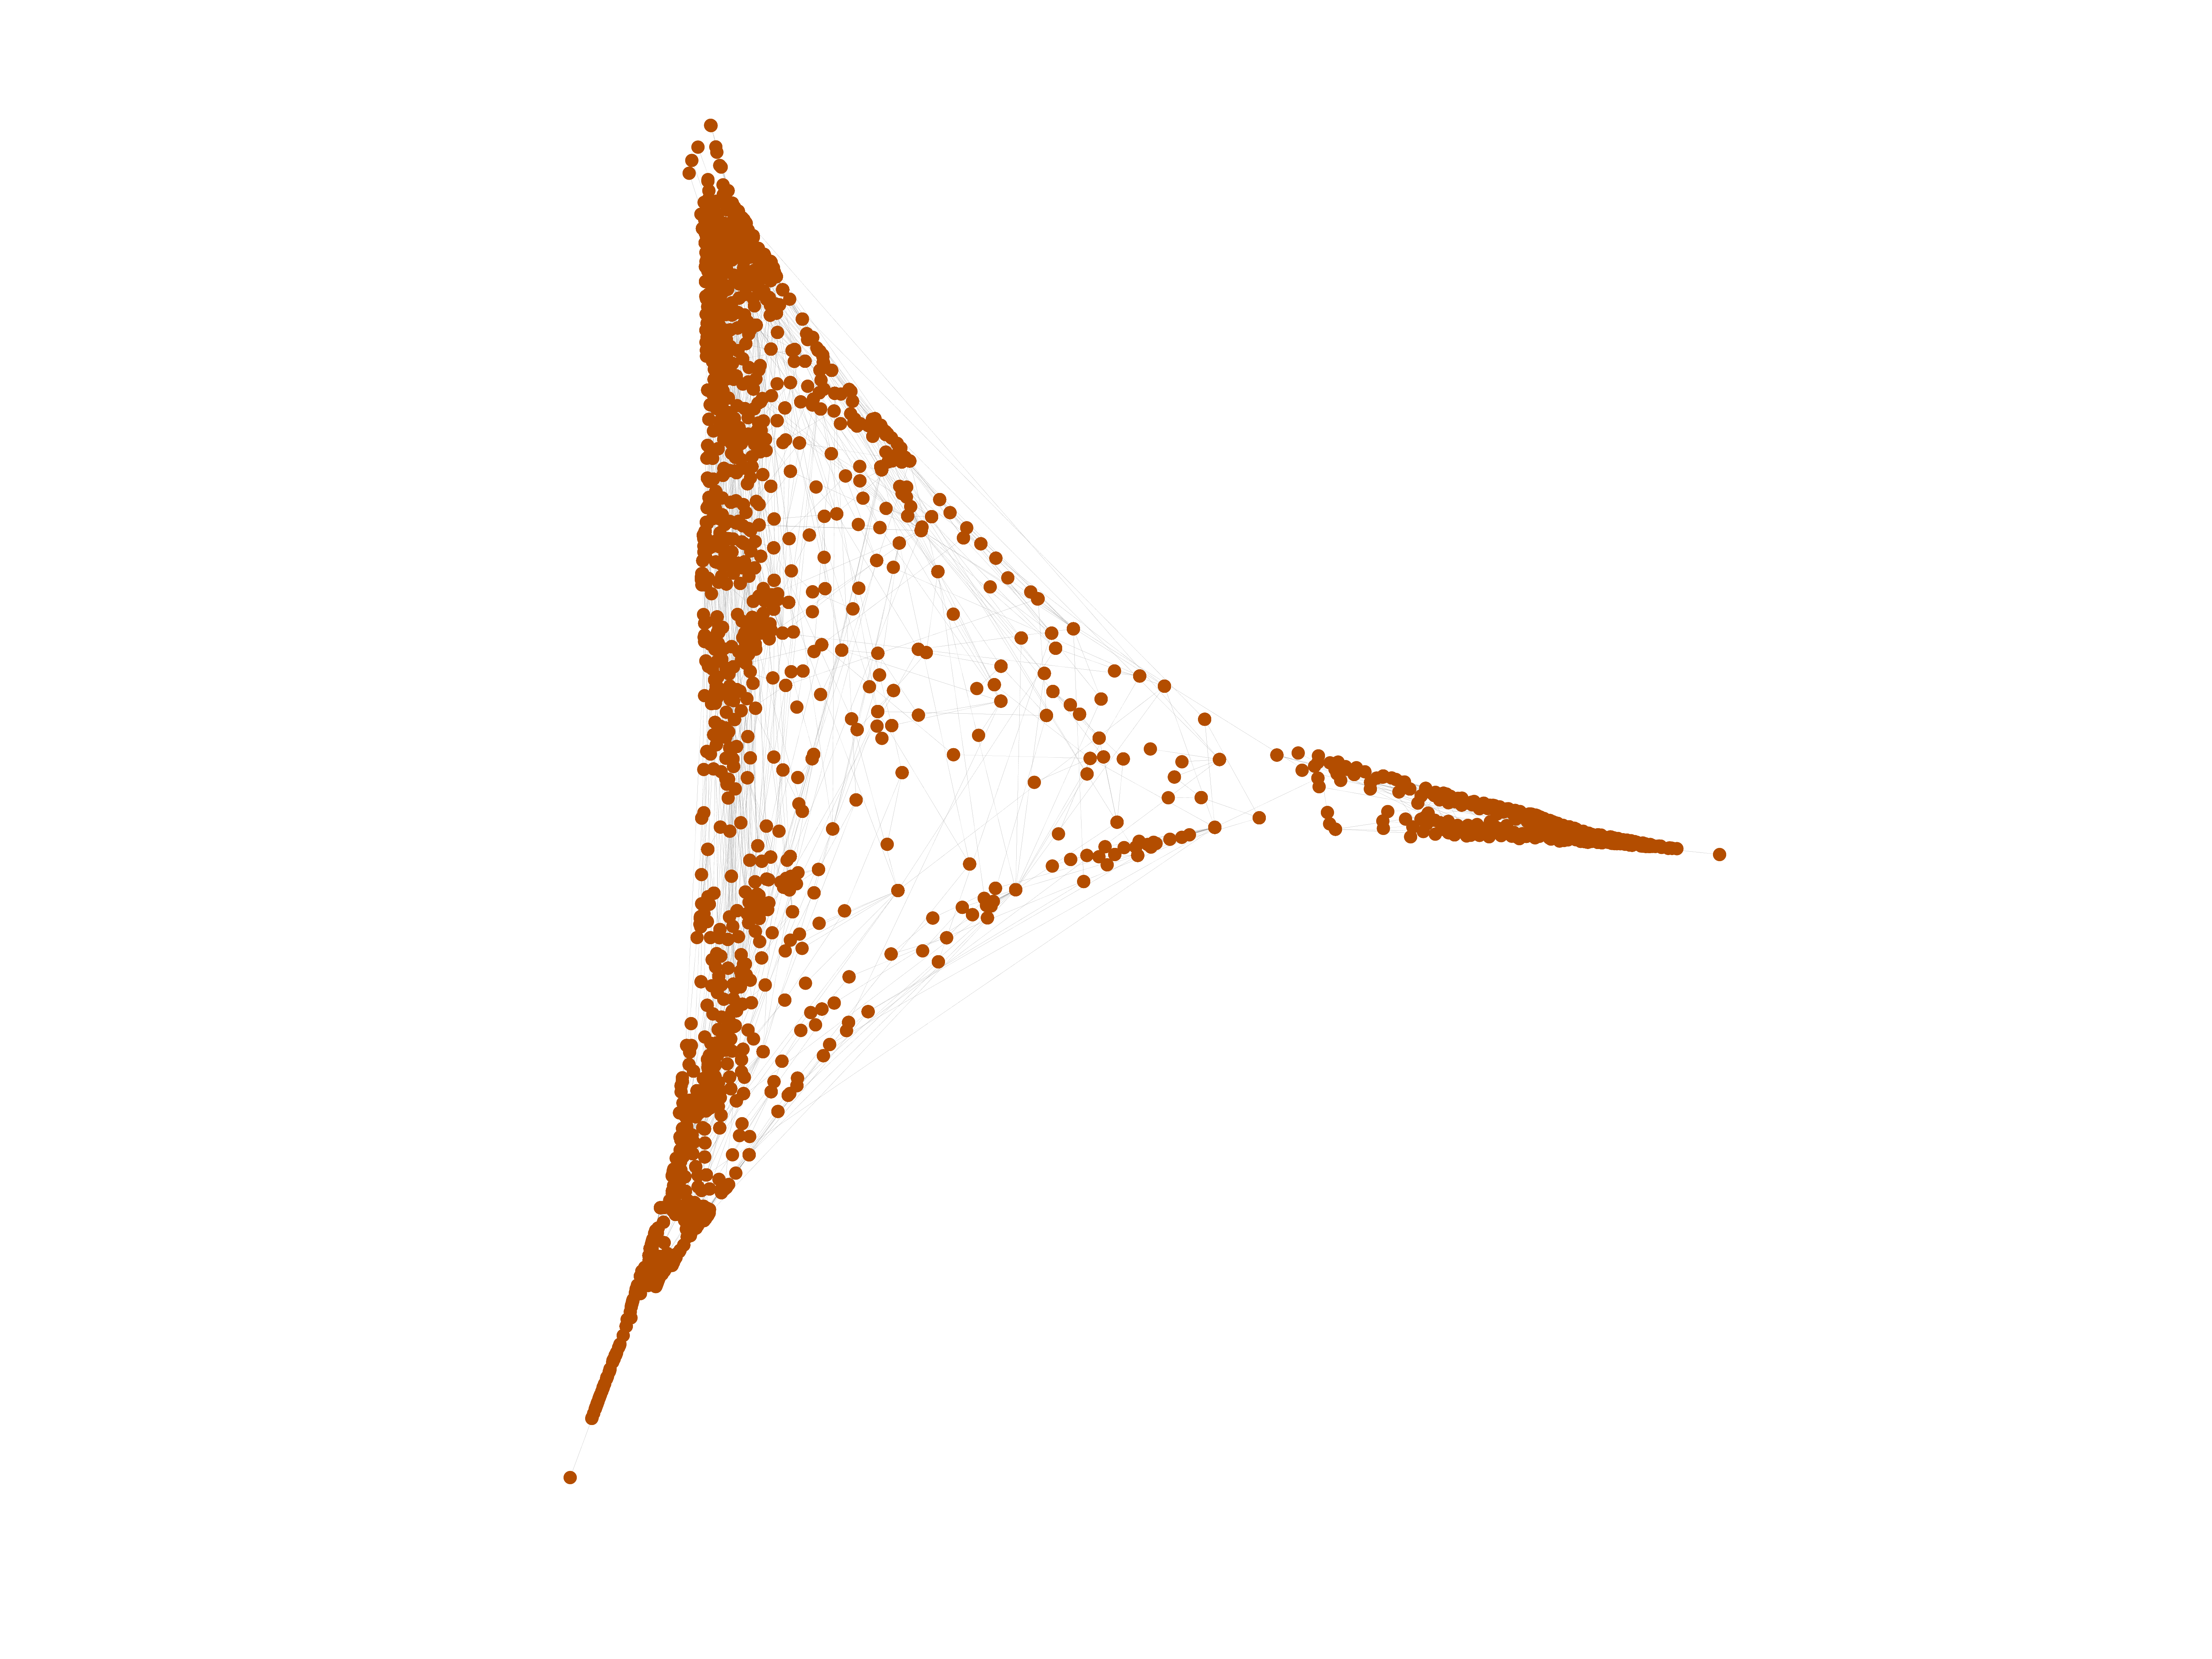
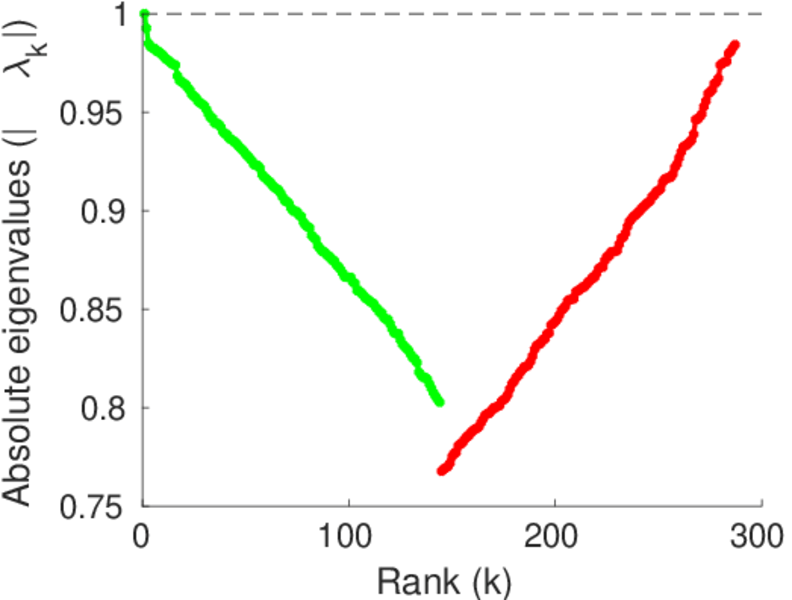
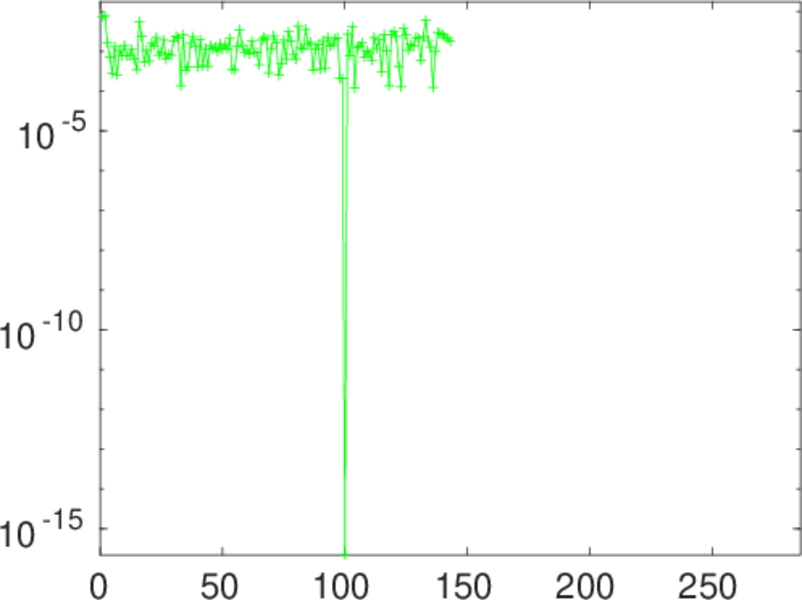
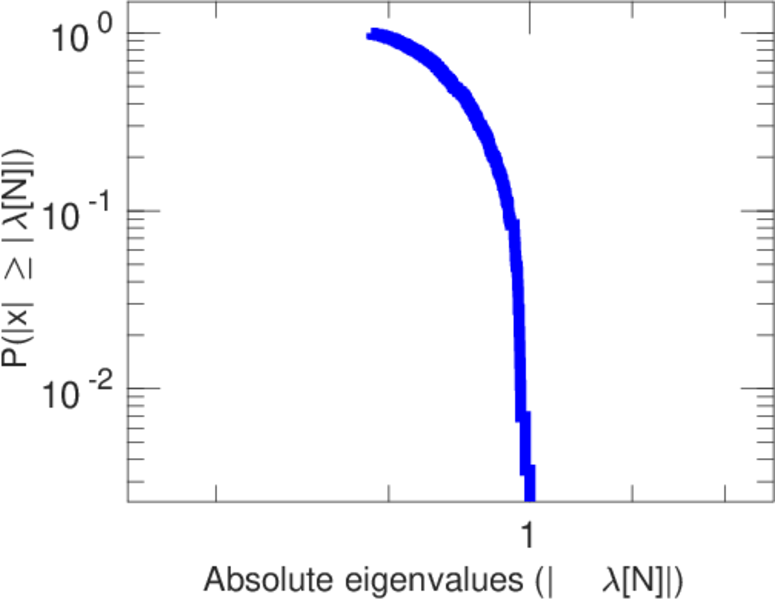
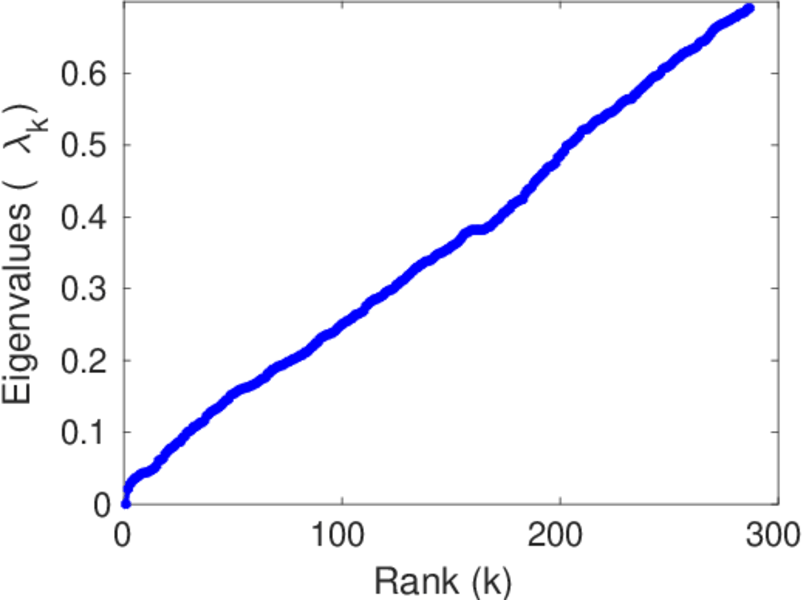
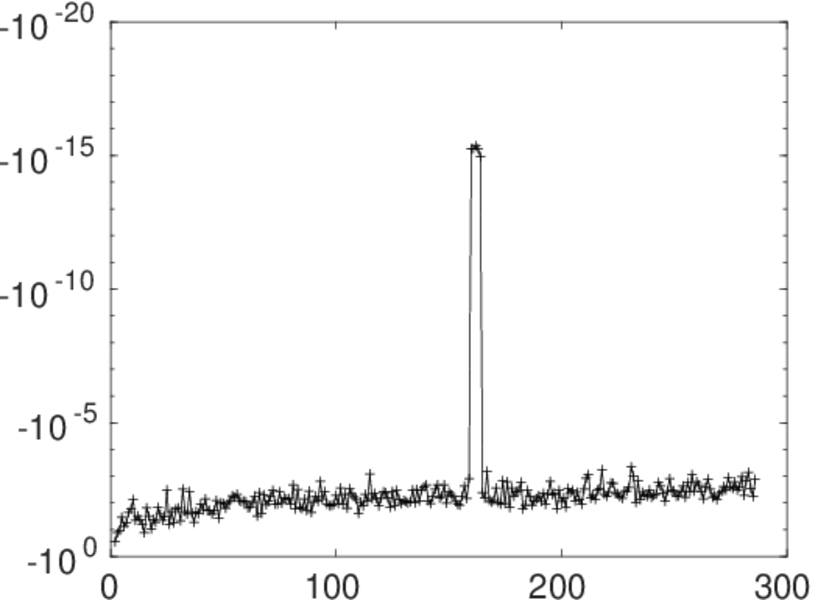
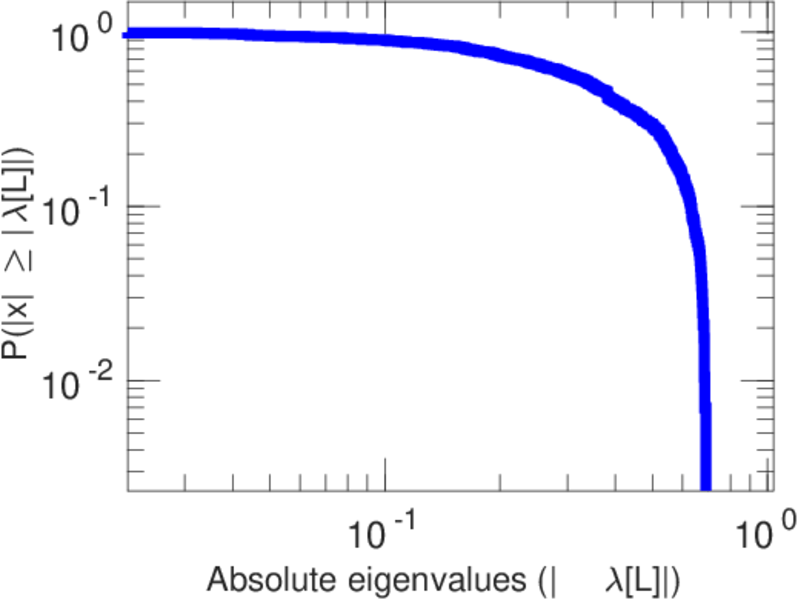
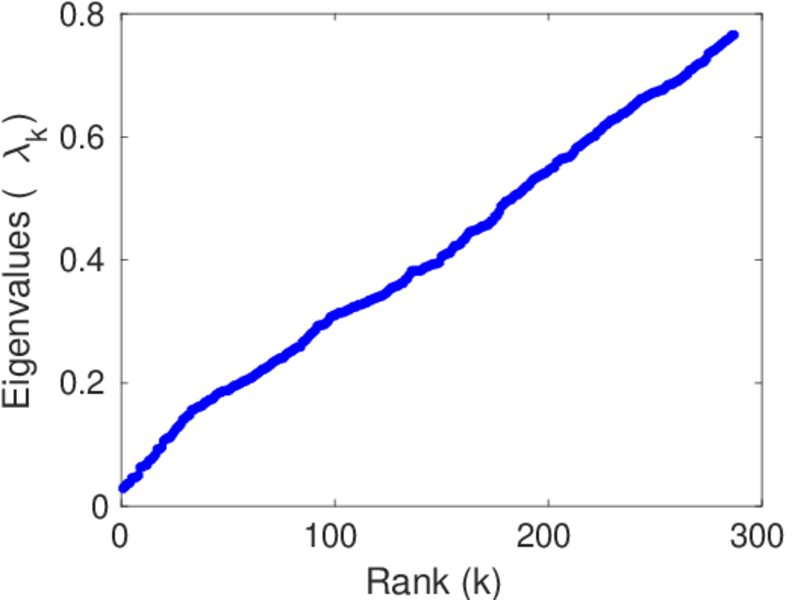
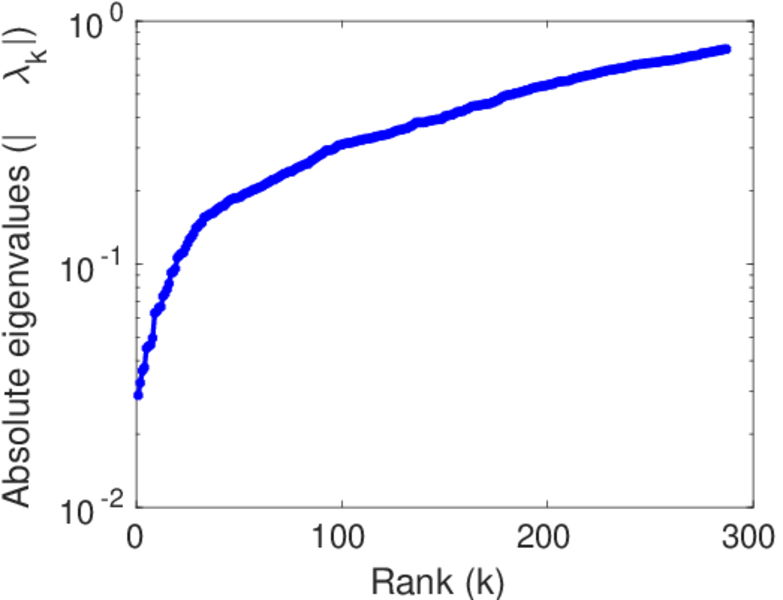
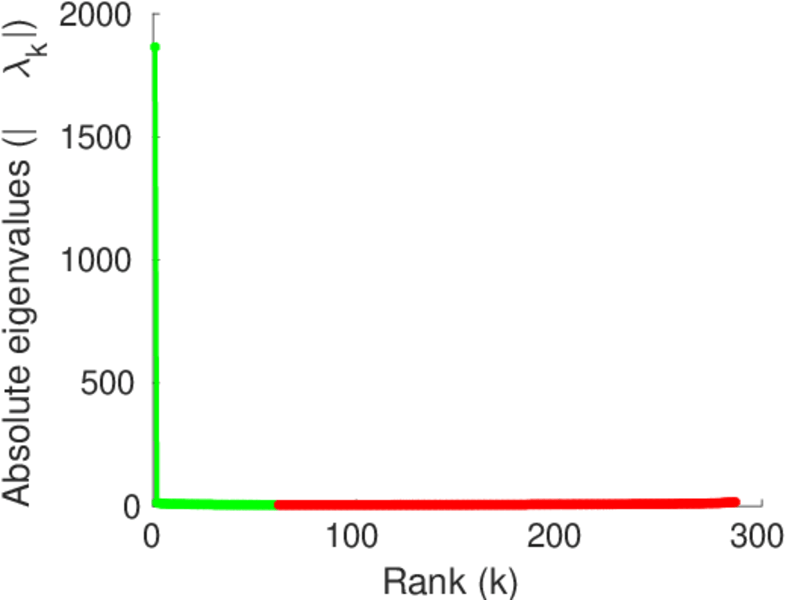
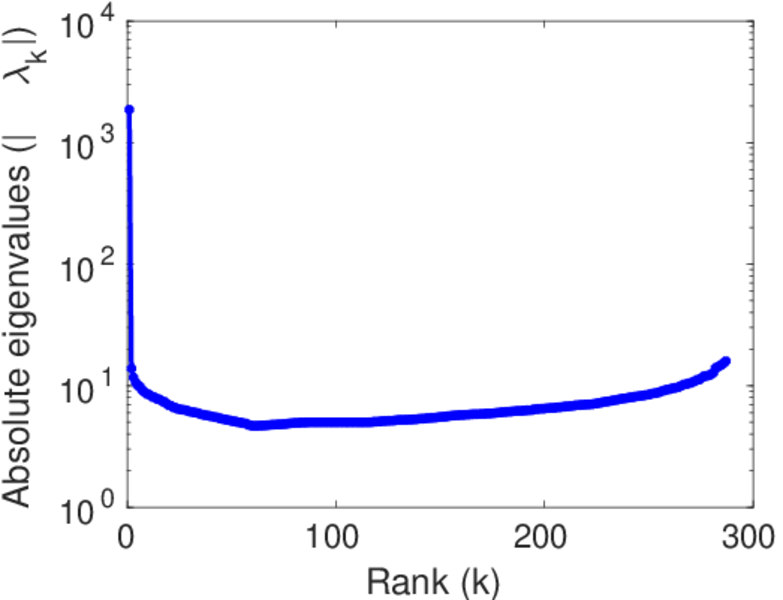
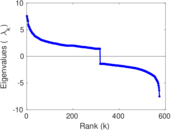
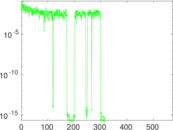
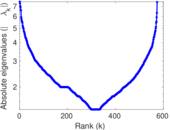
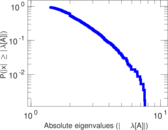
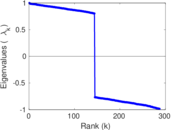
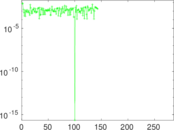
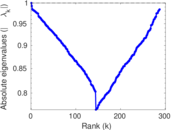
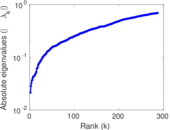
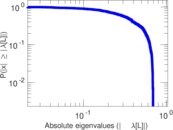
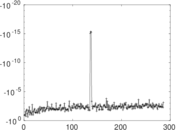
Matrix decompositions plots


Downloads
References
|
[1]
|
Jérôme Kunegis.
KONECT – The Koblenz Network Collection.
In Proc. Int. Conf. on World Wide Web Companion, pages
1343–1350, 2013.
[ http ]
|
|
[2]
|
Hawoong Jeong, Sean P Mason, A-L Barabási, and Zoltan N Oltvai.
Lethality and centrality in protein networks.
Nature, 411(6833):41–42, 2001.
|
|
[3]
|
Stéphane Coulomb, Michel Bauer, Denis Bernard, and Marie-Claude
Marsolier-Kergoat.
Gene essentiality and the topology of protein interaction networks.
Proc. of the Royal Soc. B: Biol. Sci., 272(1573):1721–1725,
2005.
|
|
[4]
|
Jing-Dong J. Han, Denis Dupuy, Nicolas Bertin, Michael E. Cusick, and Marc
Vidal.
Effect of sampling on topology predictions of protein-protein
interaction networks.
Nature Biotechnol., 23(7):839–844, 2005.
|
|
[5]
|
Michael P. H. Stumpf, Carsten Wiuf, and Robert M. May.
Subnets of scale-free networks are not scale-free: Sampling
properties of networks.
Proc. Natl. Acad. Sci. U.S.A., 102(12):4221–4224, 2005.
|
 KONECT ‣ Networks ‣
Buy Me a Coffee
KONECT ‣ Networks ‣
Buy Me a Coffee