Rhesus macaques

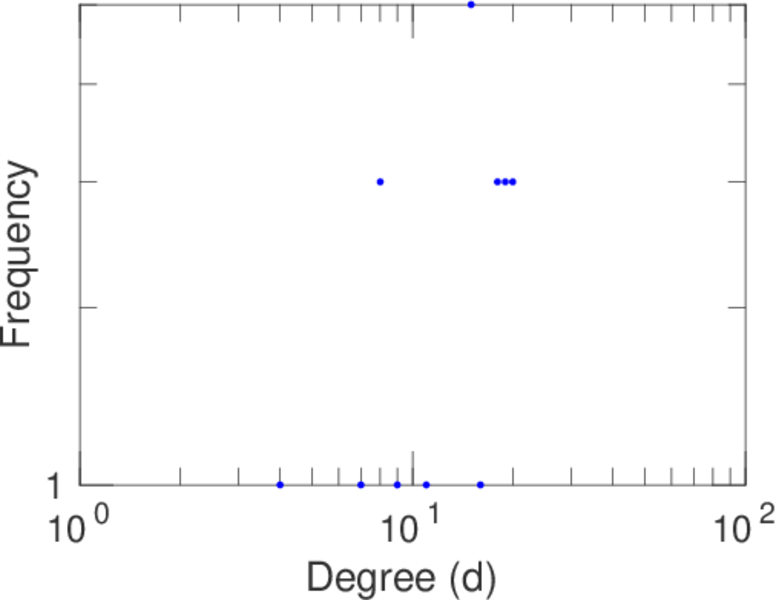
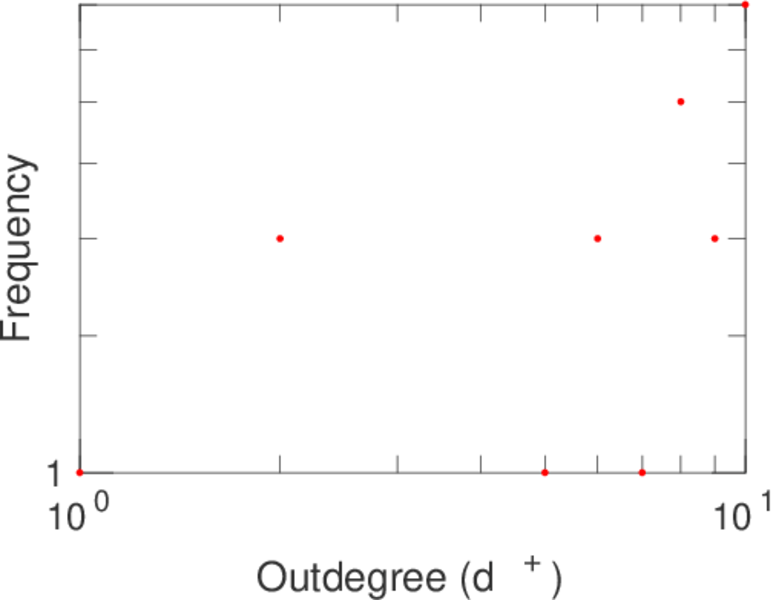
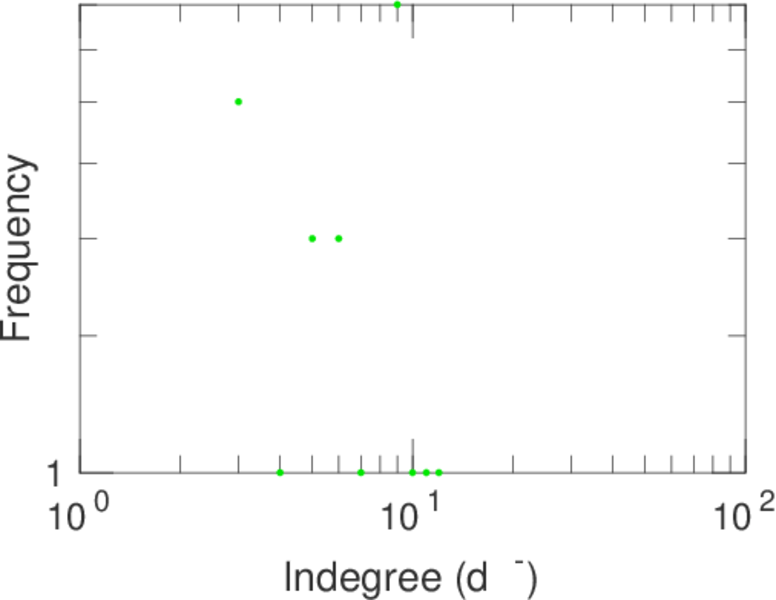
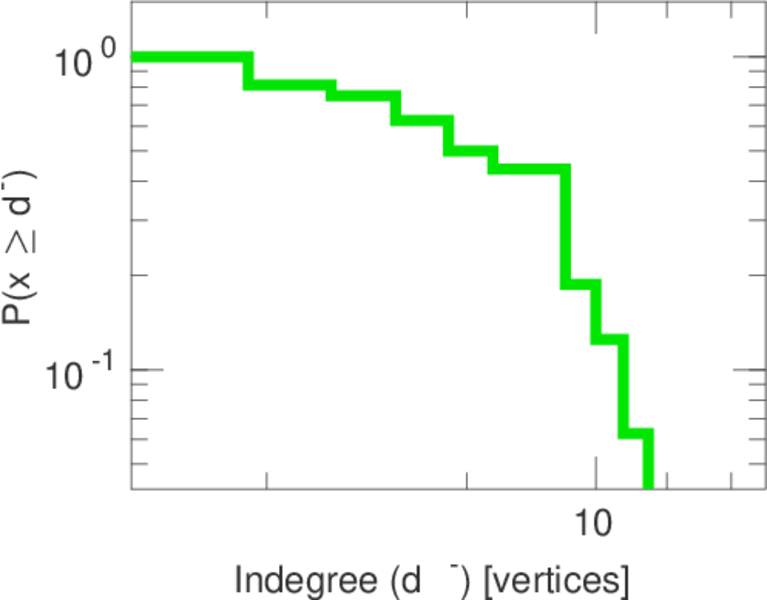
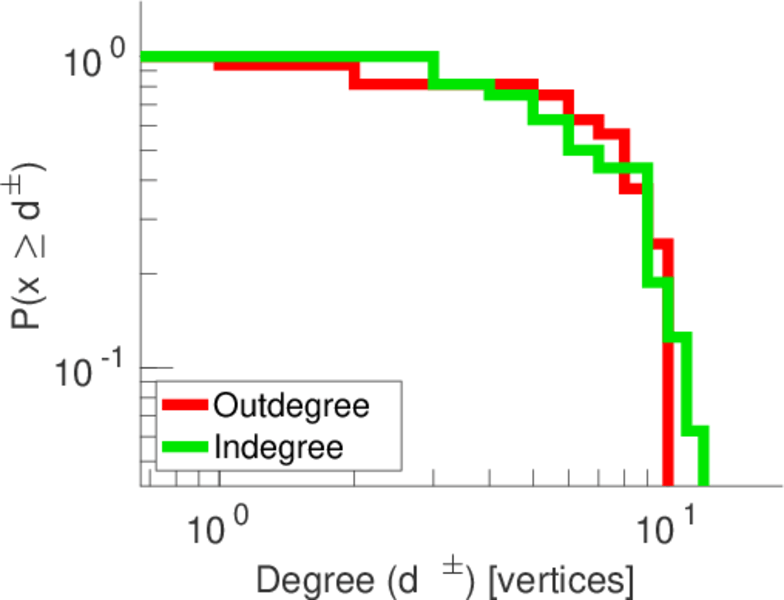
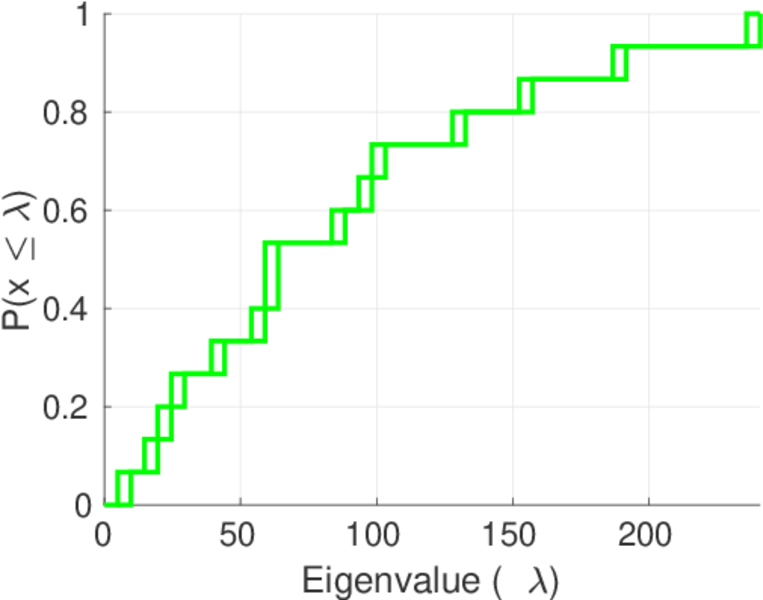
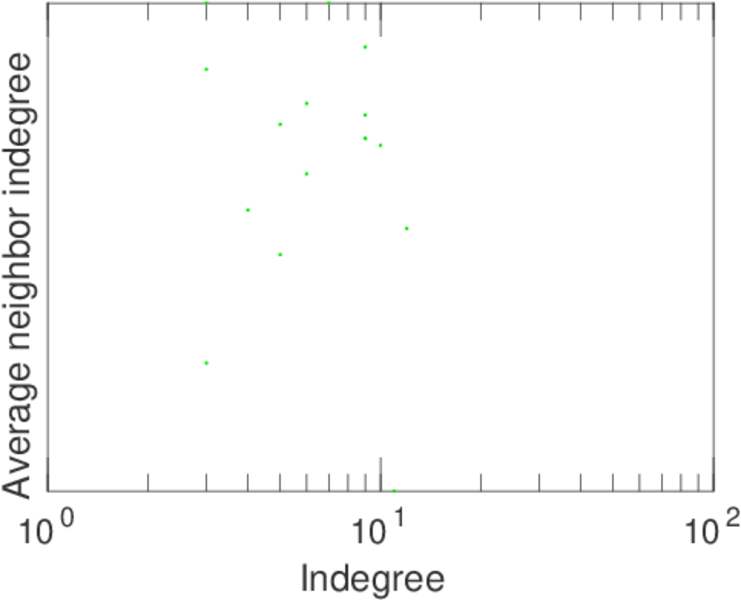
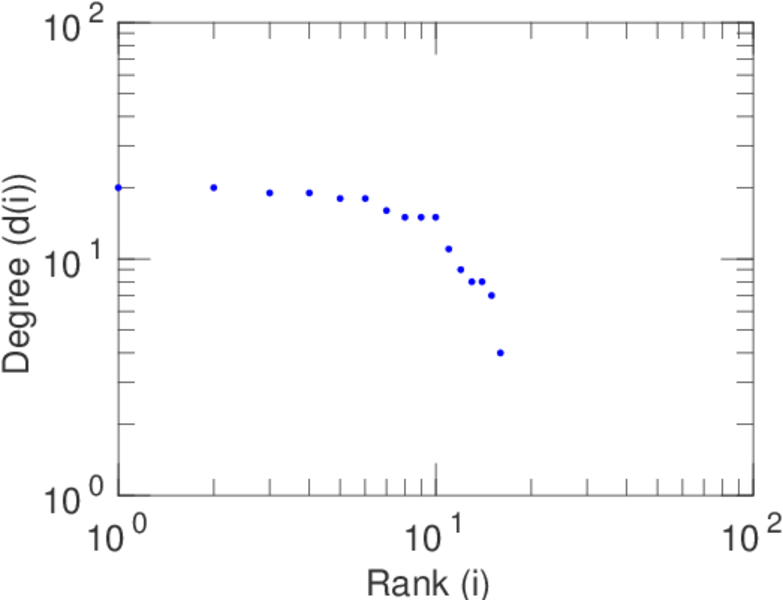
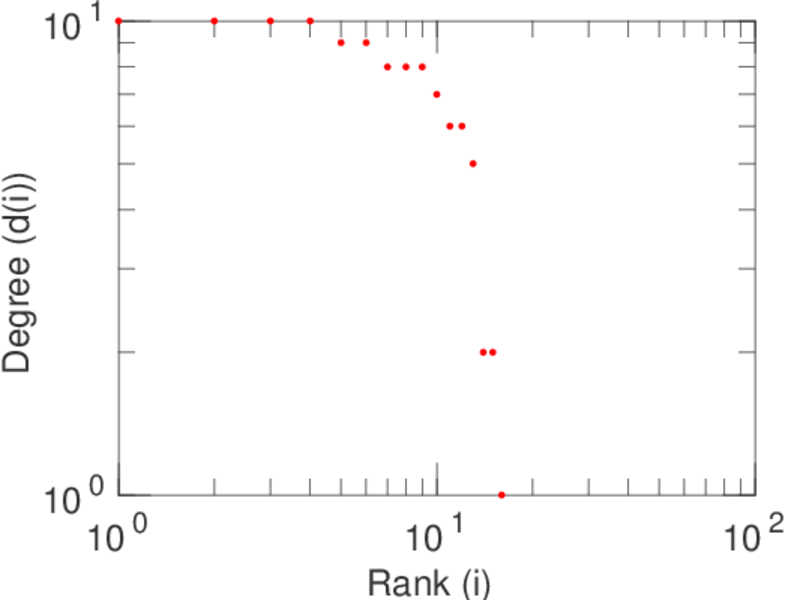
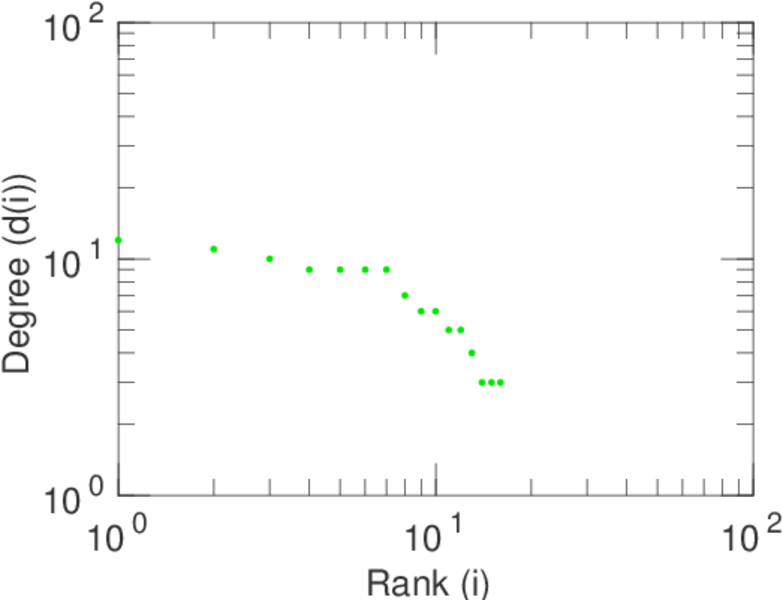
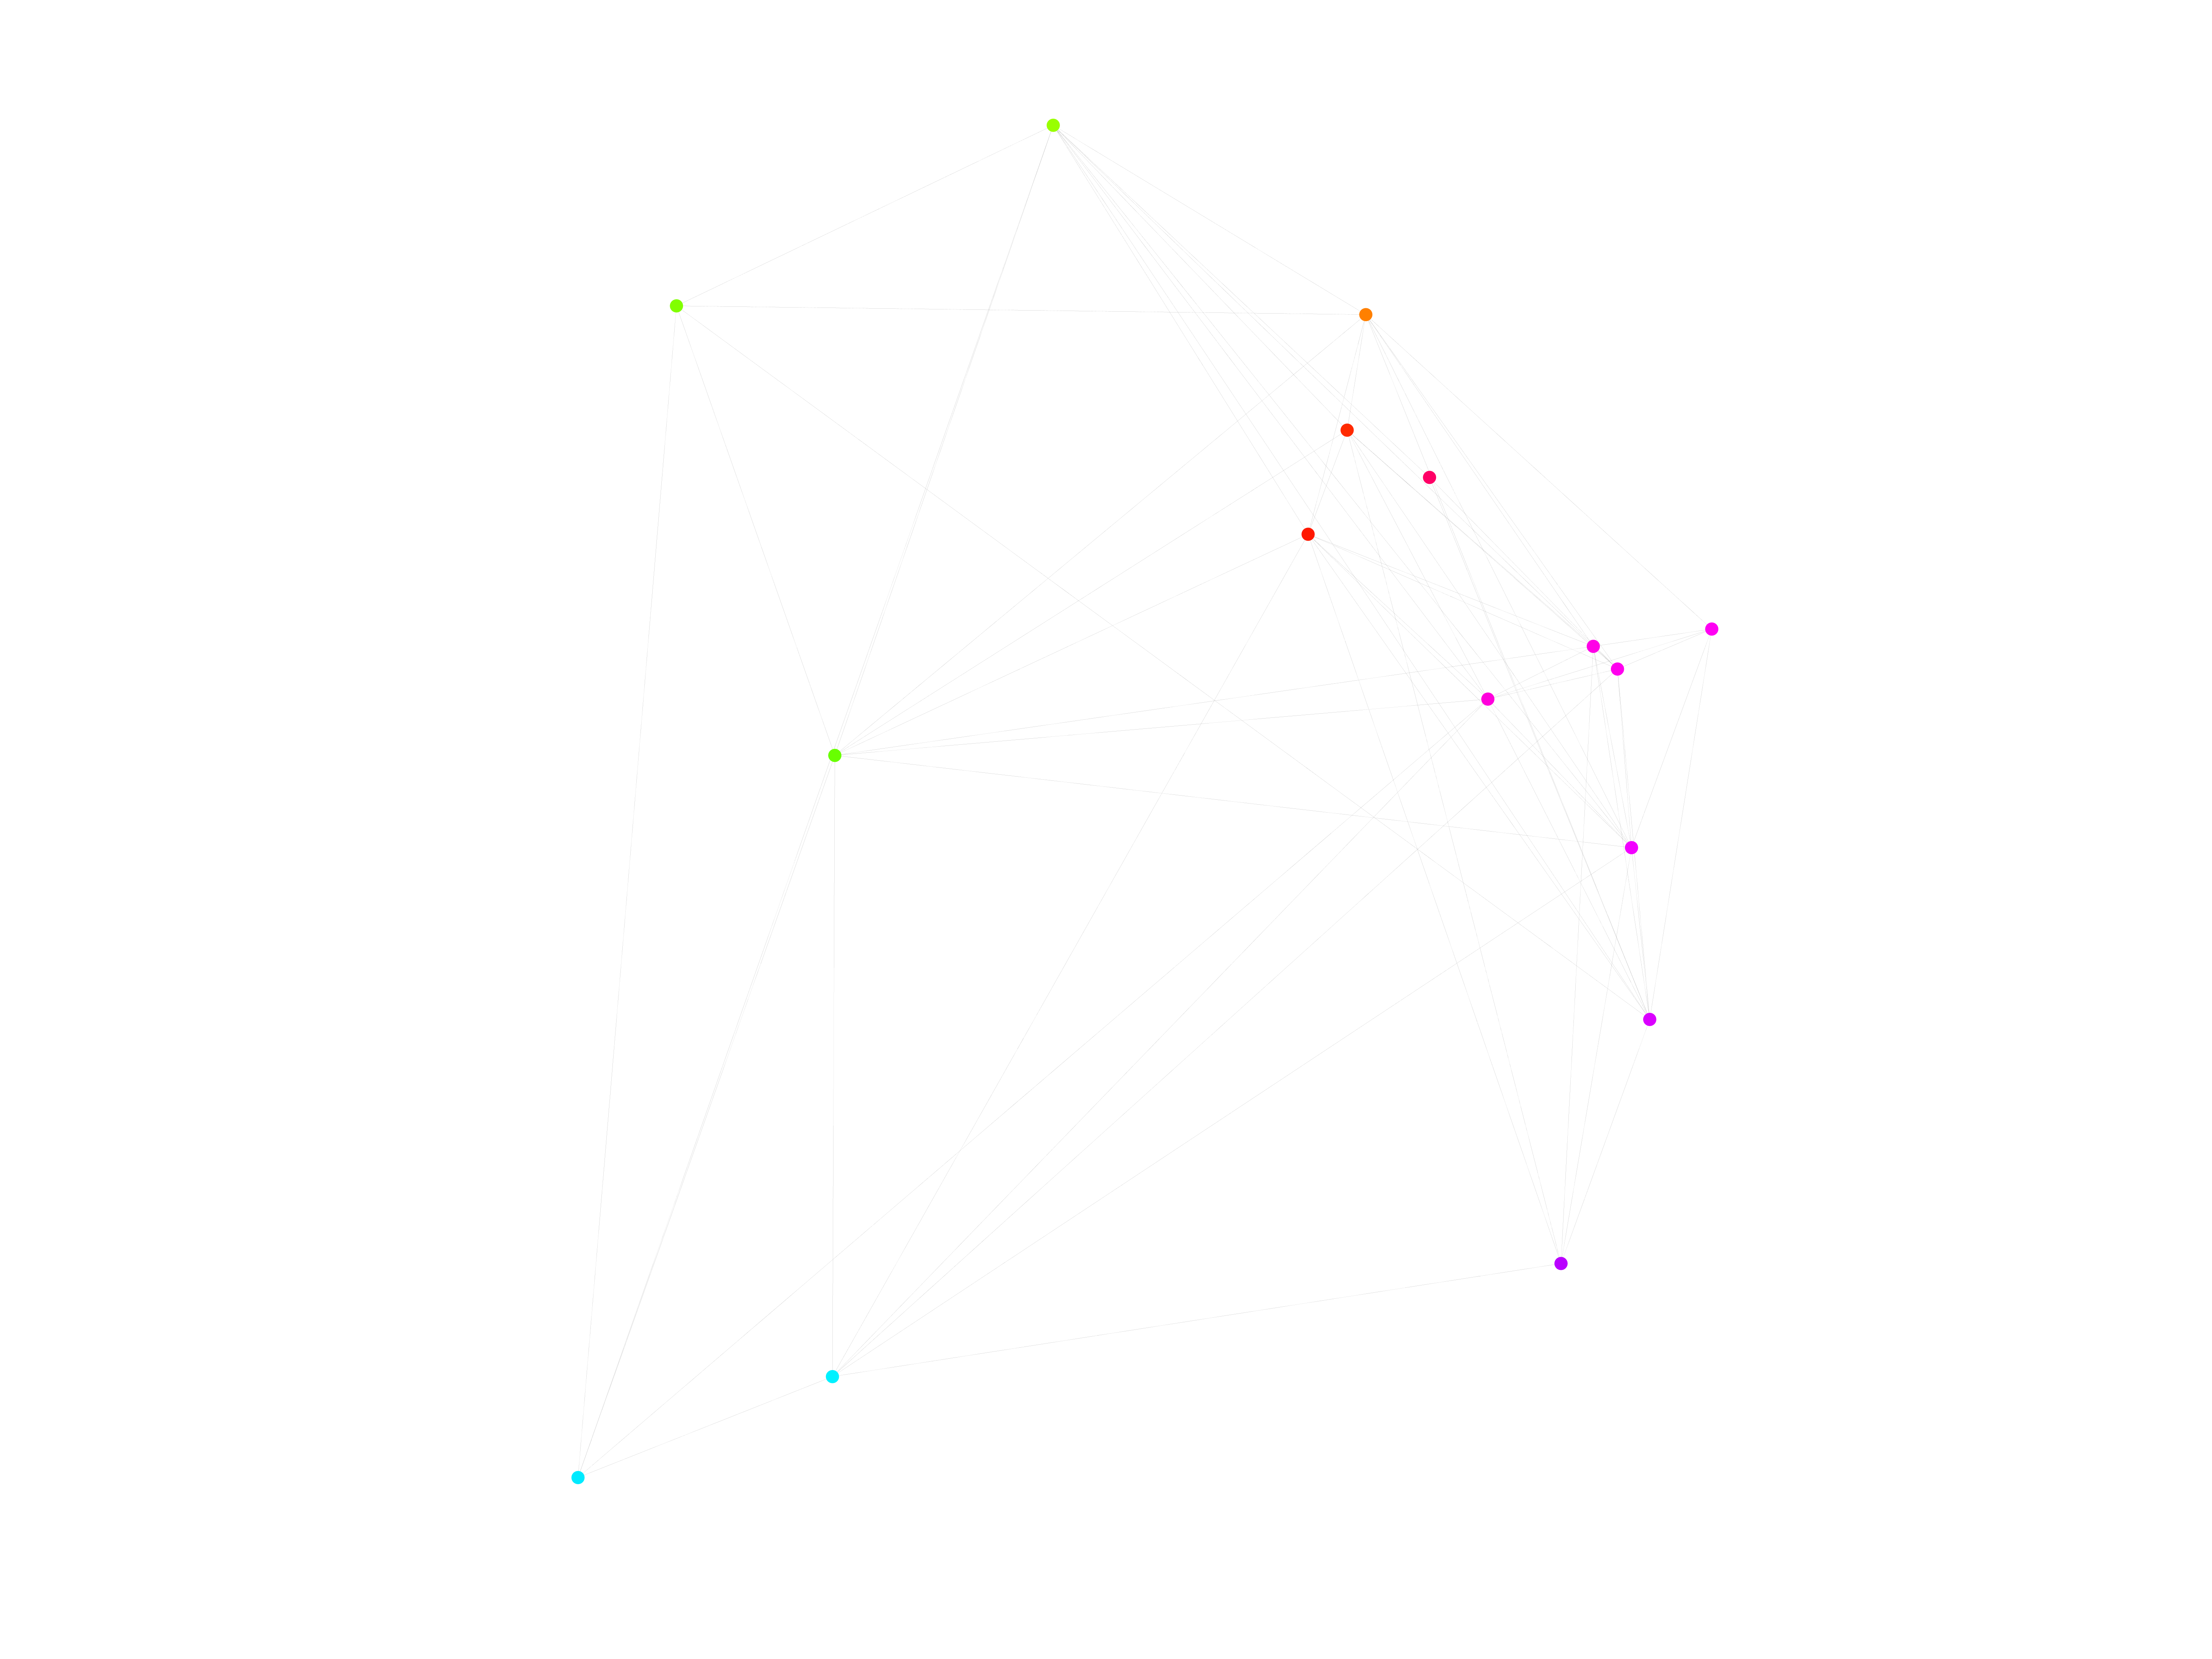
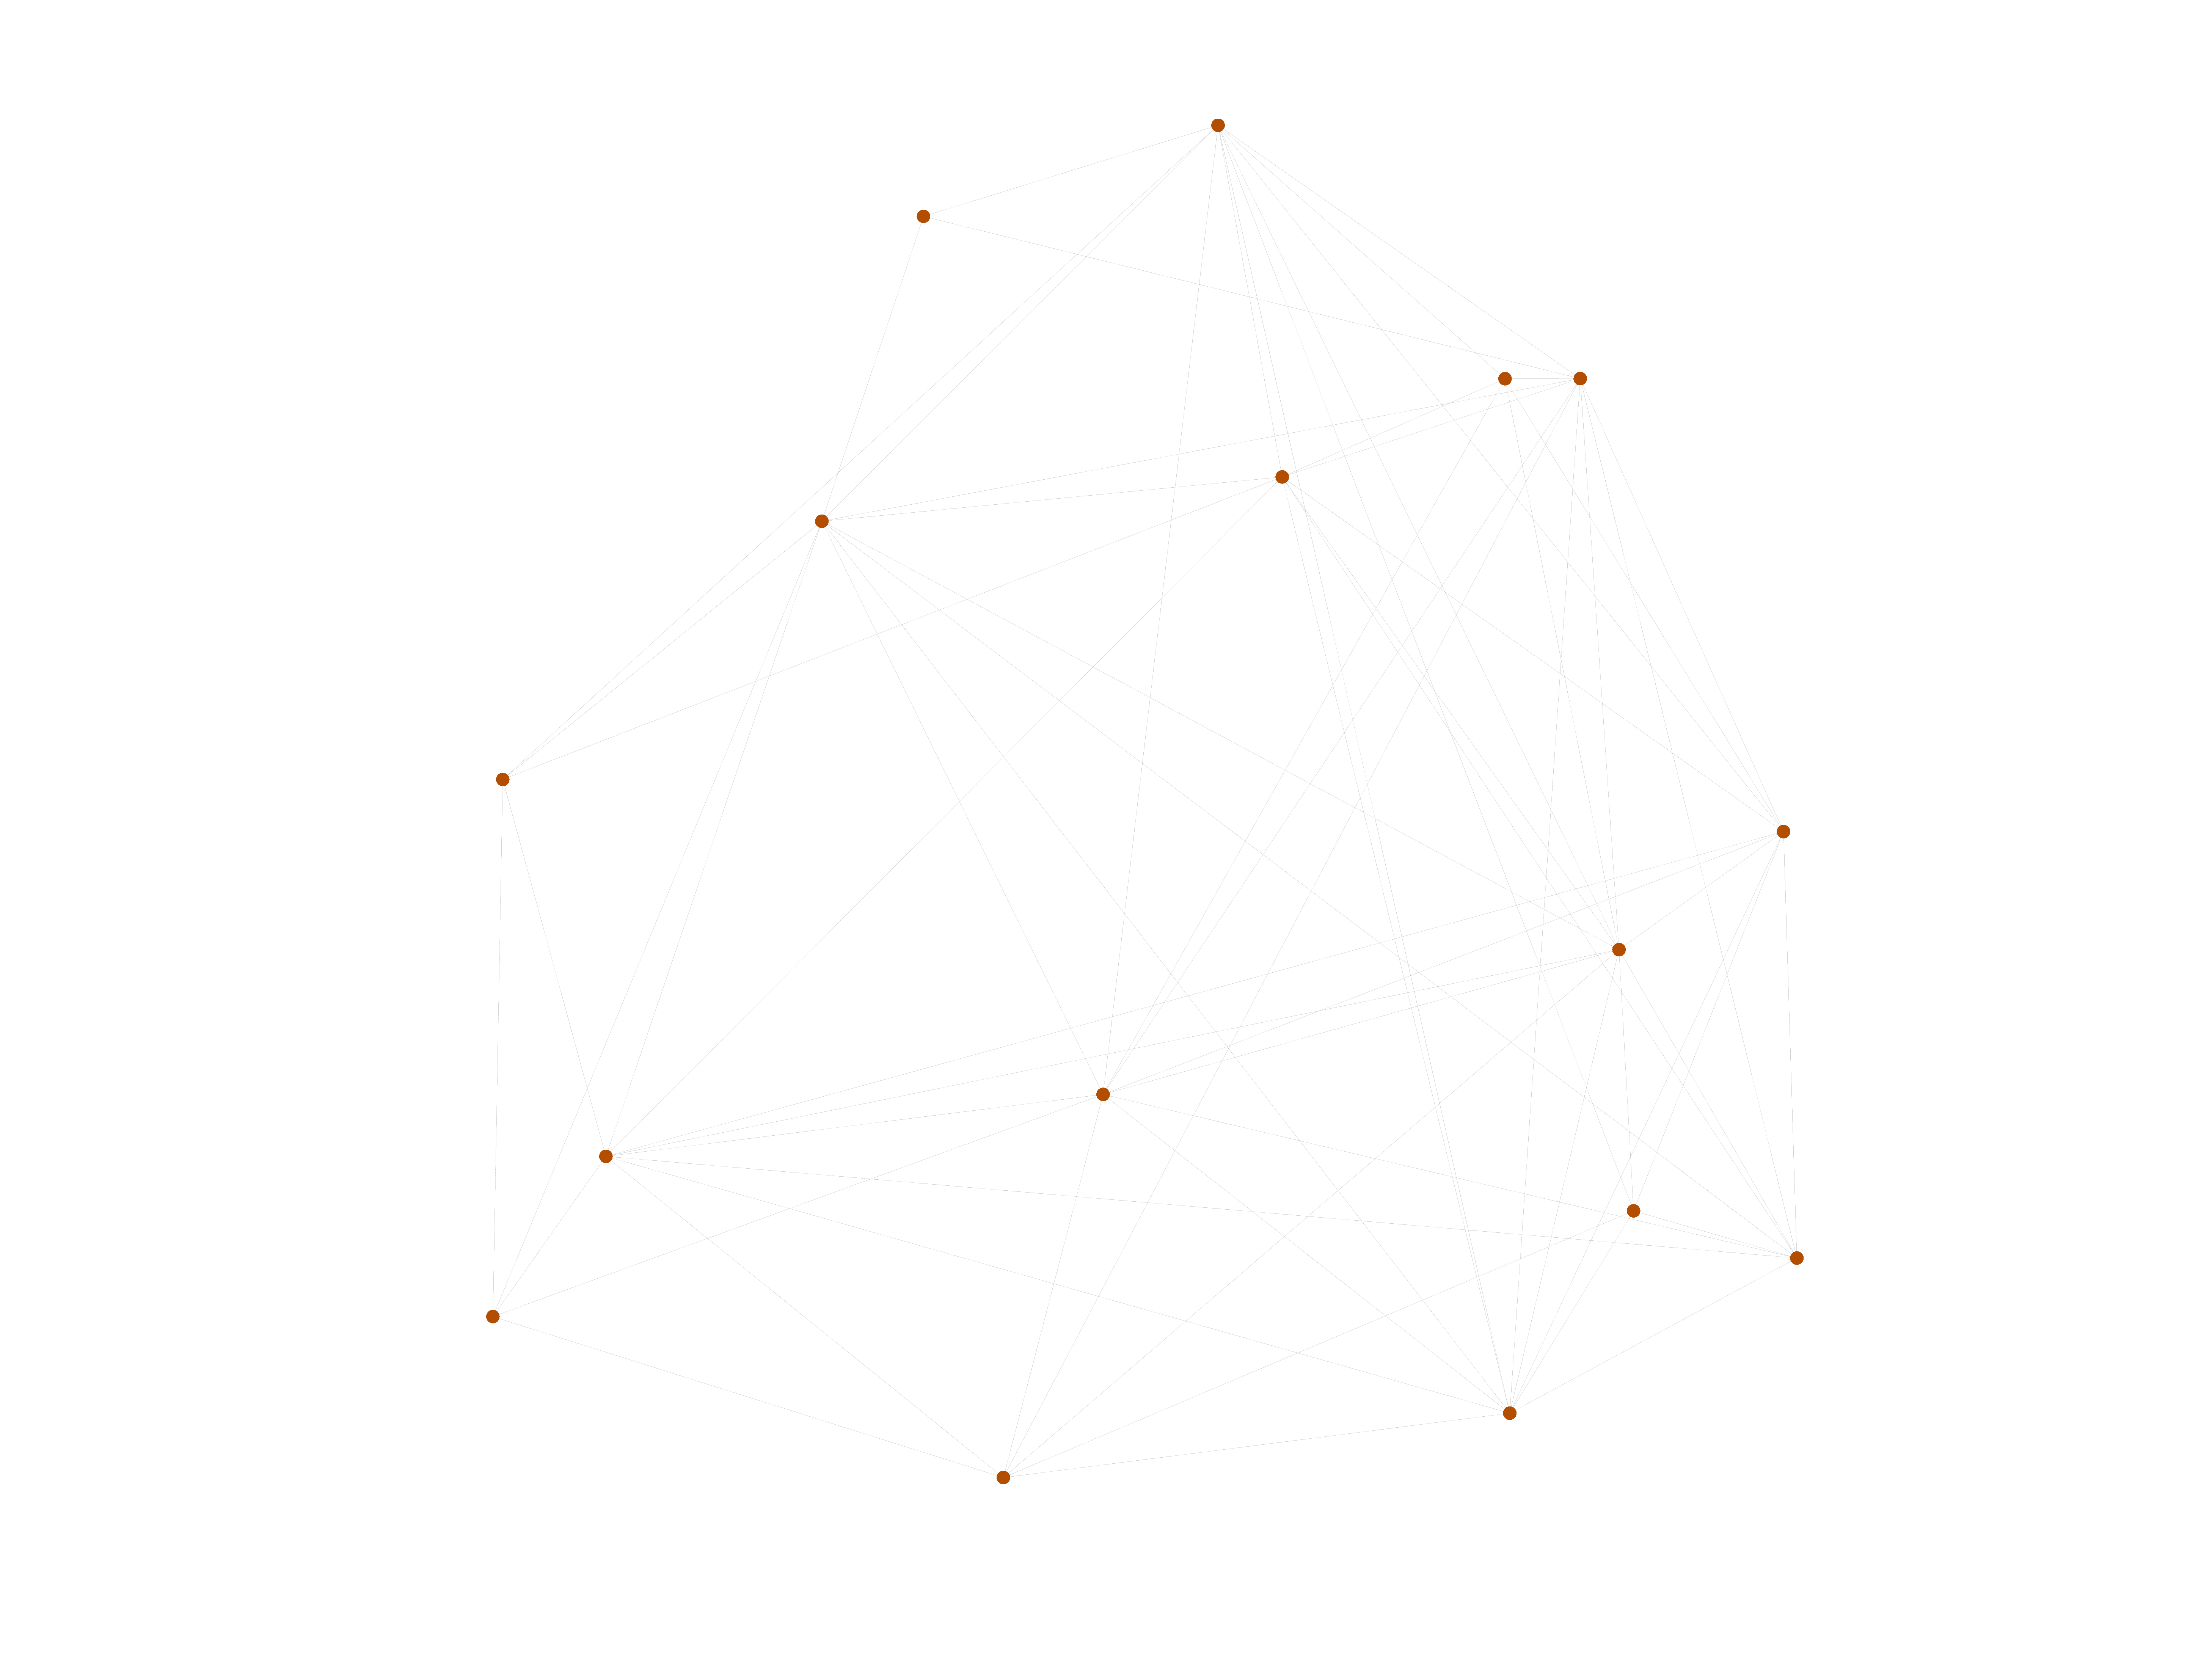
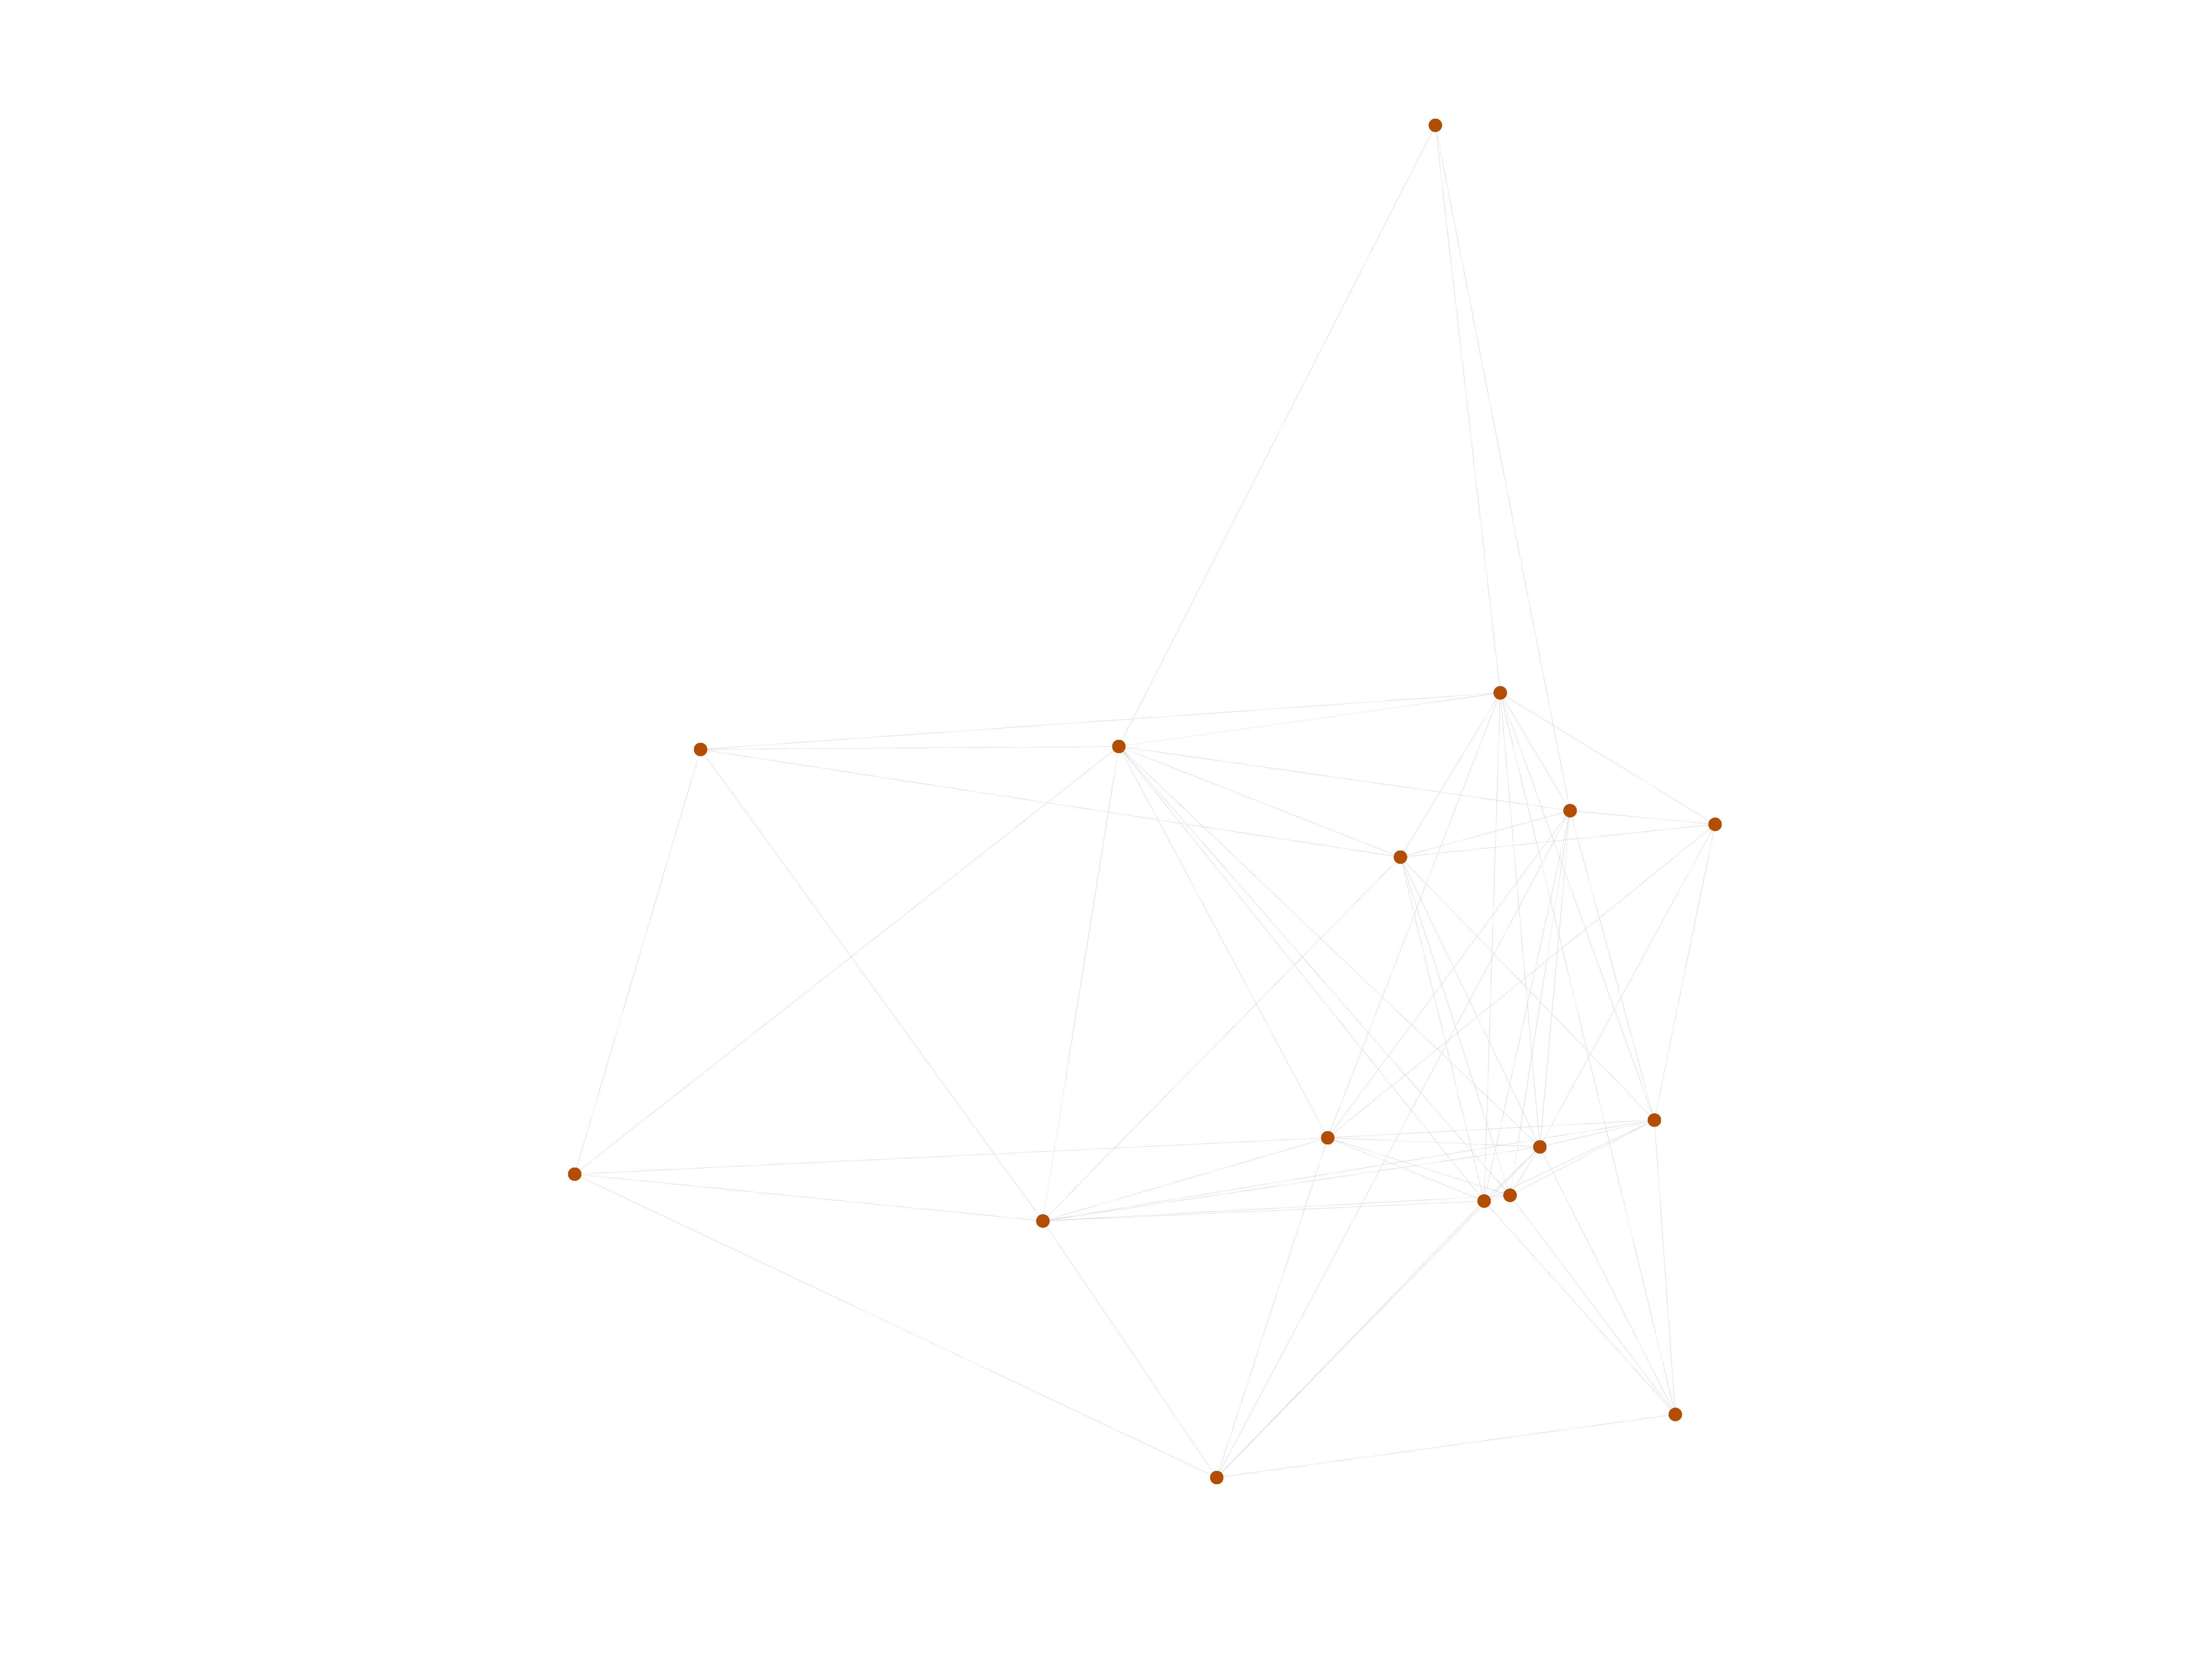
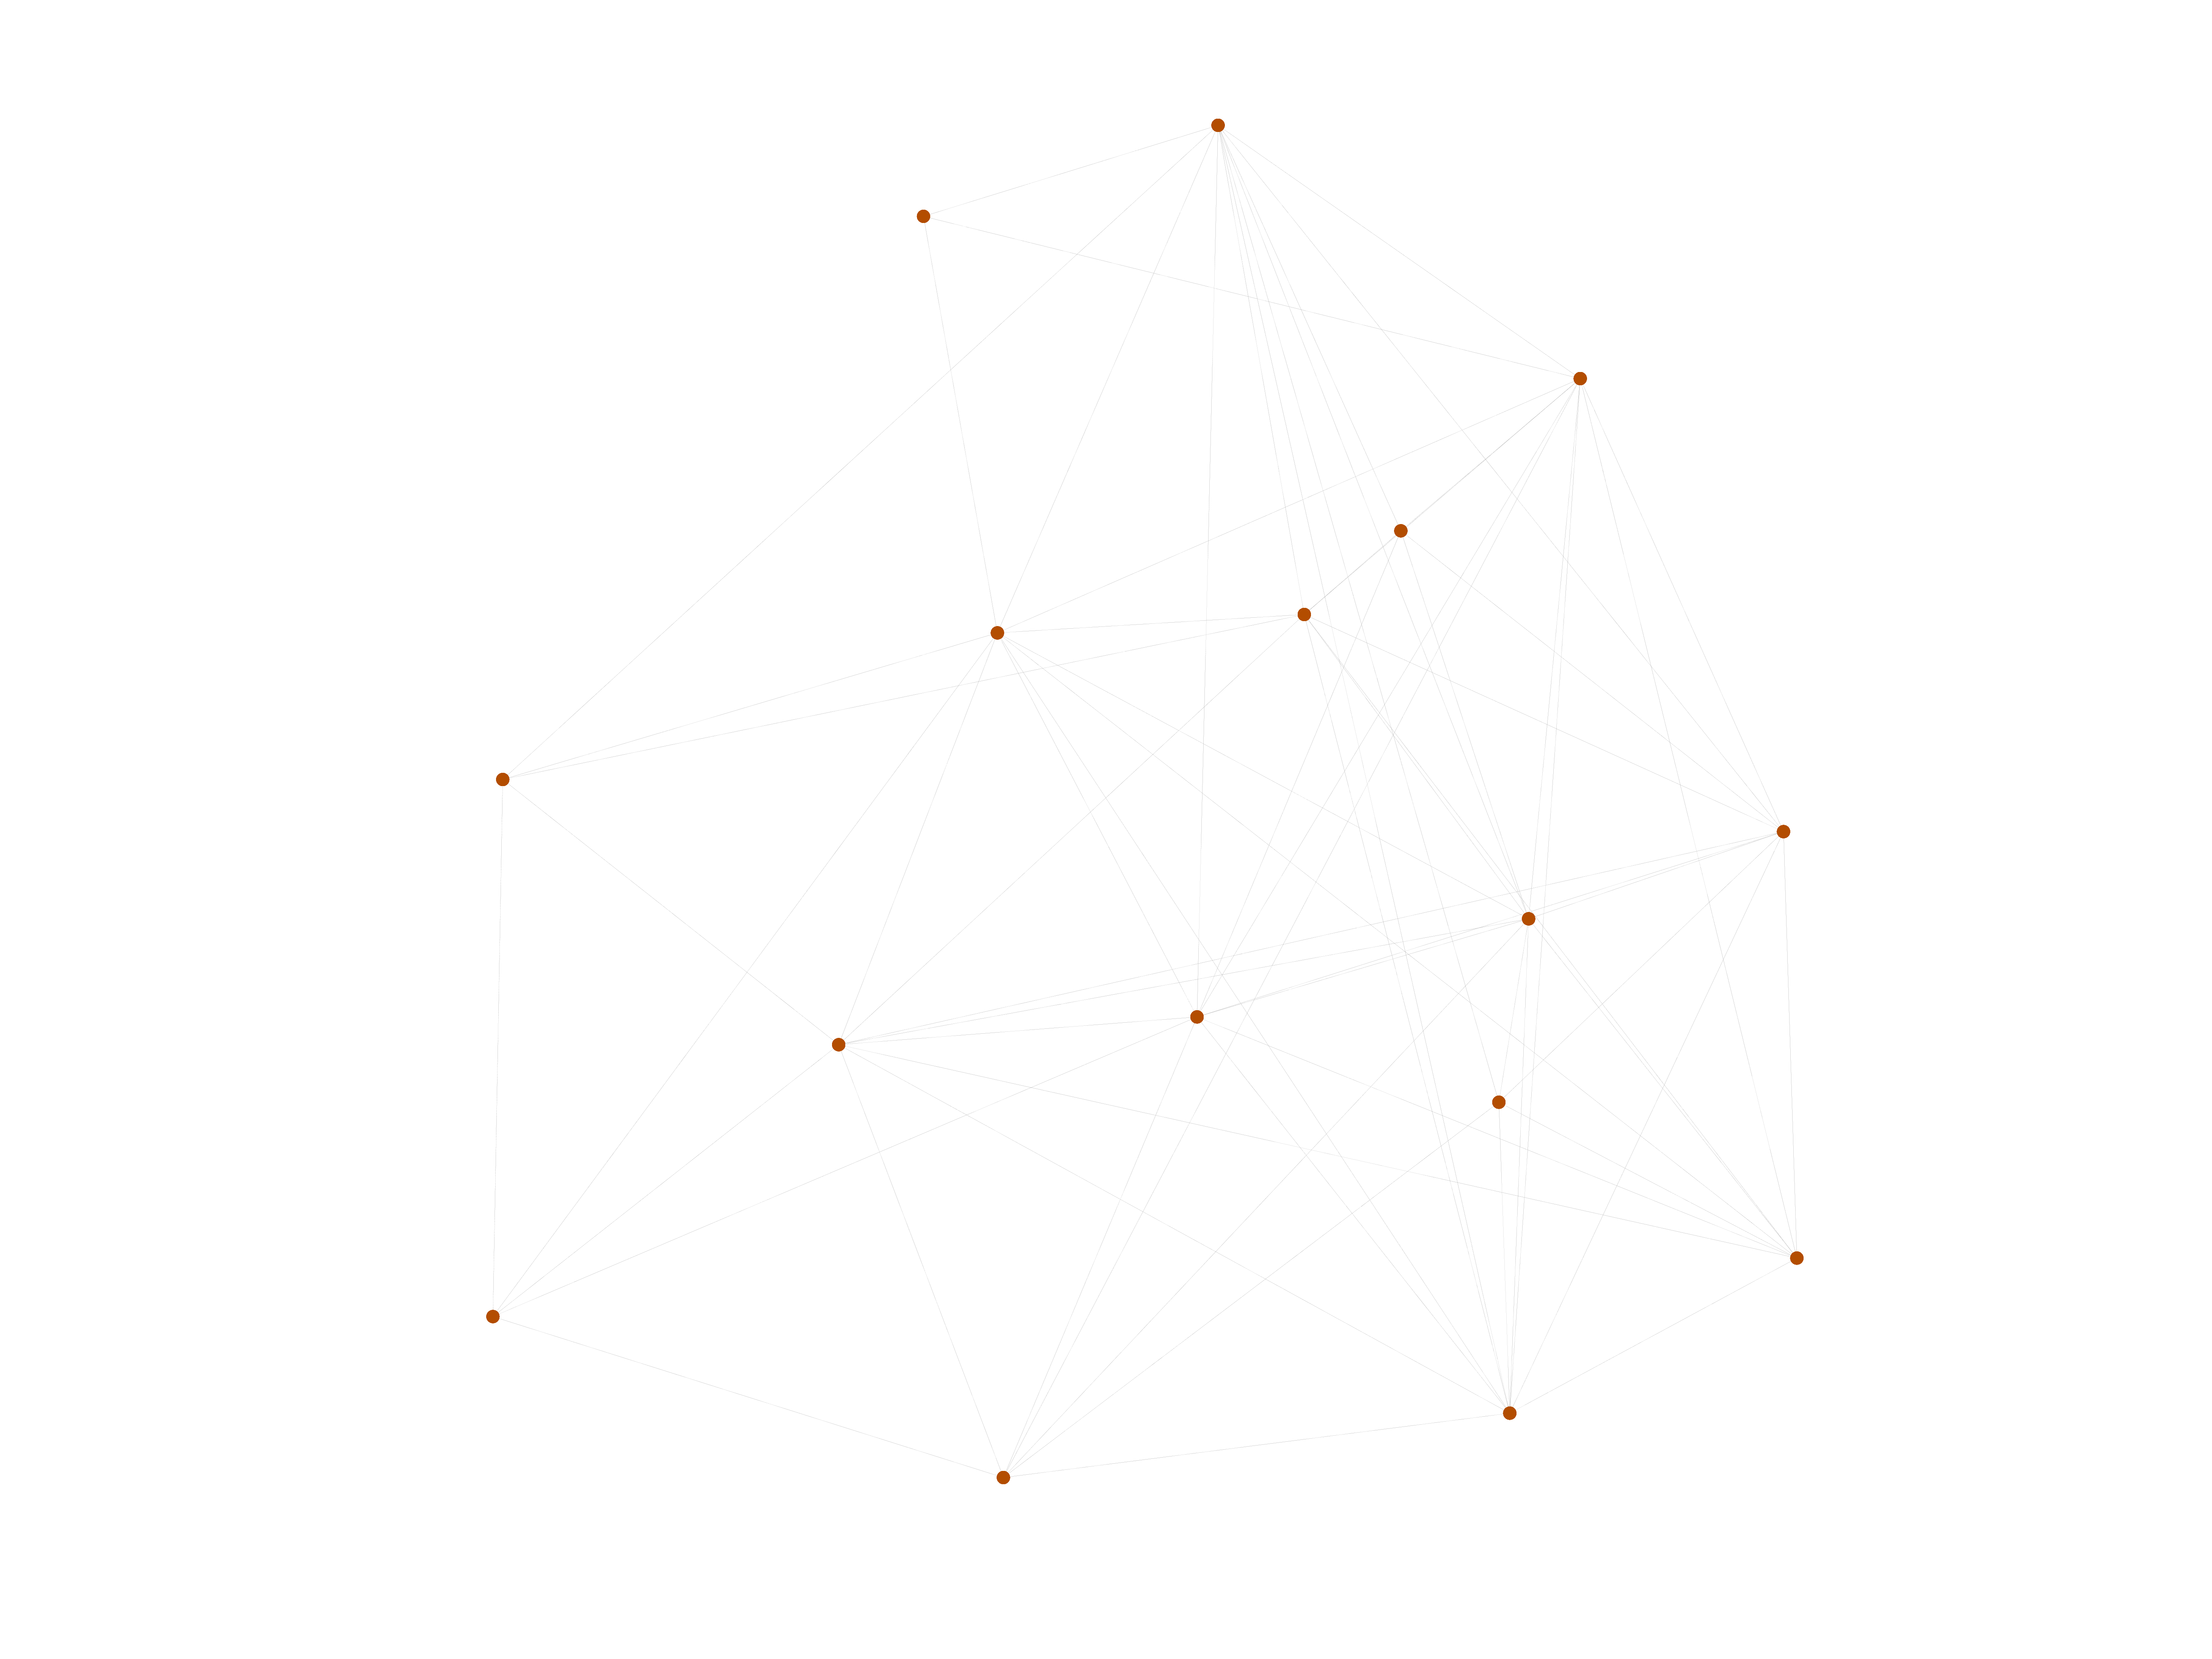
This directed network contains observed grooming episodes between free ranging rhesus macaques (Macaca mulatta) in Cayo Santiago during a two month period in 1963. Cayo Santiago is an island off the coast of Puerto Rico, also known as Isla de los monos (Island of the monkeys). A node represents a monkey and a directed edge A → B denotes that the rhesus macaque A groomed rhesus macaque B. The integer edge weights indicate how often this behaviour was observed.

Metadata

CodeMR
Internal namemoreno_rhesus
NameRhesus macaques
Data sourcehttp://moreno.ss.uci.edu/data.html#rhesus
AvailabilityDataset is available for download
Consistency checkDataset passed all tests
Category
Animal network
Node meaningMonkey
Edge meaningGrooming
Network formatUnipartite, directed
Edge typePositive weights, no multiple edges
ReciprocalContains reciprocal edges
Directed cyclesContains directed cycles
LoopsDoes not contain loops

Statistics

Size n =16
Volume m =111
Loop count l =0
Wedge count s =586
Claw count z =8,175
Cross count x =30,109
Triangle count t =131
Square count q =724
4-Tour count T4 =8,274
Maximum degree dmax =20
Maximum outdegree d+max =10
Maximum indegree dmax =12
Average degree d =13.875 0
Fill p =0.462 500
Size of LCC N =16
Size of LSCC Ns =16
Relative size of LSCC Nrs =1.000 00
Diameter δ =2
50-Percentile effective diameter δ0.5 =0.860 714
90-Percentile effective diameter δ0.9 =1.766 67
Median distance δM =1
Mean distance δm =1.369 96
Gini coefficient G =0.205 518
Balanced inequality ratio P =0.414 414
Outdegree balanced inequality ratio P+ =0.405 405
Indegree balanced inequality ratio P =0.378 378
Relative edge distribution entropy Her =0.972 860
Power law exponent γ =2.009 56
Tail power law exponent γt =8.991 00
Tail power law exponent with p γ3 =8.991 00
p-value p =0.165 000
Outdegree tail power law exponent with p γ3,o =6.521 00
Outdegree p-value po =0.146 000
Indegree tail power law exponent with p γ3,i =8.521 00
Indegree p-value pi =0.923 000
Degree assortativity ρ =−0.109 139
Degree assortativity p-value pρ =0.202 576
In/outdegree correlation ρ± =+0.532 295
Clustering coefficient c =0.670 648
Directed clustering coefficient c± =0.616 095
Spectral norm α =122.605
Operator 2-norm ν =78.286 9
Cyclic eigenvalue π =49.722 4
Algebraic connectivity a =8.160 20
Spectral separation 1[A] / λ2[A]| =1.923 12
Reciprocity y =0.756 757
Non-bipartivity bA =0.645 909
Normalized non-bipartivity bN =0.625 357
Algebraic non-bipartivity χ =2.647 03
Spectral bipartite frustration bK =0.076 725 5
Controllability C =0
Relative controllability Cr =0.000 00

Plots

Fruchterman–Reingold graph drawing

Degree distribution

Cumulative degree distribution

Lorenz curve

Spectral distribution of the adjacency matrix

Spectral distribution of the normalized adjacency matrix

Spectral distribution of the Laplacian

Spectral graph drawing based on the adjacency matrix

Spectral graph drawing based on the Laplacian

Spectral graph drawing based on the normalized adjacency matrix

Degree assortativity

Zipf plot

Hop distribution

Double Laplacian graph drawing

Delaunay graph drawing

In/outdegree scatter plot

Edge weight/multiplicity distribution

Clustering coefficient distribution

Average neighbor degree distribution

SynGraphy

Matrix decompositions plots

Downloads

References

[1] Jérôme Kunegis. KONECT – The Koblenz Network Collection. In Proc. Int. Conf. on World Wide Web Companion, pages 1343–1350, 2013. [ http ]
[2] D. S. Sade. Sociometrics of Macaca mulatta I. linkages and cliques in grooming matrices. Folia Primatologica, 18(3-4):196–223, 1972.