Seventh graders

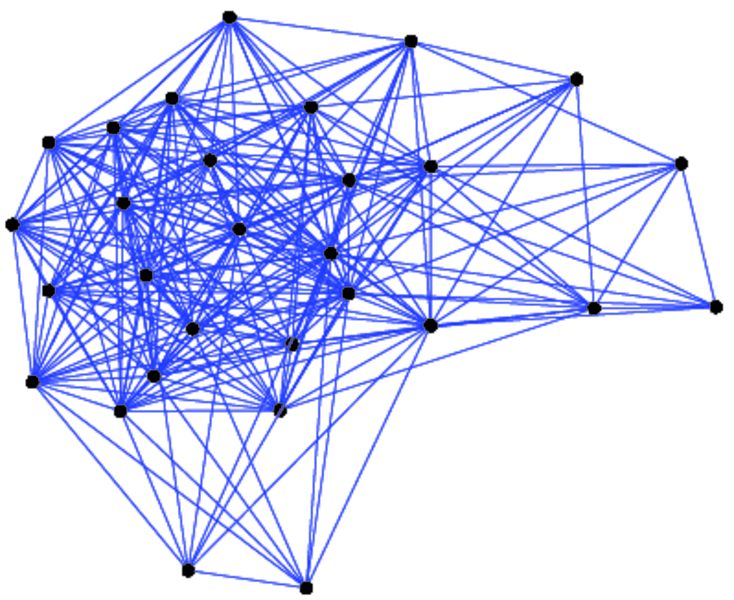
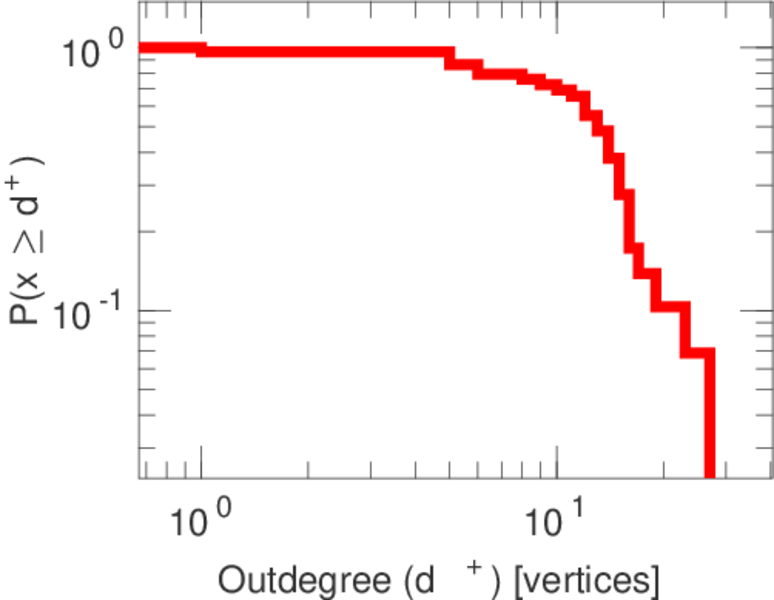
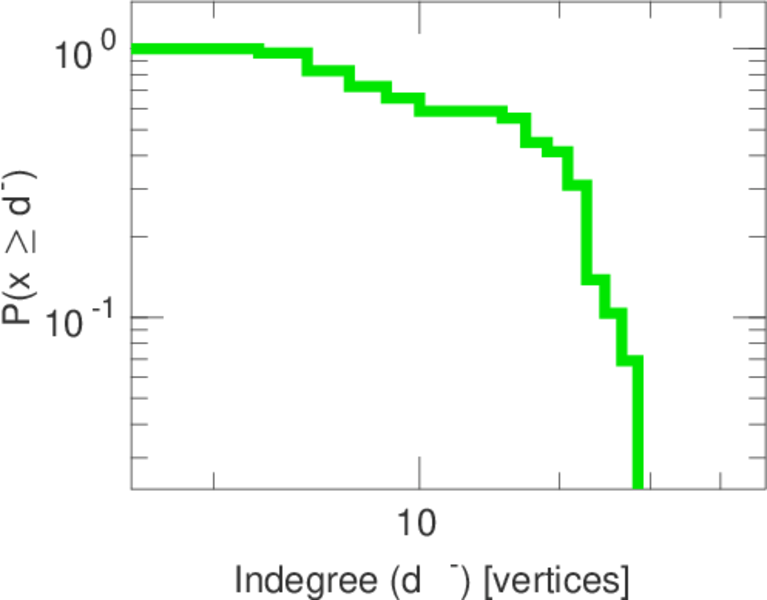
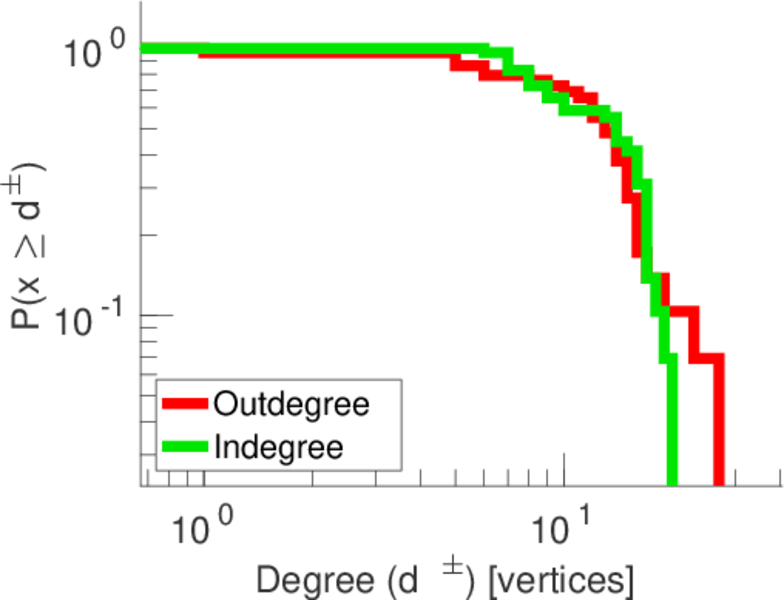
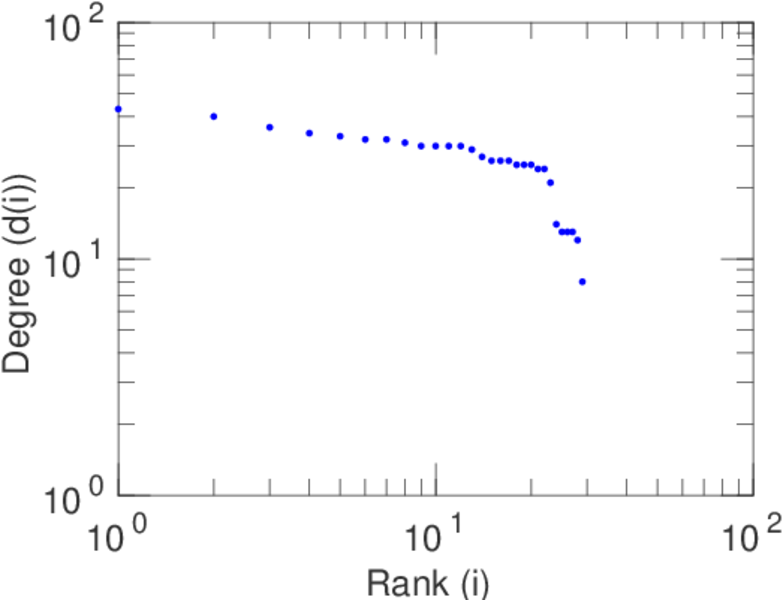
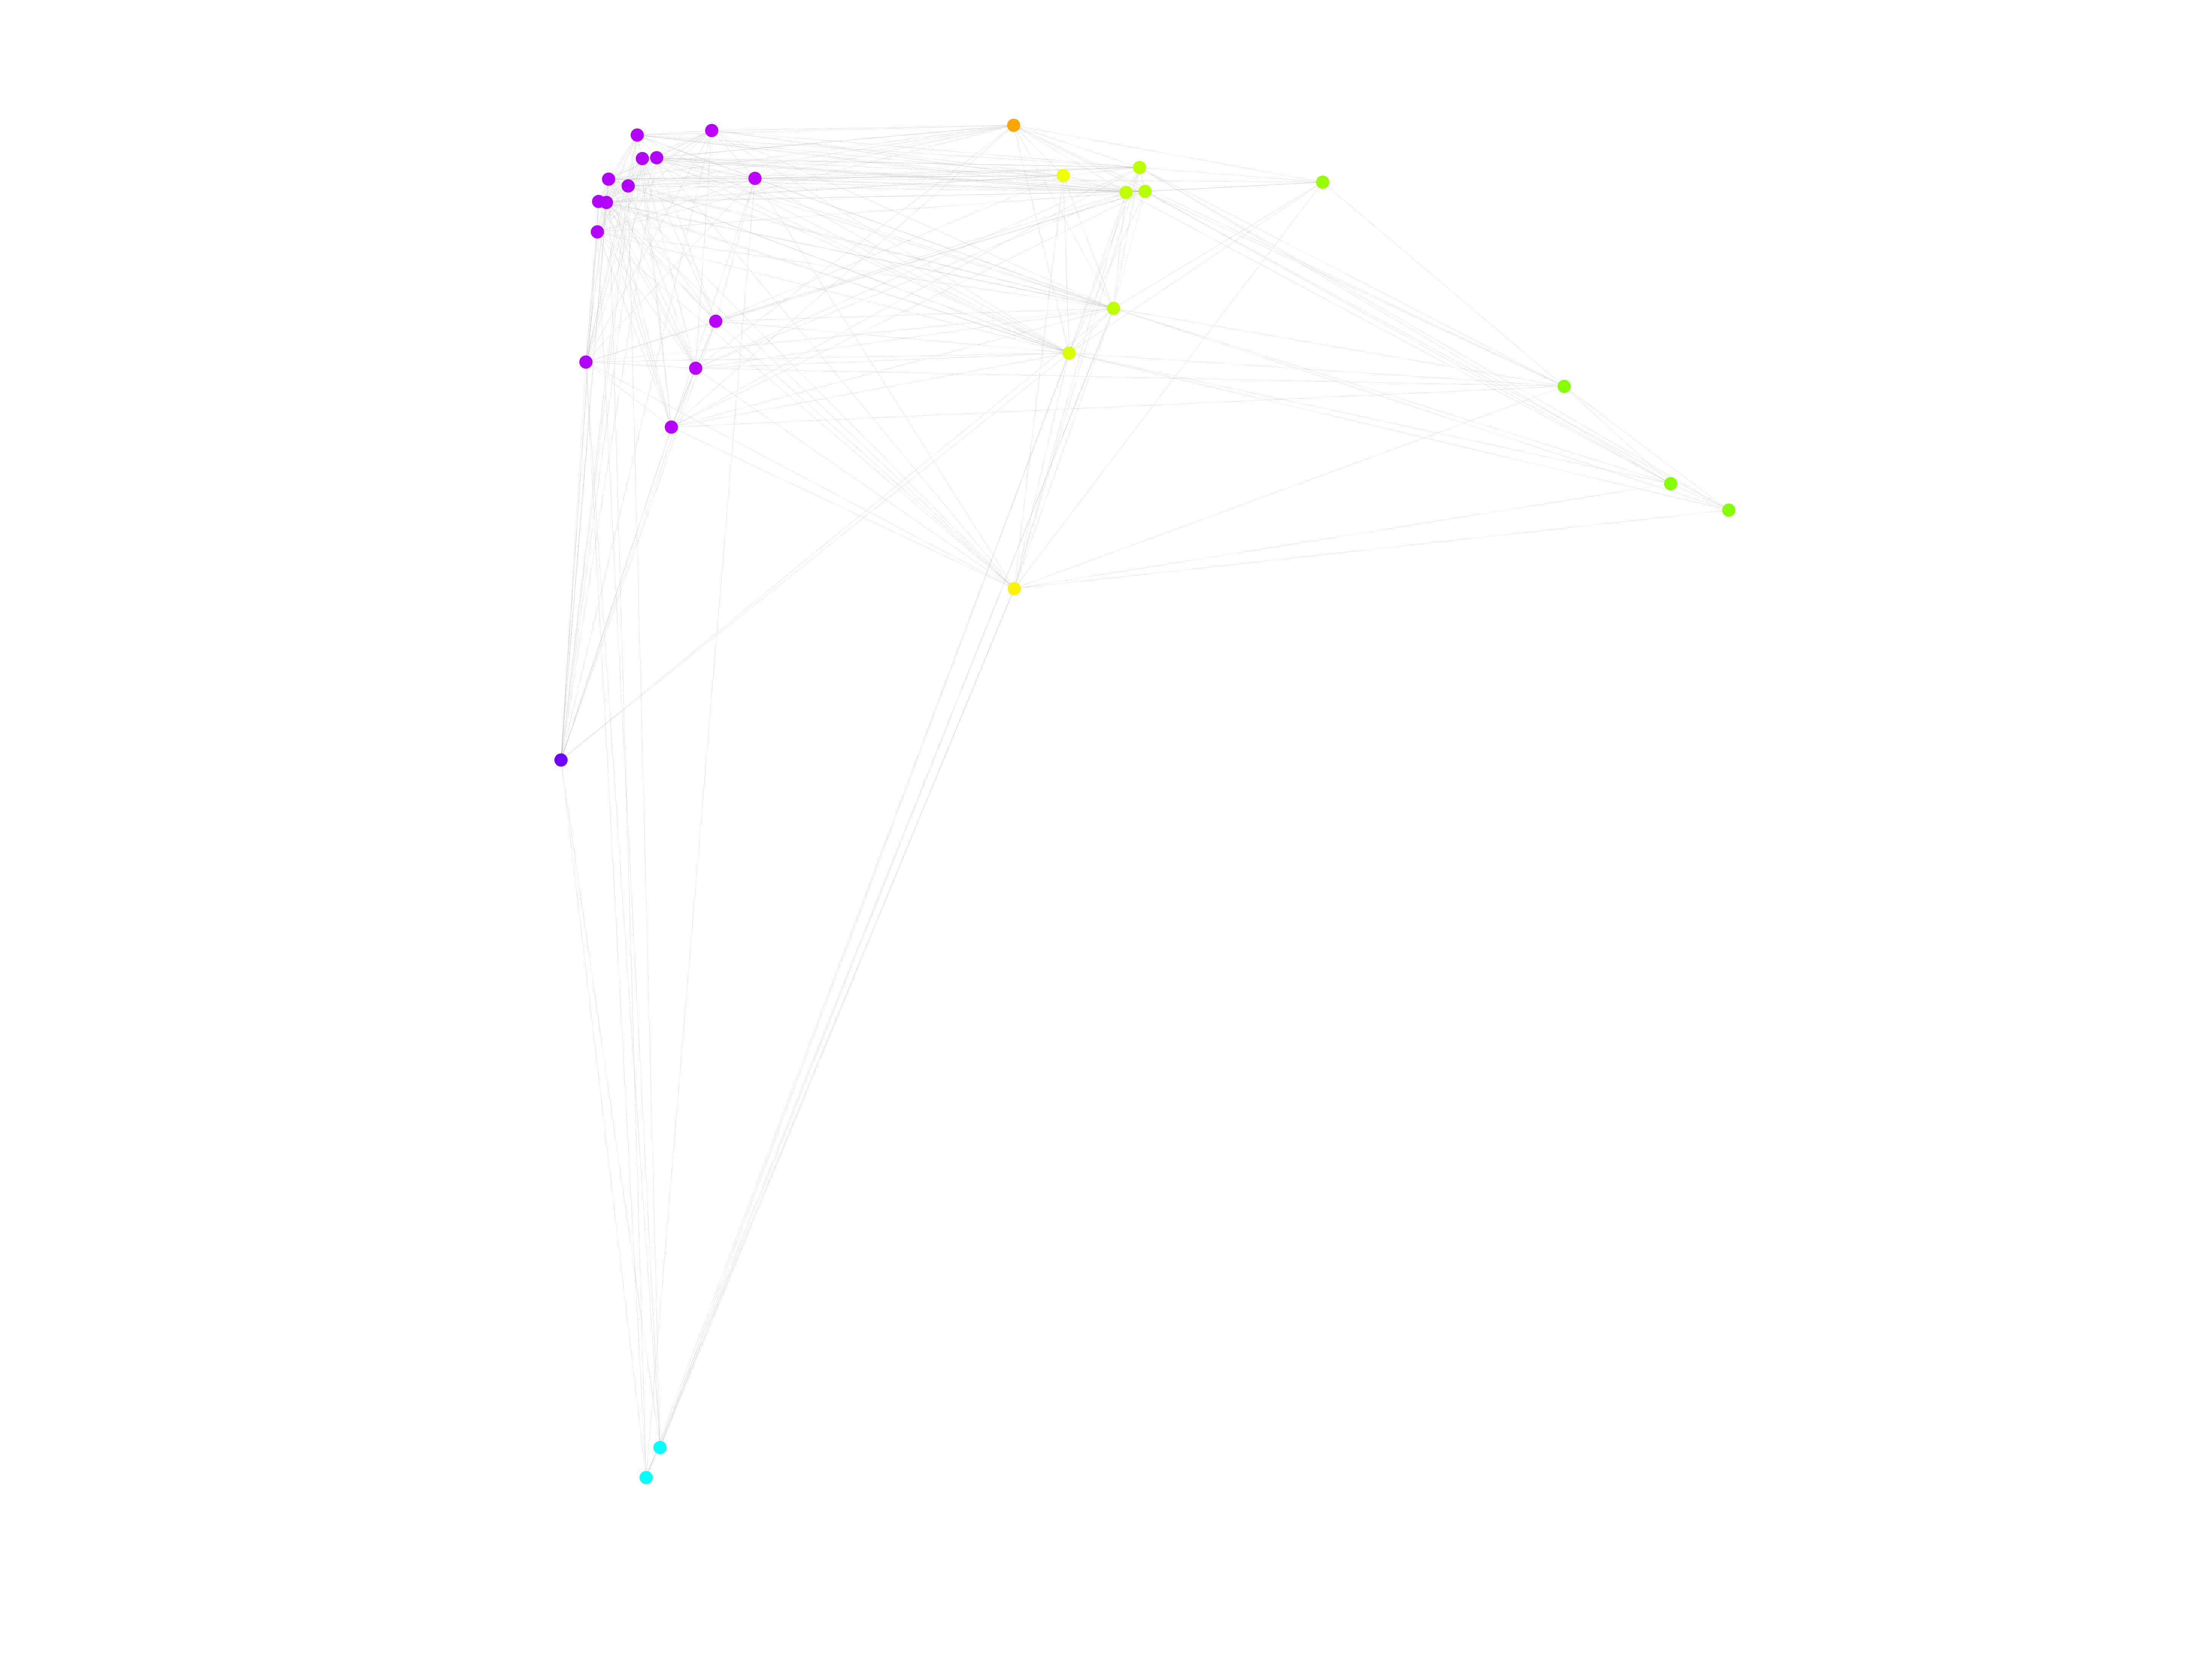
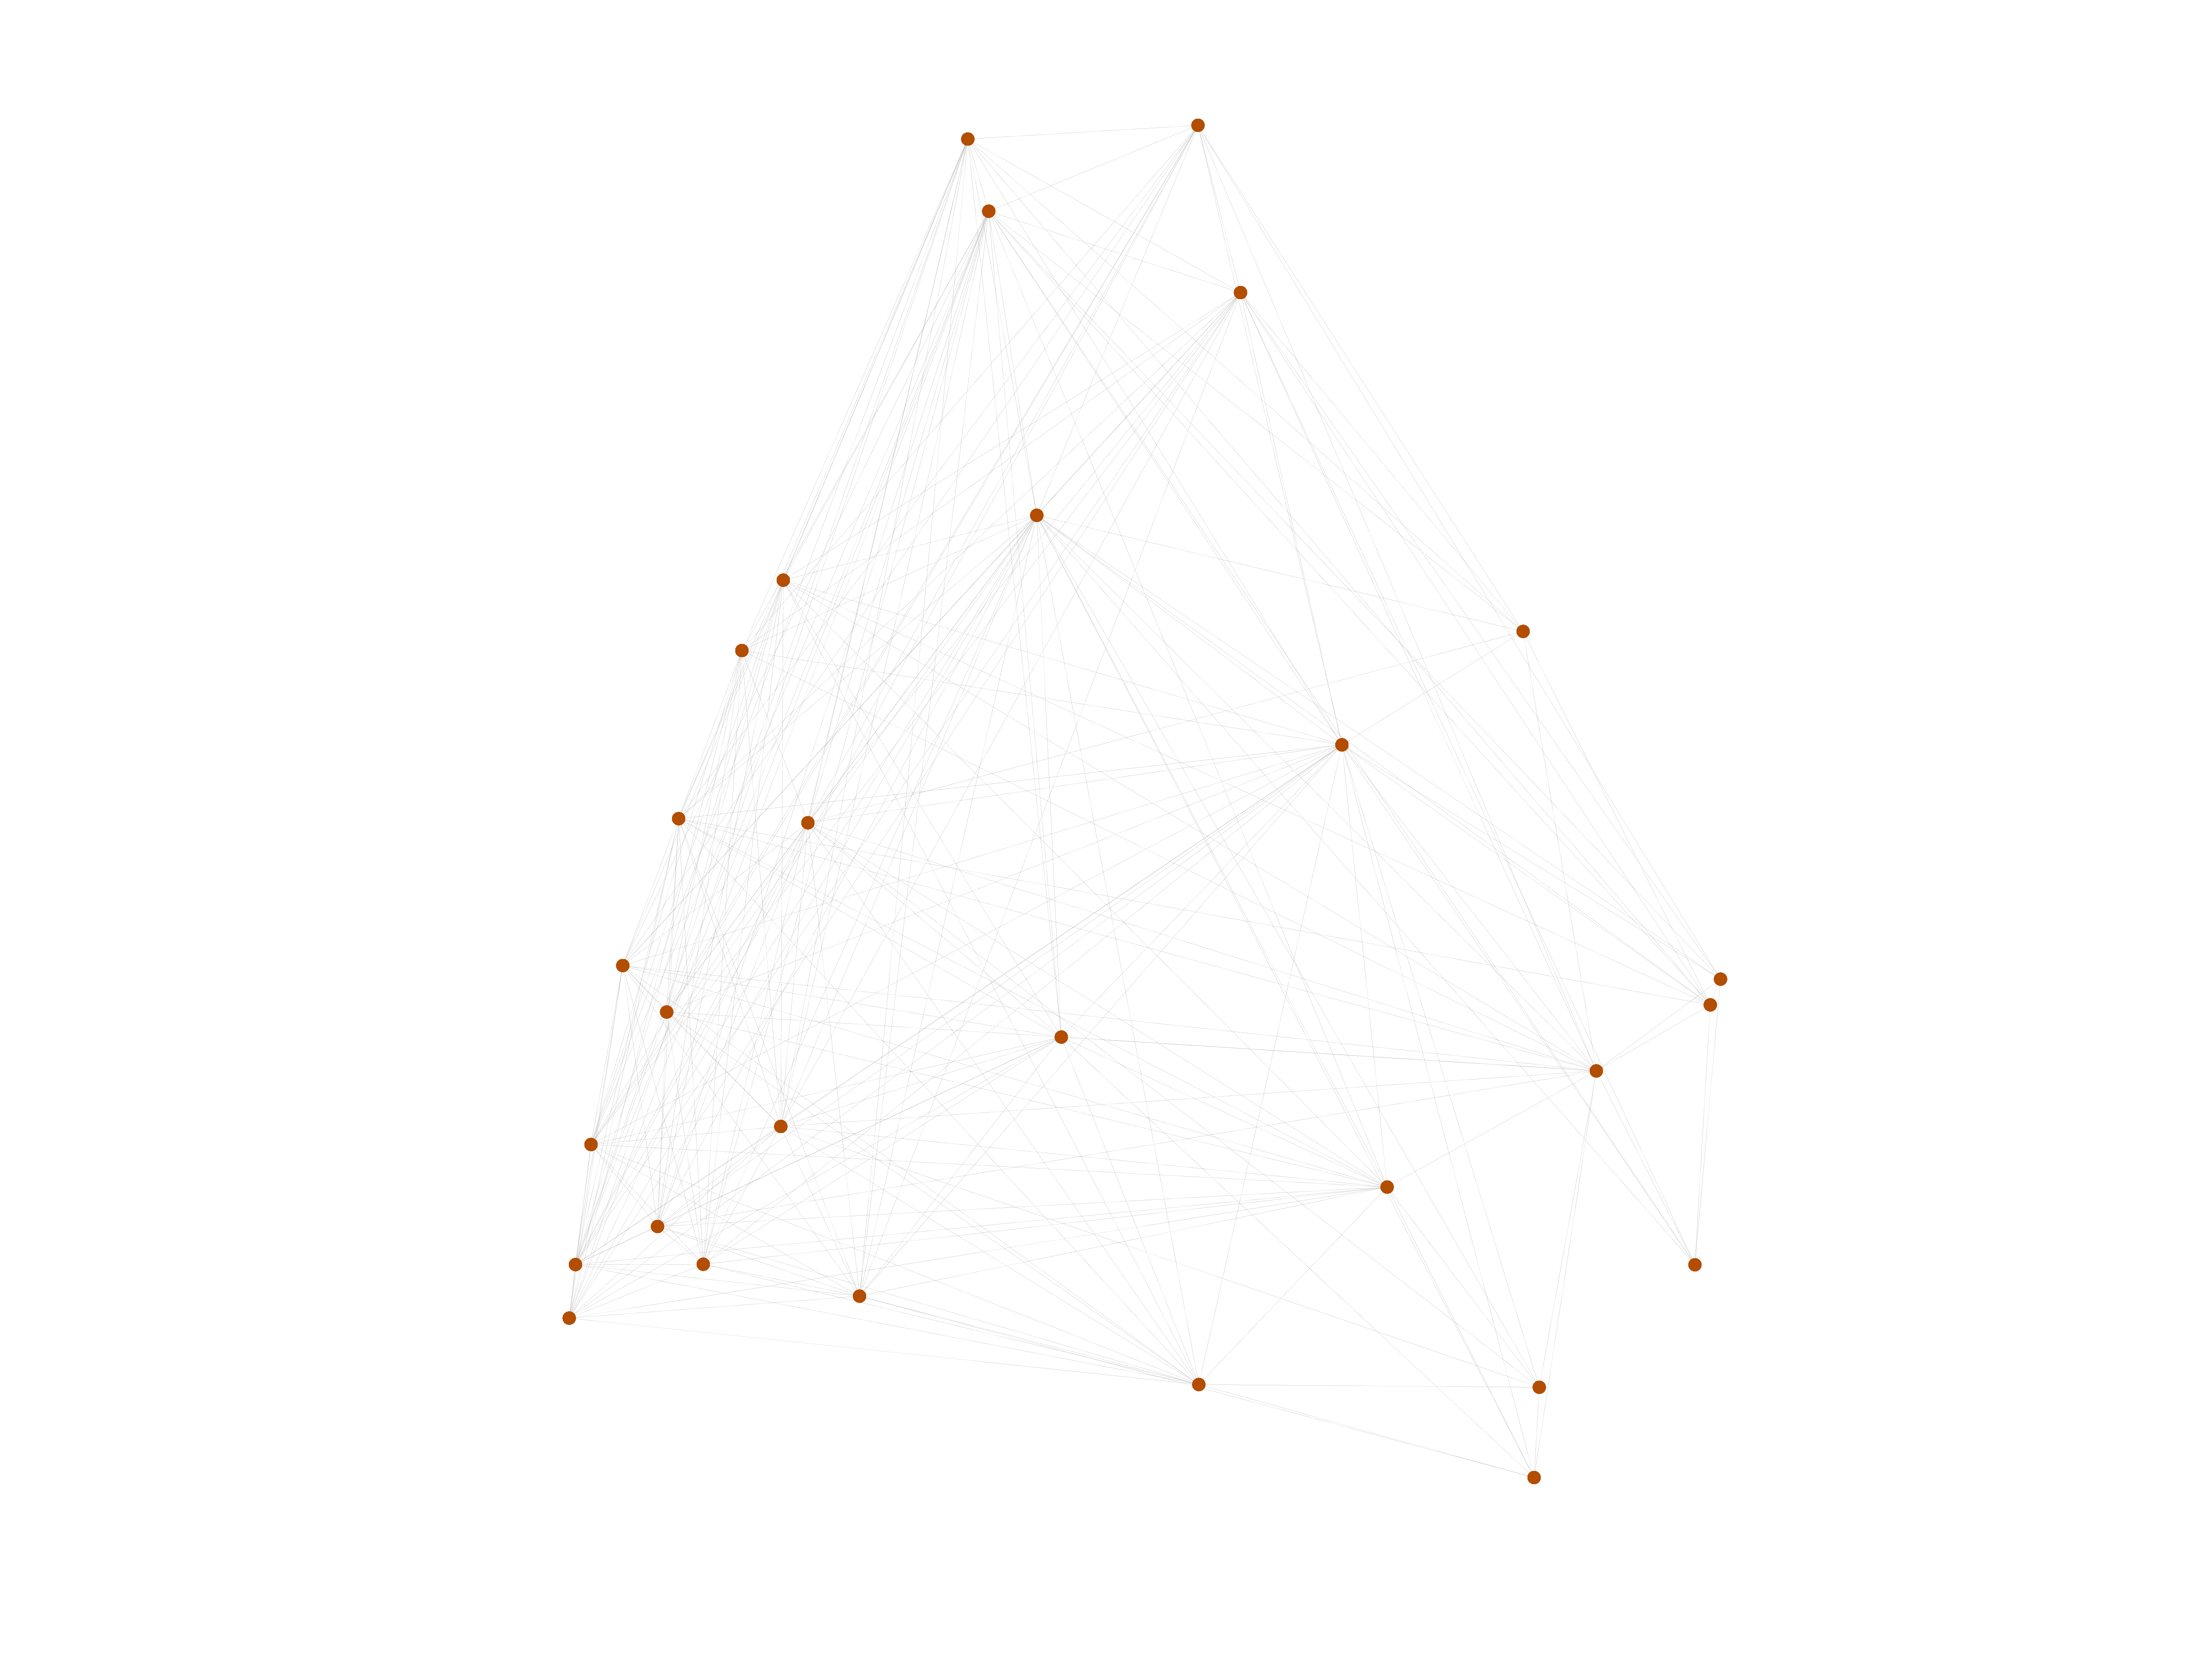
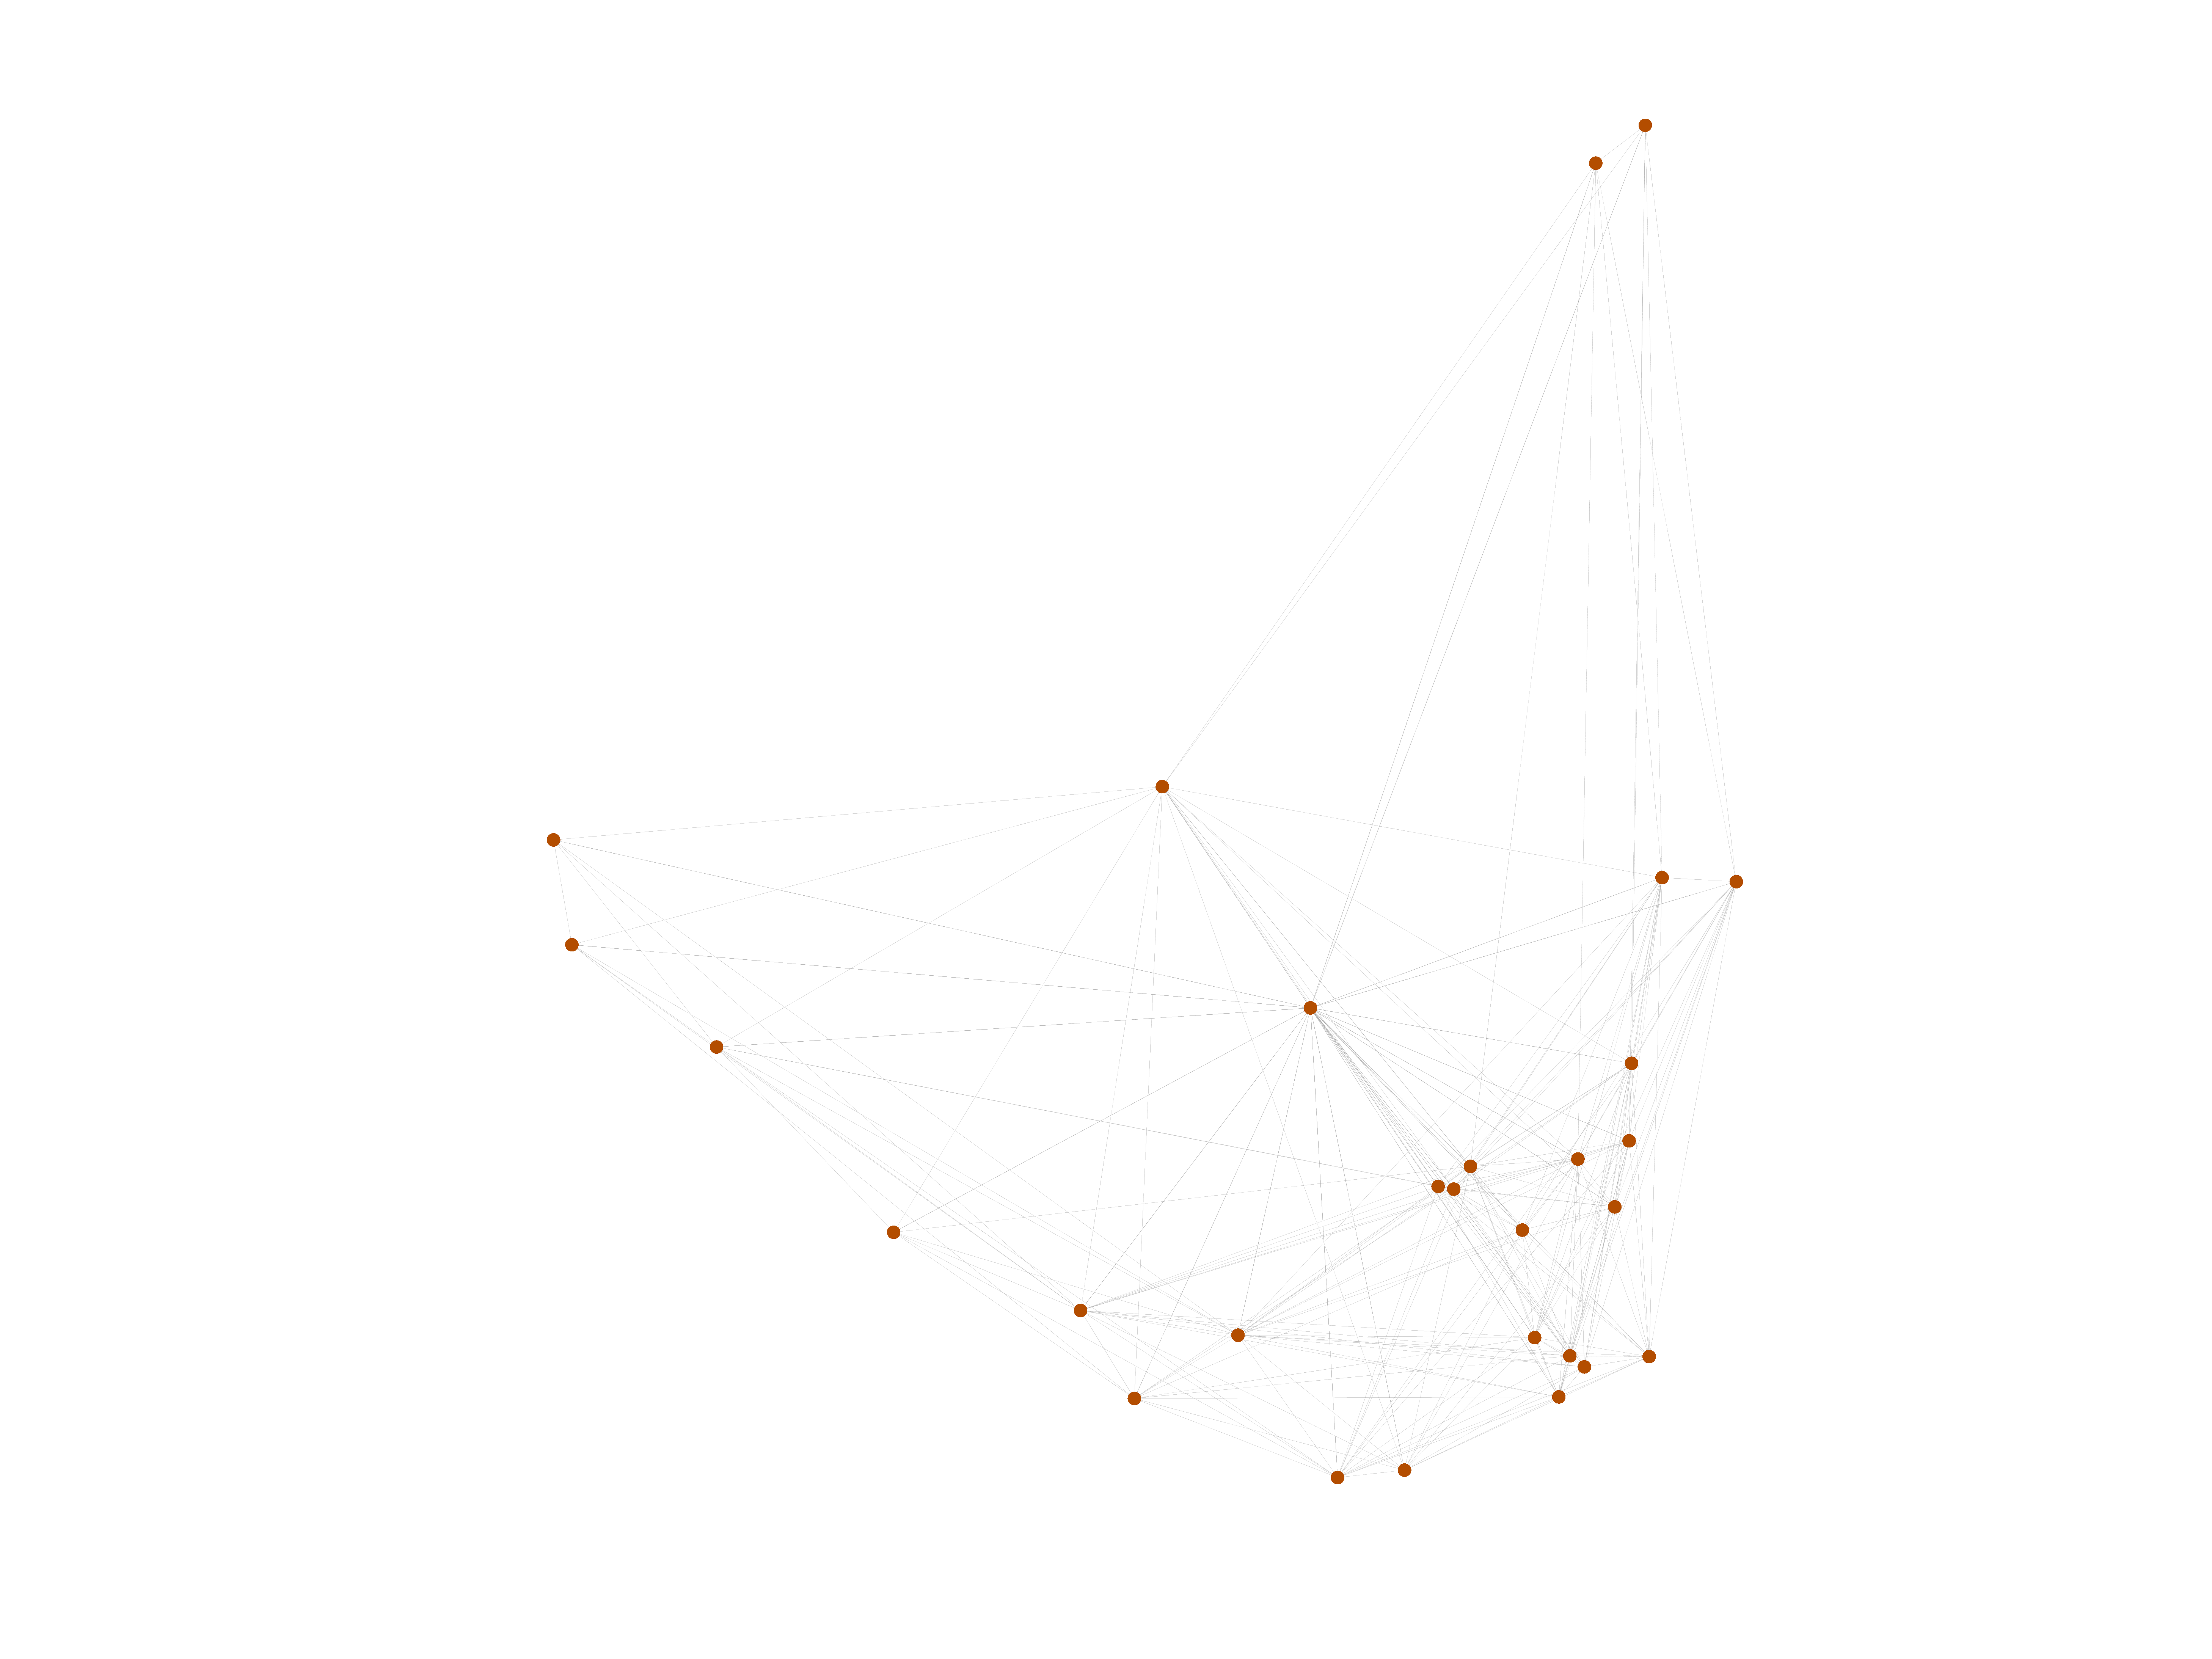
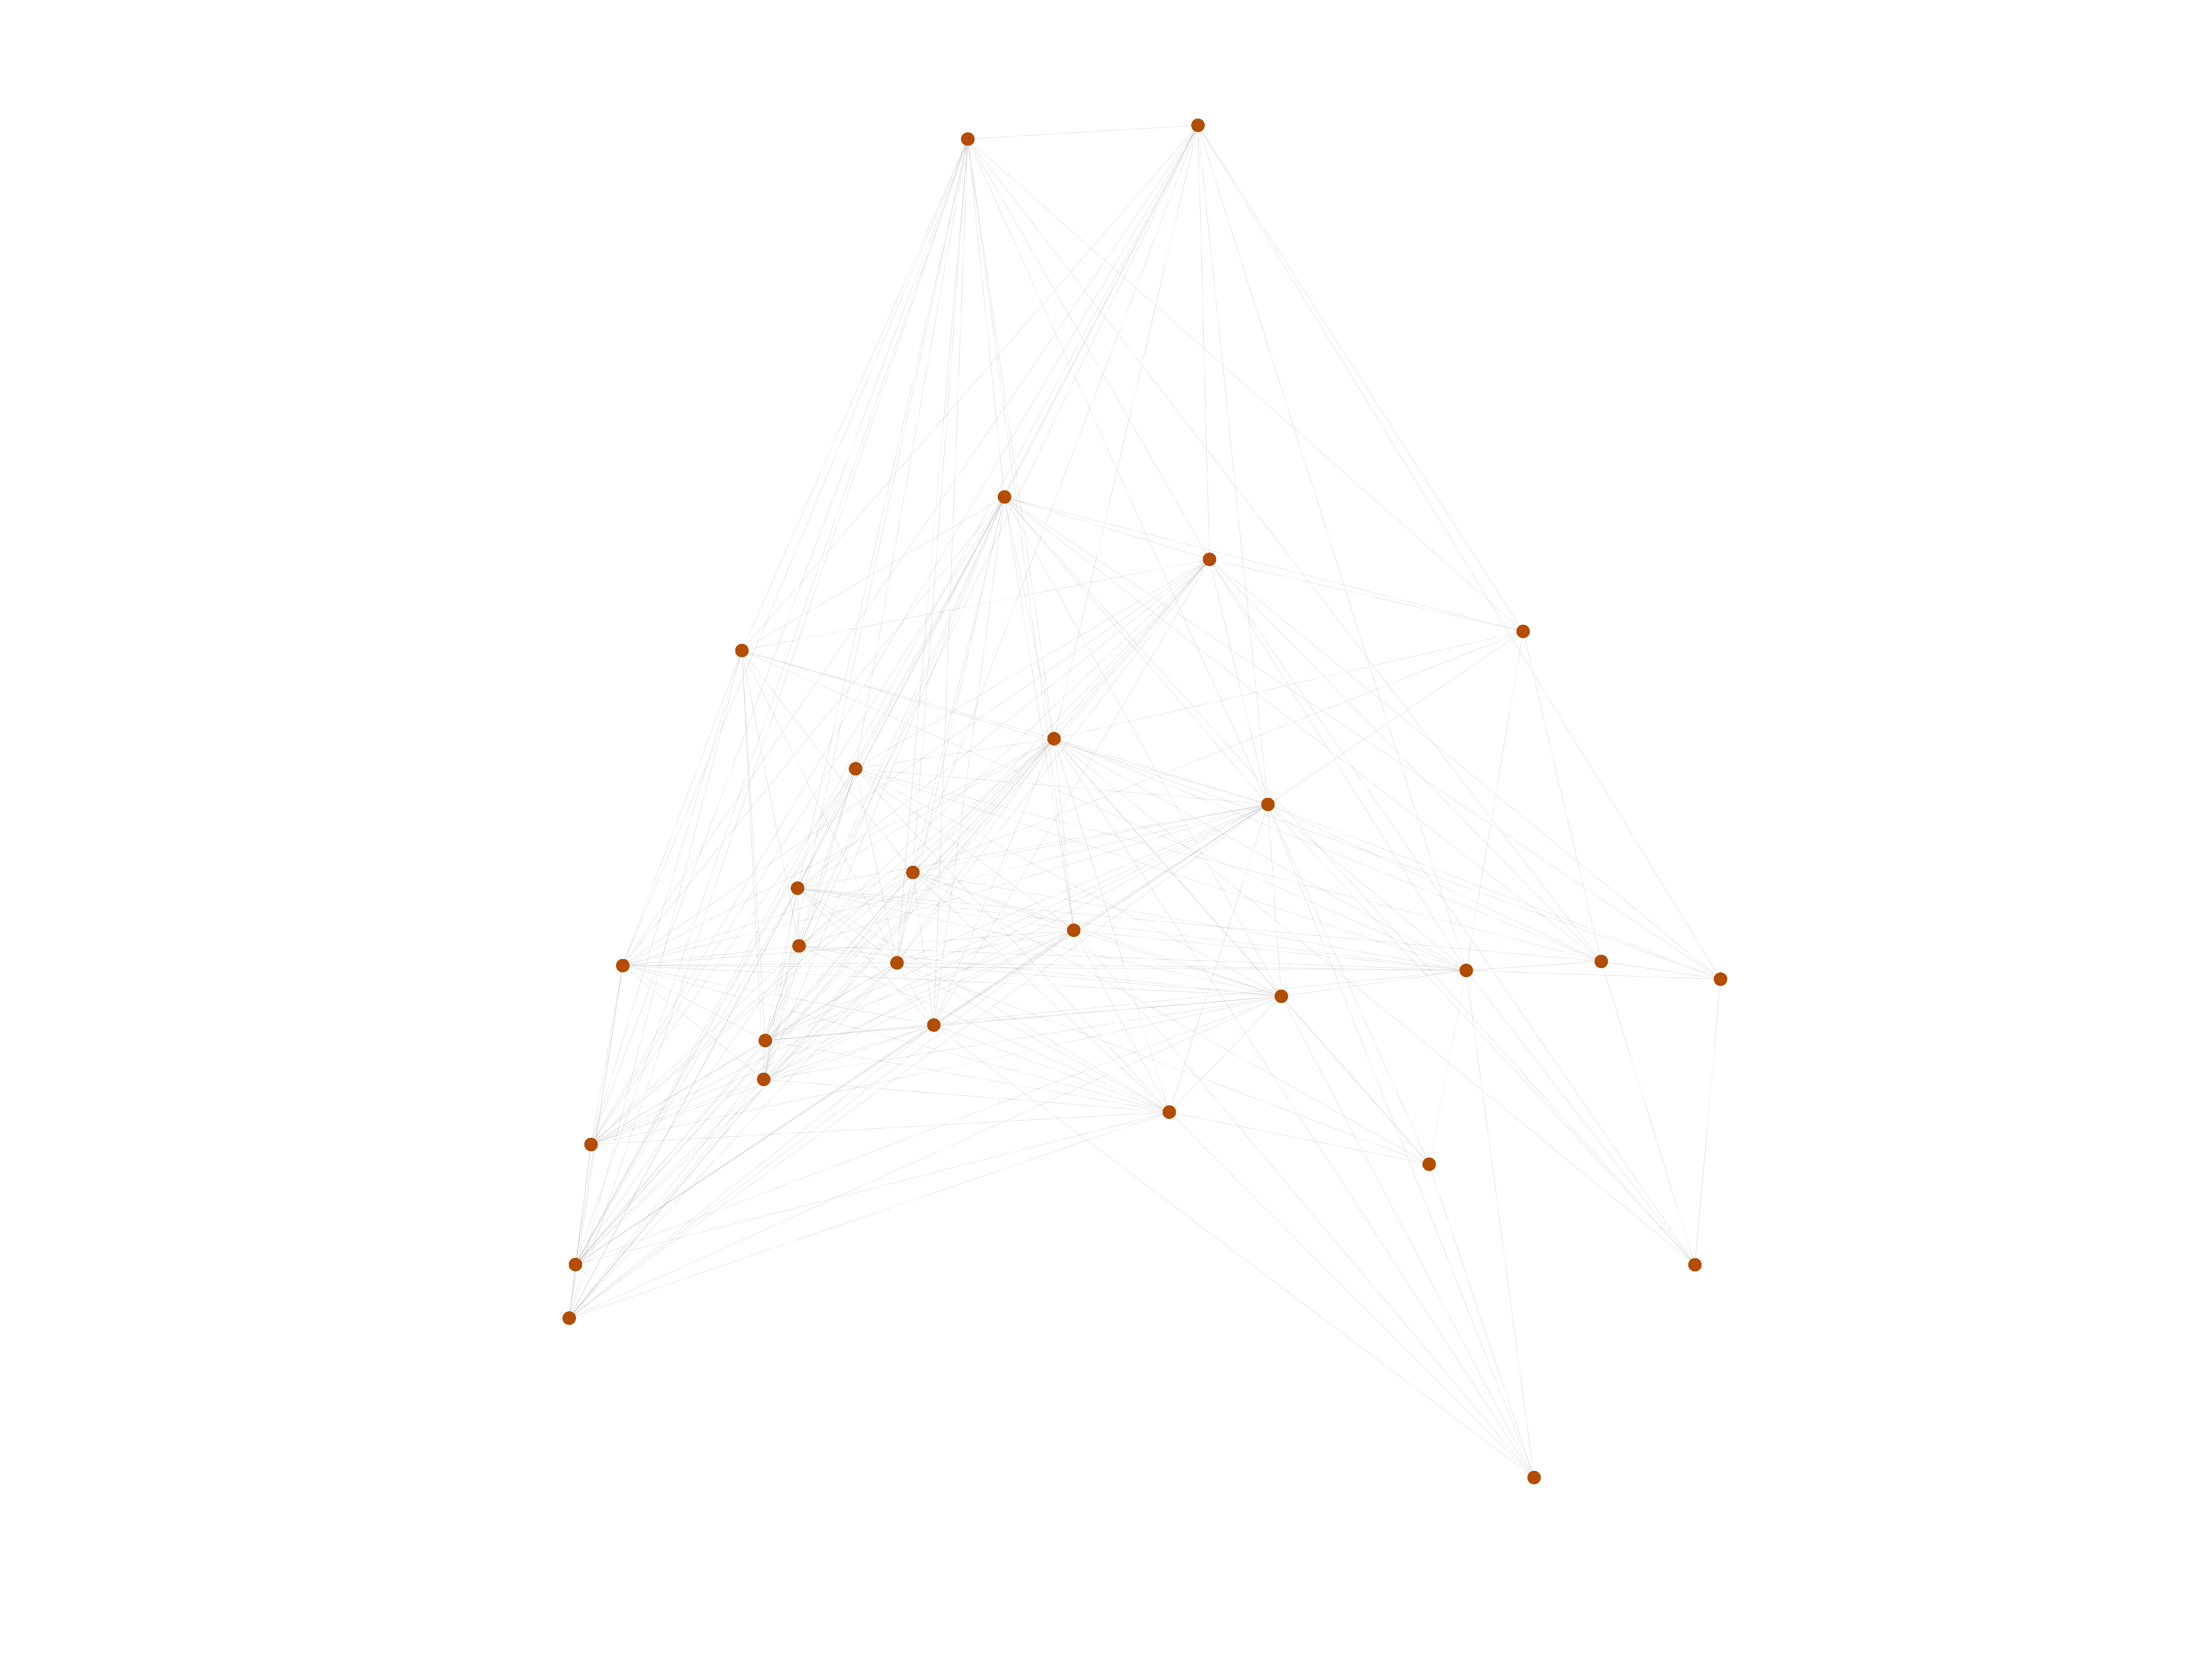
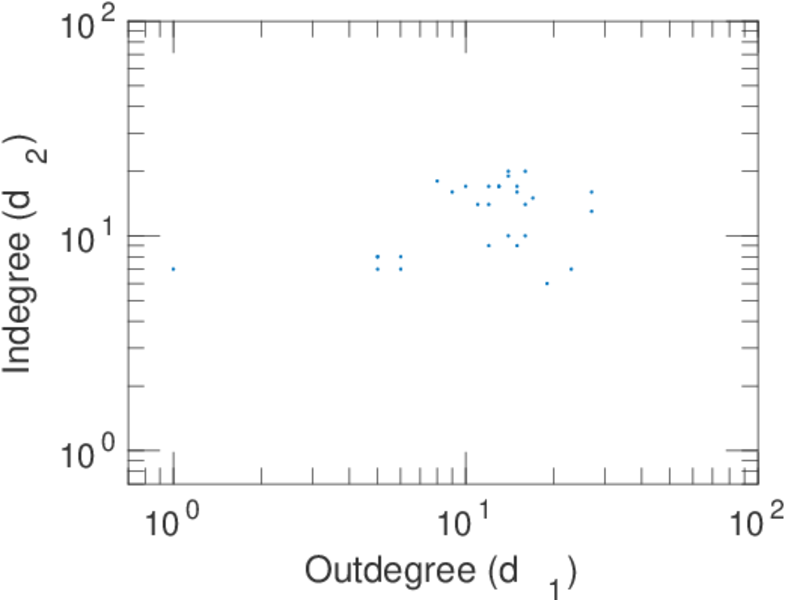
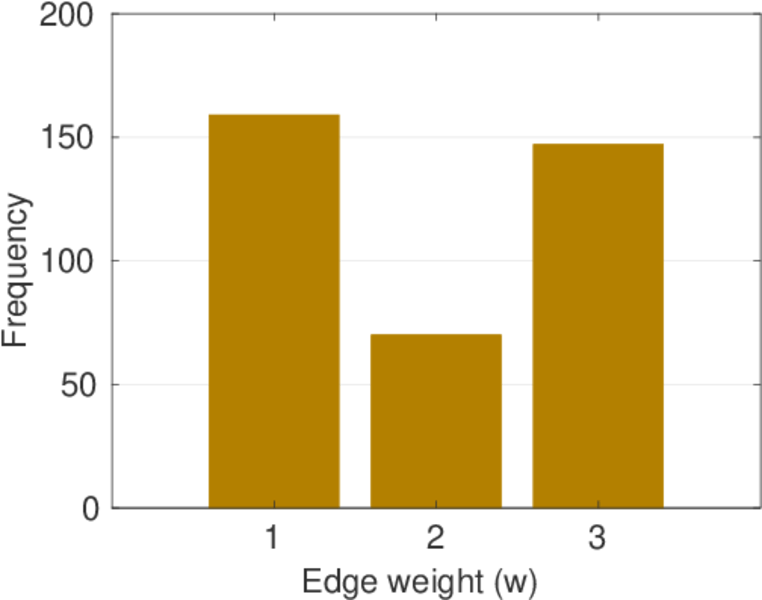
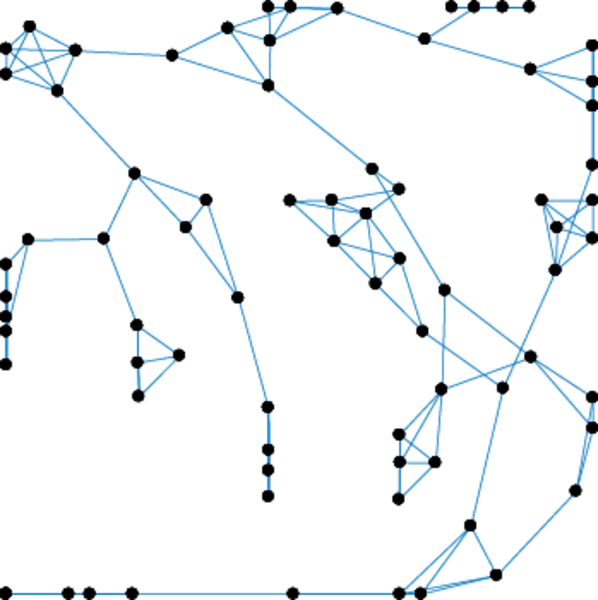
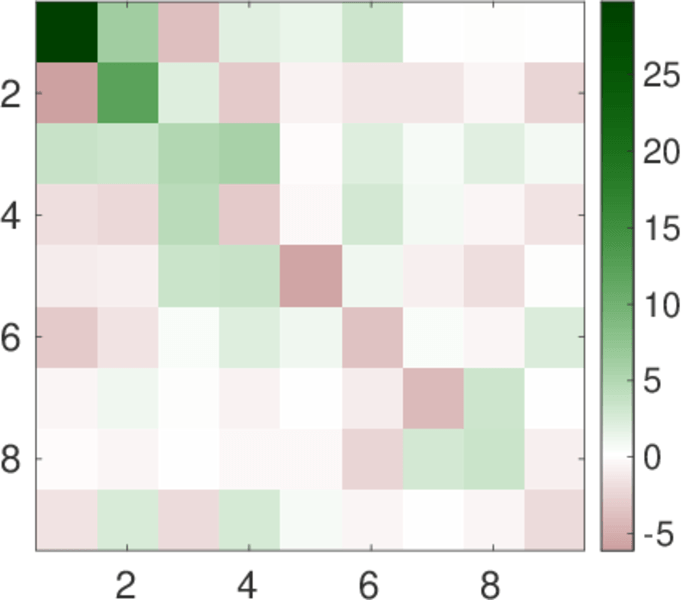
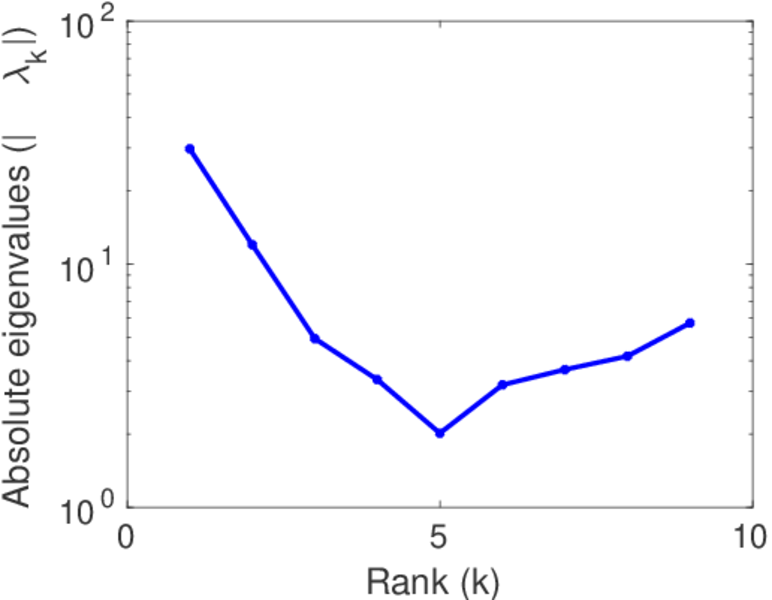
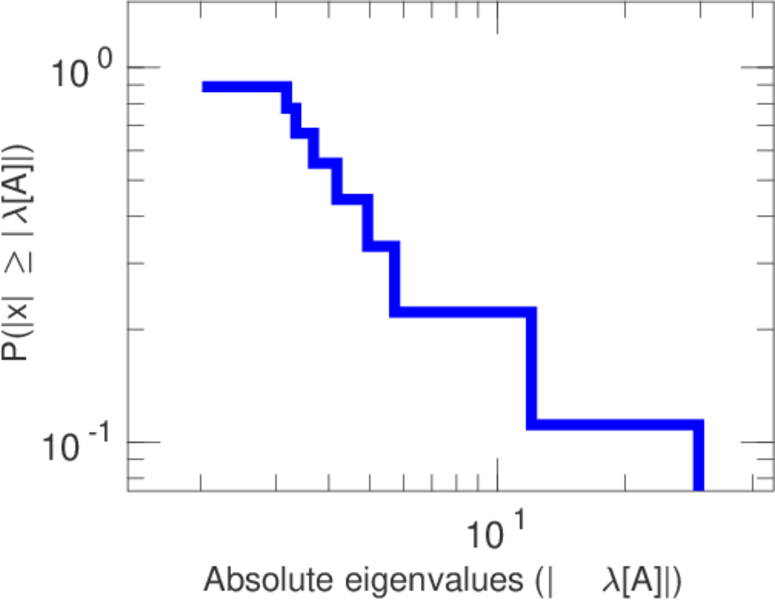
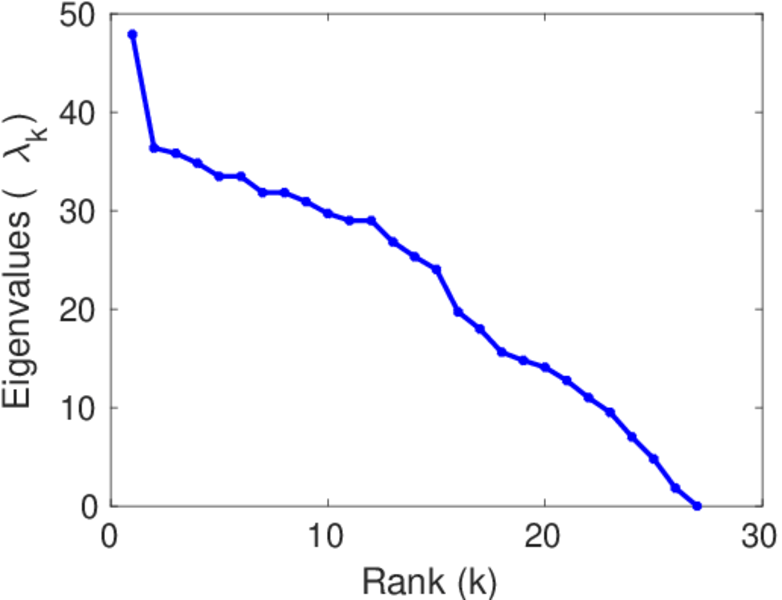
This directed network contains proximity ratings between studetns from 29 seventh grade students from a school in Victoria. Among other questions the students were asked to nominate their preferred classmates for three different activities. A node represents a student. An edge between two nodes shows that the left student picked the right student as his answer. The edge weights are between 1 and 3 and show how often the left student chose the right student as his favourite.

Metadata

CodeMX
Internal namemoreno_seventh
NameSeventh graders
Data sourcehttp://moreno.ss.uci.edu/data.html#seventh
AvailabilityDataset is available for download
Consistency checkDataset passed all tests
Category
Human social network
Node meaningStudent
Edge meaningProximity
Network formatUnipartite, directed
Edge typePositive weights, no multiple edges
ReciprocalContains reciprocal edges
Directed cyclesContains directed cycles
LoopsDoes not contain loops

Statistics

Size n =29
Volume m =376
Loop count l =0
Wedge count s =4,476
Claw count z =99,611
Cross count x =729,055
Triangle count t =1,095
Square count q =13,524
4-Tour count T4 =126,596
Maximum degree dmax =43
Maximum outdegree d+max =27
Maximum indegree dmax =20
Average degree d =25.931 0
Fill p =0.463 054
Size of LCC N =29
Size of LSCC Ns =29
Relative size of LSCC Nrs =1.000 00
Diameter δ =2
50-Percentile effective diameter δ0.5 =0.826 364
90-Percentile effective diameter δ0.9 =1.750 77
Median distance δM =1
Mean distance δm =1.371 25
Gini coefficient G =0.180 026
Balanced inequality ratio P =0.428 191
Outdegree balanced inequality ratio P+ =0.377 660
Indegree balanced inequality ratio P =0.401 596
Relative edge distribution entropy Her =0.982 628
Power law exponent γ =2.188 41
Tail power law exponent γt =7.811 00
Tail power law exponent with p γ3 =7.811 00
p-value p =0.818 000
Outdegree tail power law exponent with p γ3,o =5.121 00
Outdegree p-value po =0.638 000
Indegree tail power law exponent with p γ3,i =8.991 00
Indegree p-value pi =0.419 000
Degree assortativity ρ =−0.157 512
Degree assortativity p-value pρ =0.000 407 219
In/outdegree correlation ρ± =+0.406 183
Clustering coefficient c =0.733 914
Directed clustering coefficient c± =0.652 579
Spectral norm α =59.625 8
Operator 2-norm ν =31.875 5
Cyclic eigenvalue π =26.759 4
Algebraic connectivity a =11.938 1
Spectral separation 1[A] / λ2[A]| =2.274 36
Reciprocity y =0.670 213
Non-bipartivity bA =0.736 441
Normalized non-bipartivity bN =0.702 142
Algebraic non-bipartivity χ =6.271 56
Spectral bipartite frustration bK =0.090 937 6
Controllability C =0
Relative controllability Cr =0.000 00

Plots

Fruchterman–Reingold graph drawing

Degree distribution

Cumulative degree distribution

Lorenz curve

Spectral distribution of the adjacency matrix

Spectral distribution of the normalized adjacency matrix

Spectral distribution of the Laplacian

Spectral graph drawing based on the adjacency matrix

Spectral graph drawing based on the Laplacian

Spectral graph drawing based on the normalized adjacency matrix

Degree assortativity

Zipf plot

Hop distribution

Double Laplacian graph drawing

Delaunay graph drawing

In/outdegree scatter plot

Edge weight/multiplicity distribution

Clustering coefficient distribution

Average neighbor degree distribution

SynGraphy

Matrix decompositions plots

Downloads

References

[1] Jérôme Kunegis. KONECT – The Koblenz Network Collection. In Proc. Int. Conf. on World Wide Web Companion, pages 1343–1350, 2013. [ http ]
[2] Duncan J. Watts and Steven H. Strogatz. Collective dynamics of `small-world' networks. Nature, 393(1):440–442, 1998.