 KONECT ‣ Networks ‣
Buy Me a Coffee
KONECT ‣ Networks ‣
Buy Me a Coffee
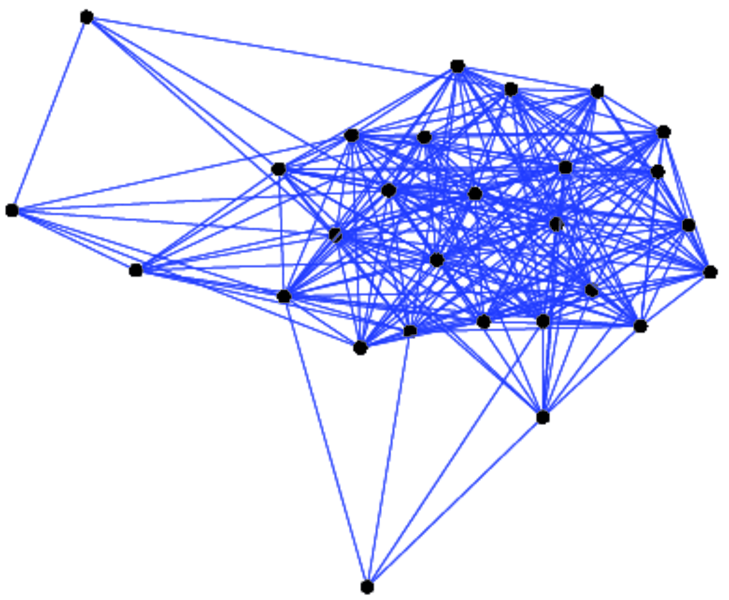
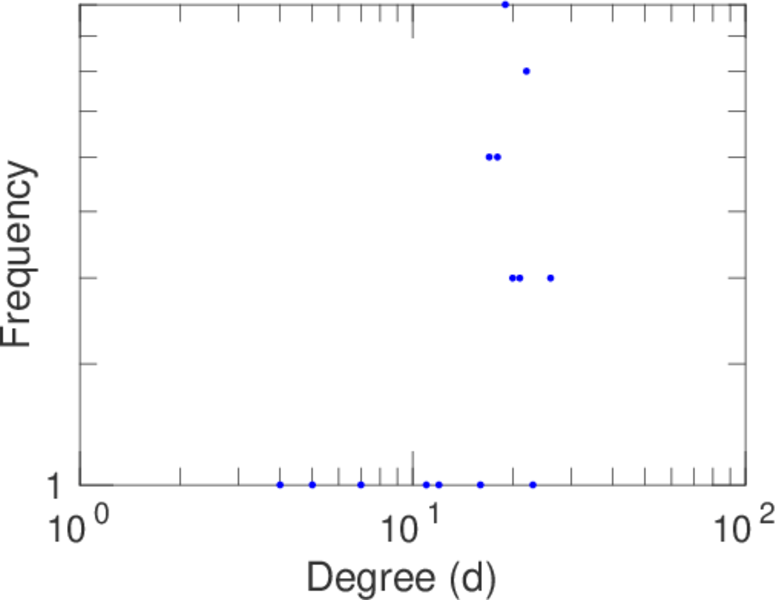
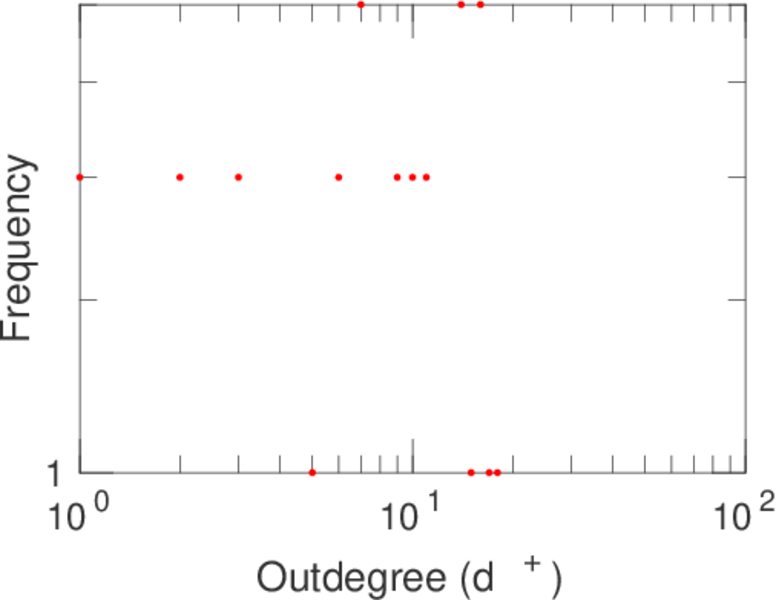
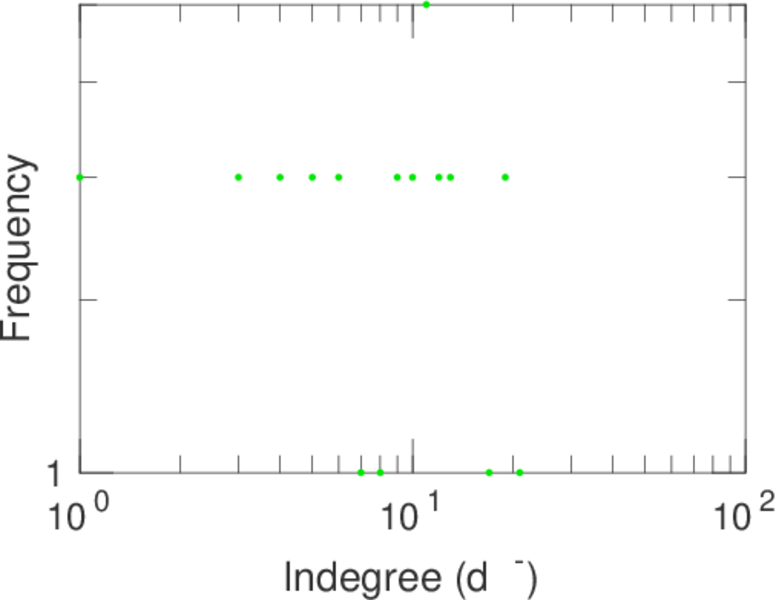
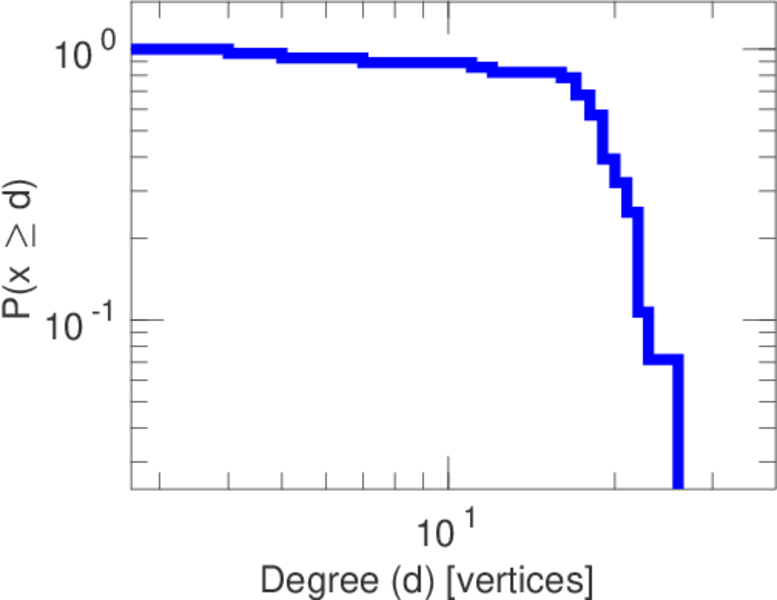
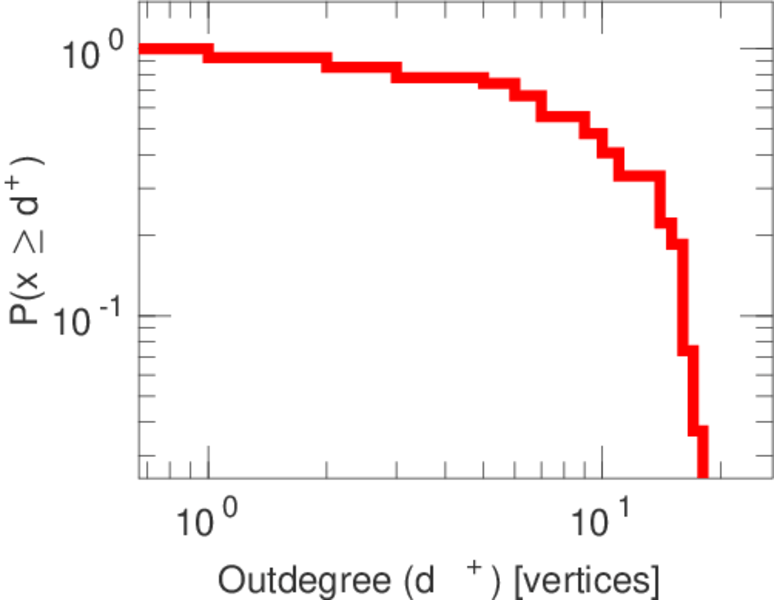
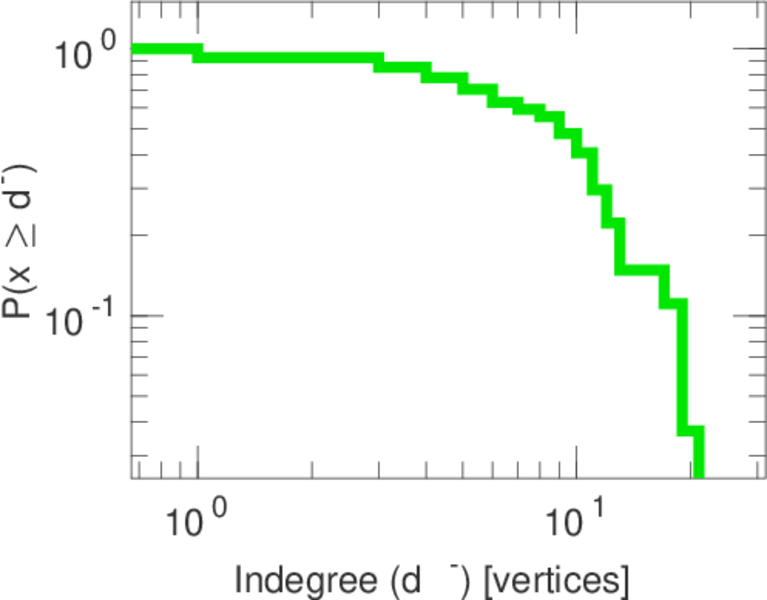
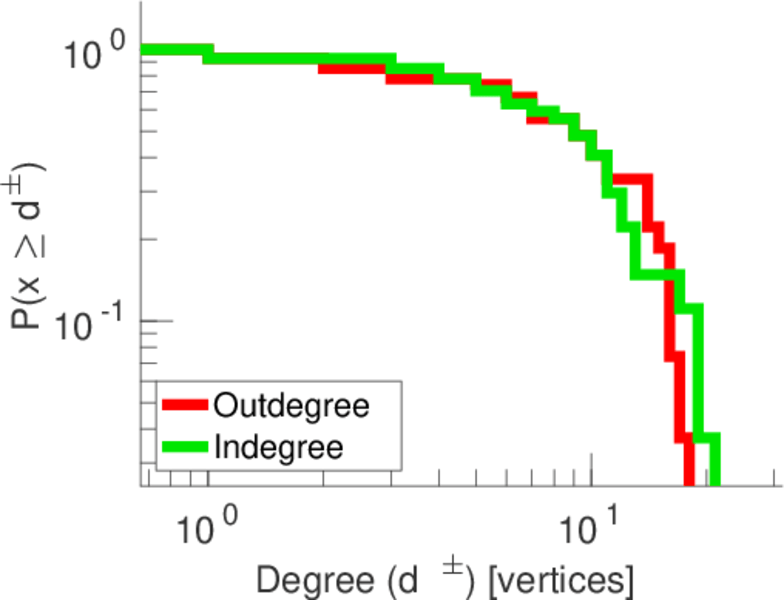
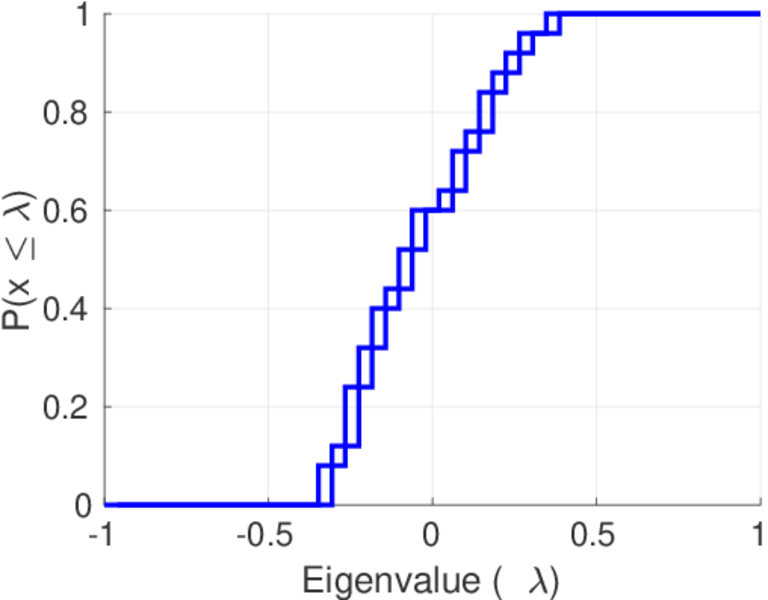
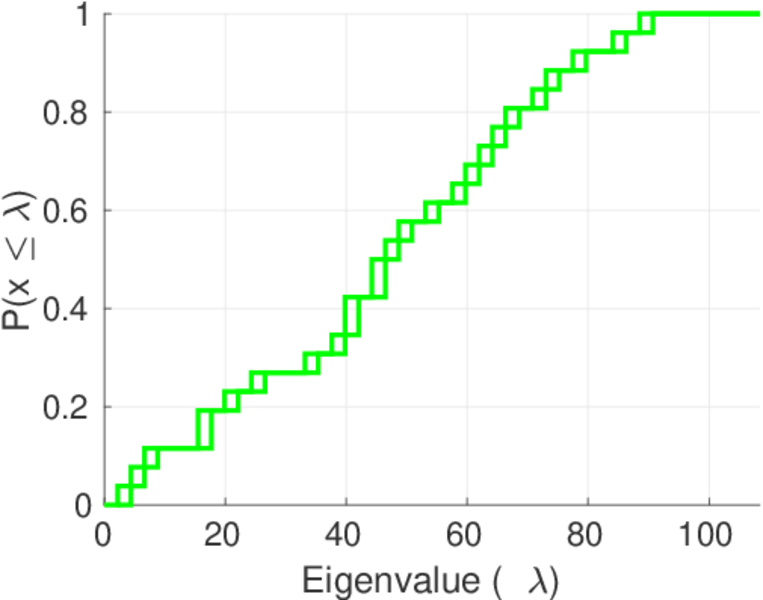
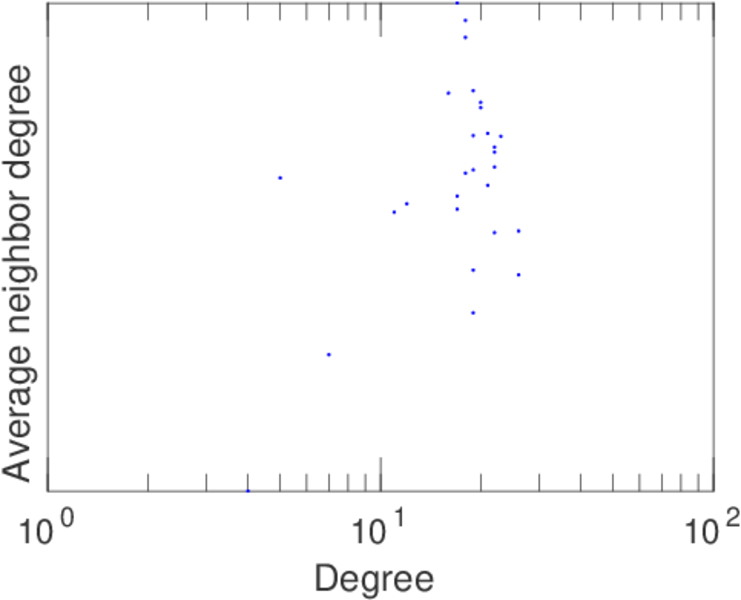
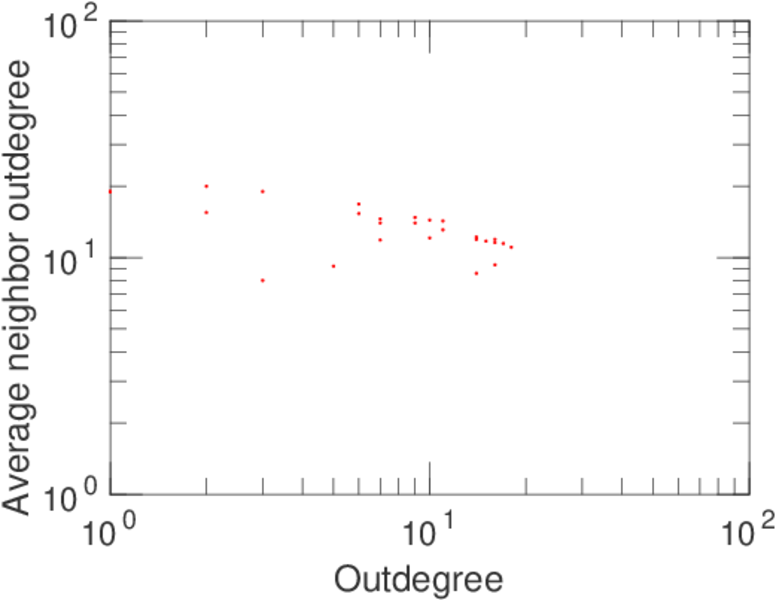
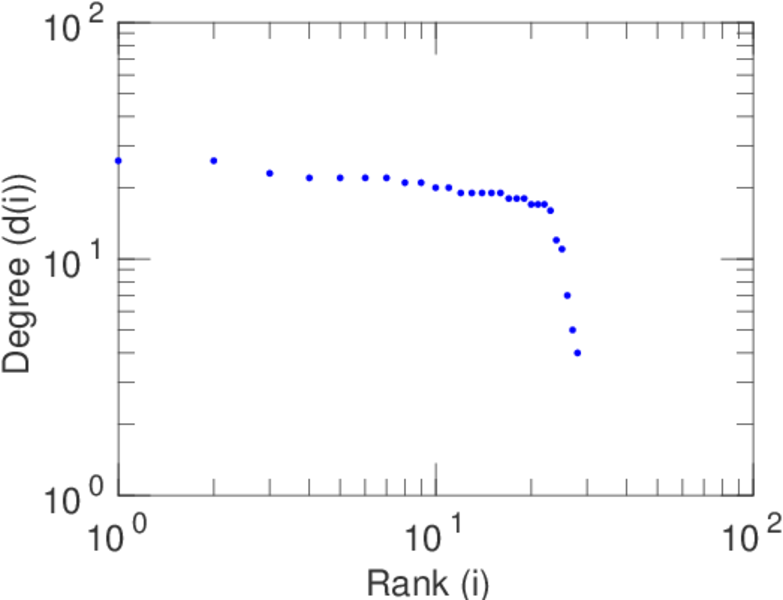
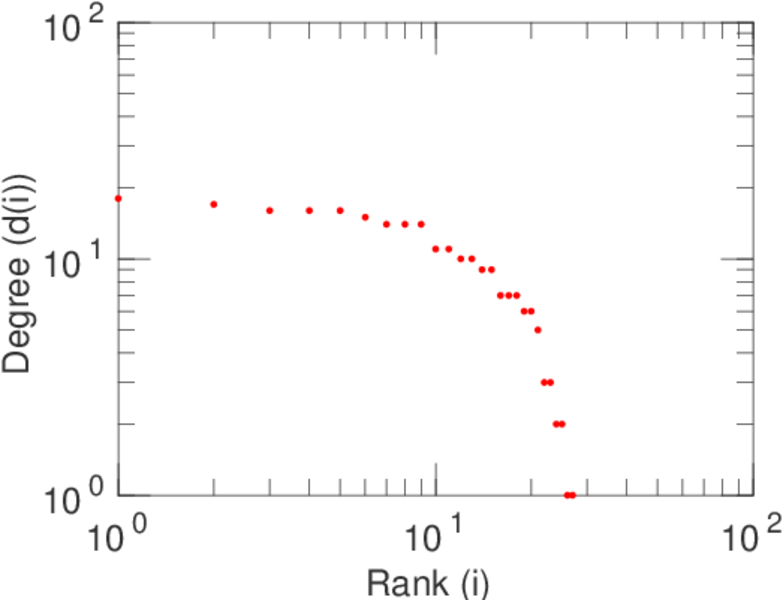
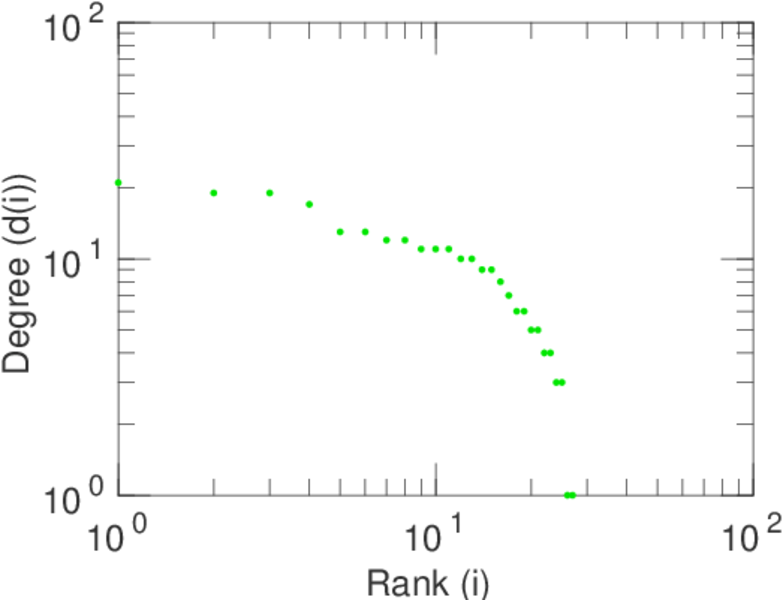
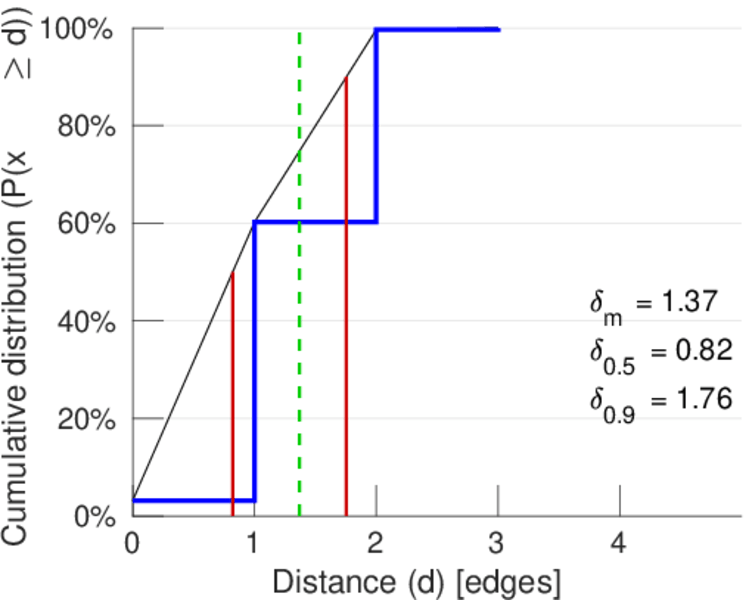
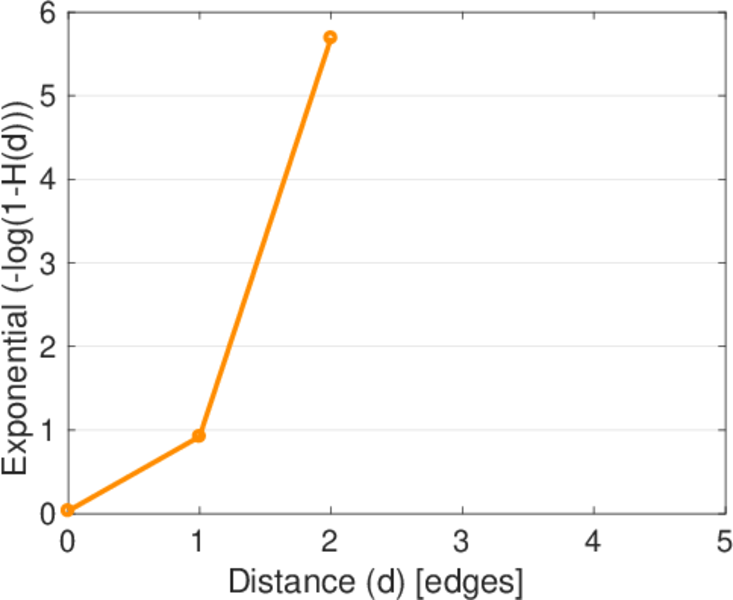
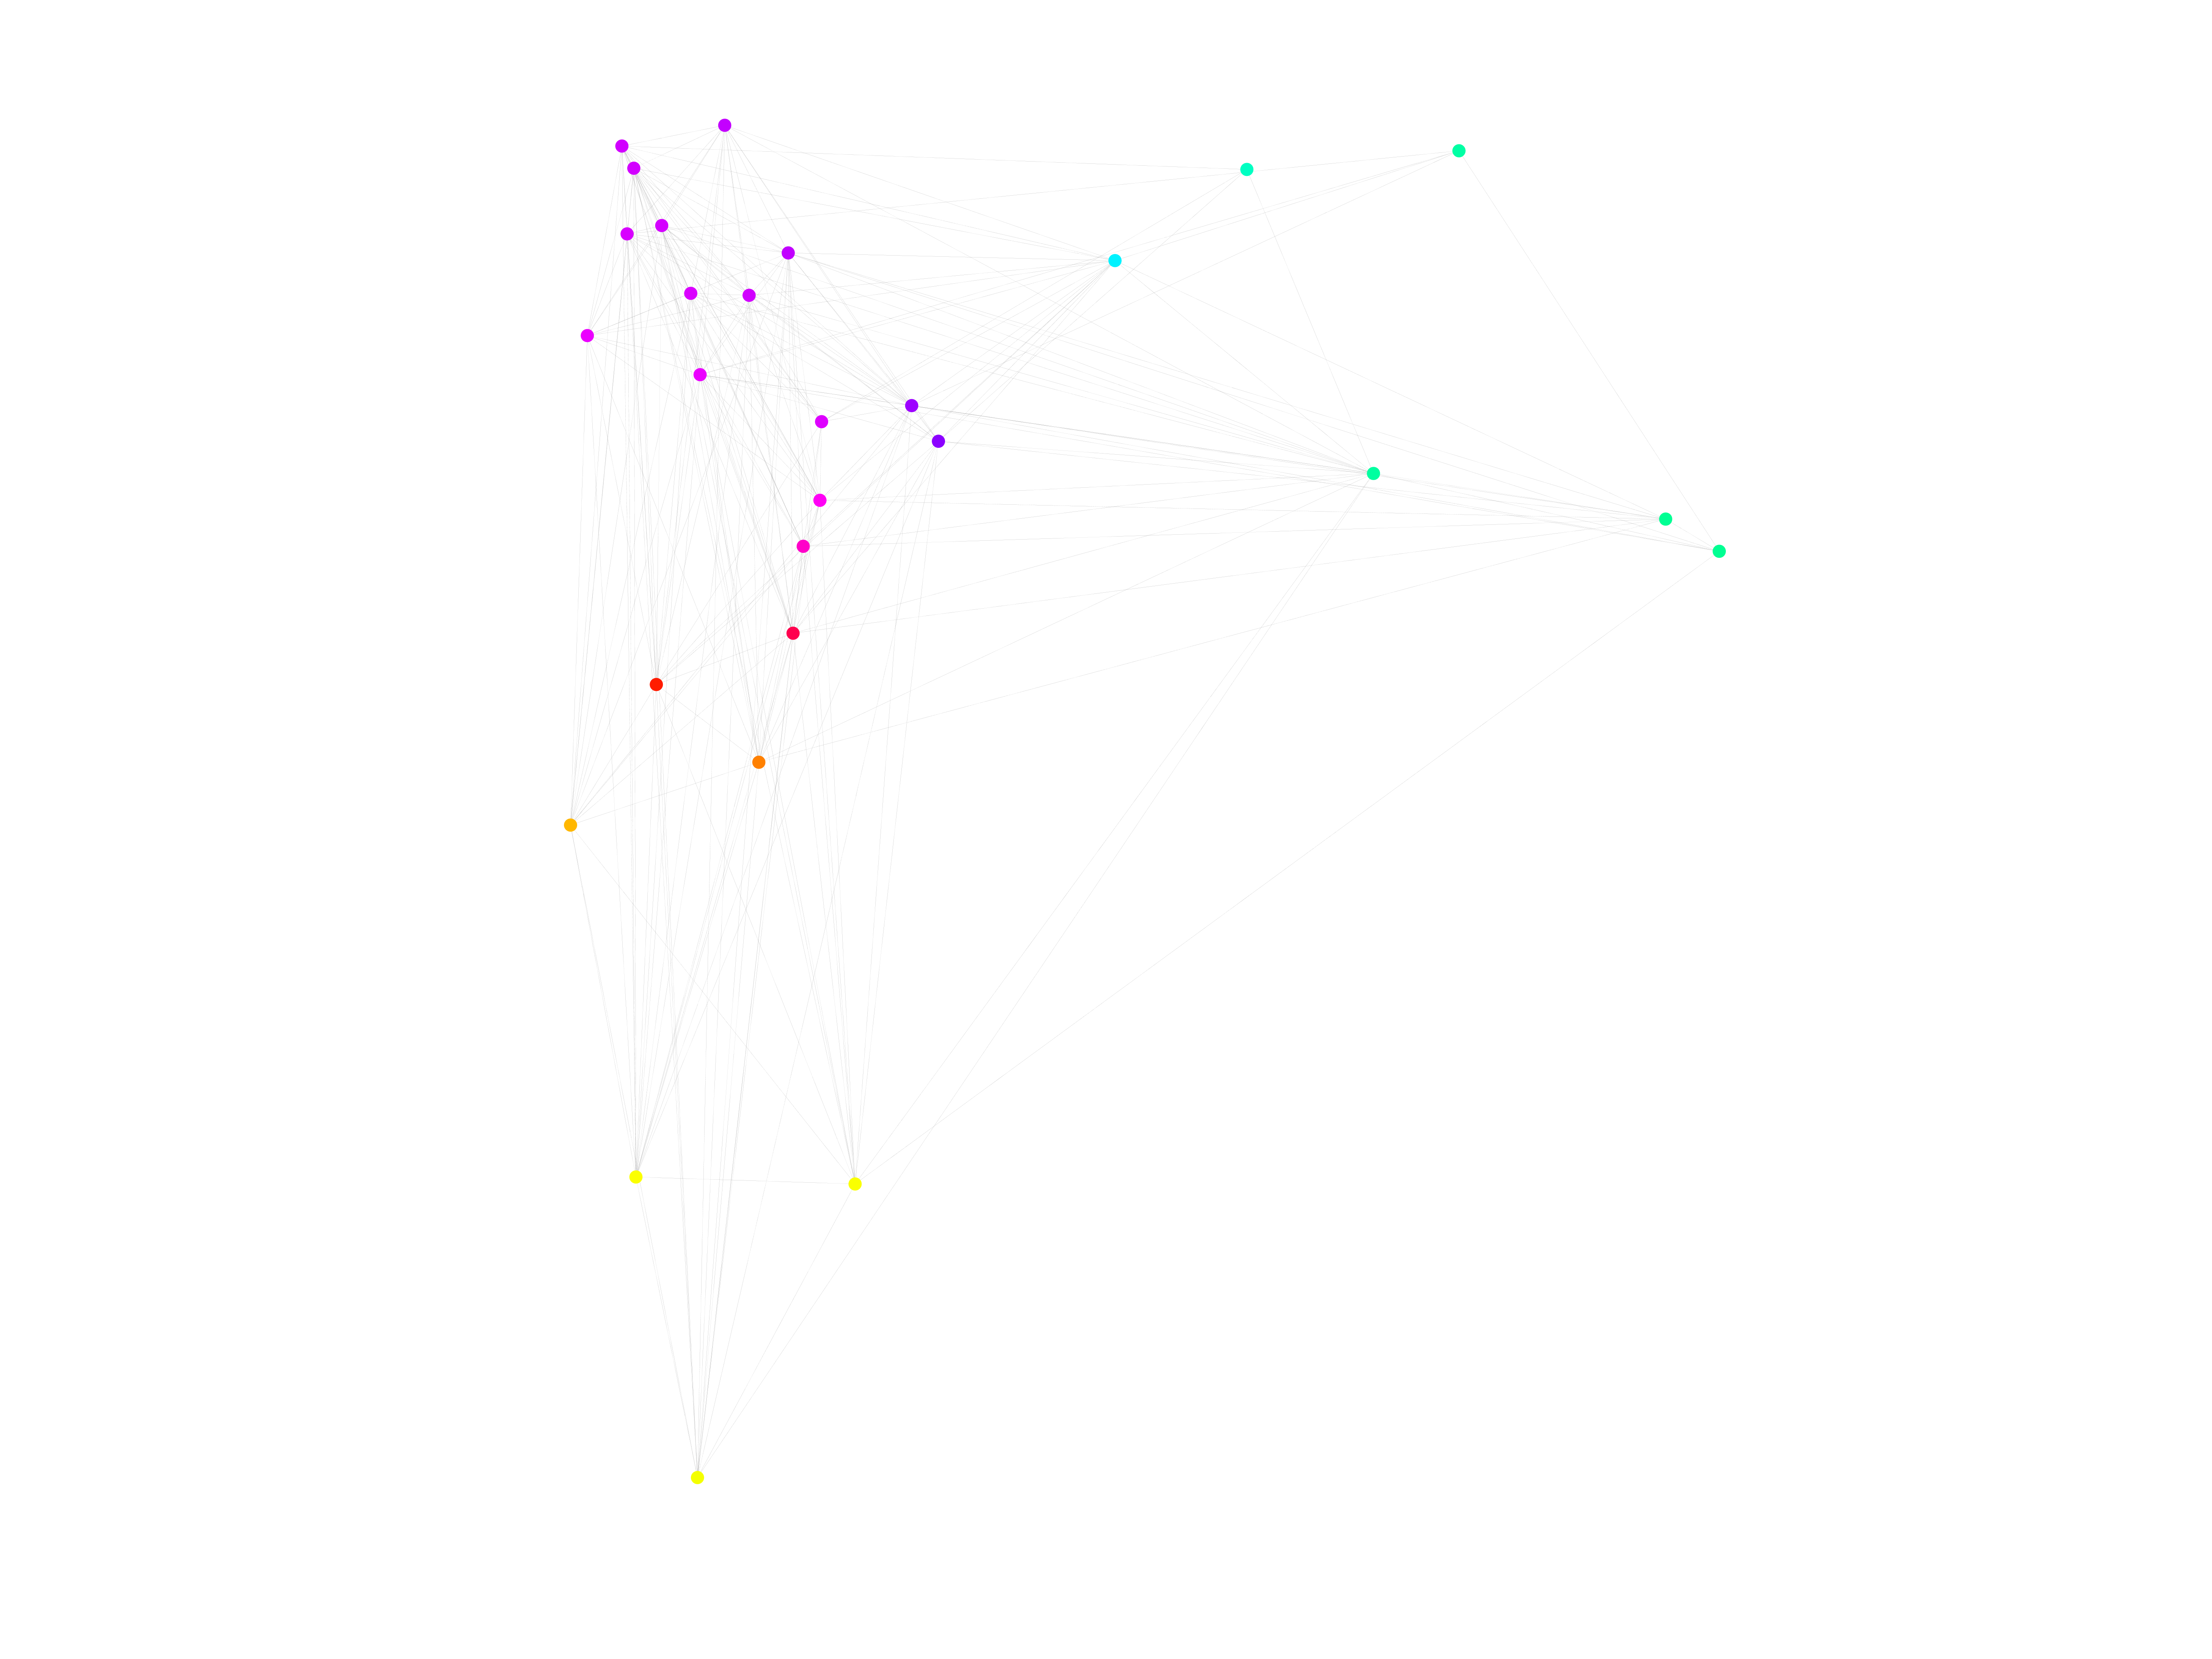
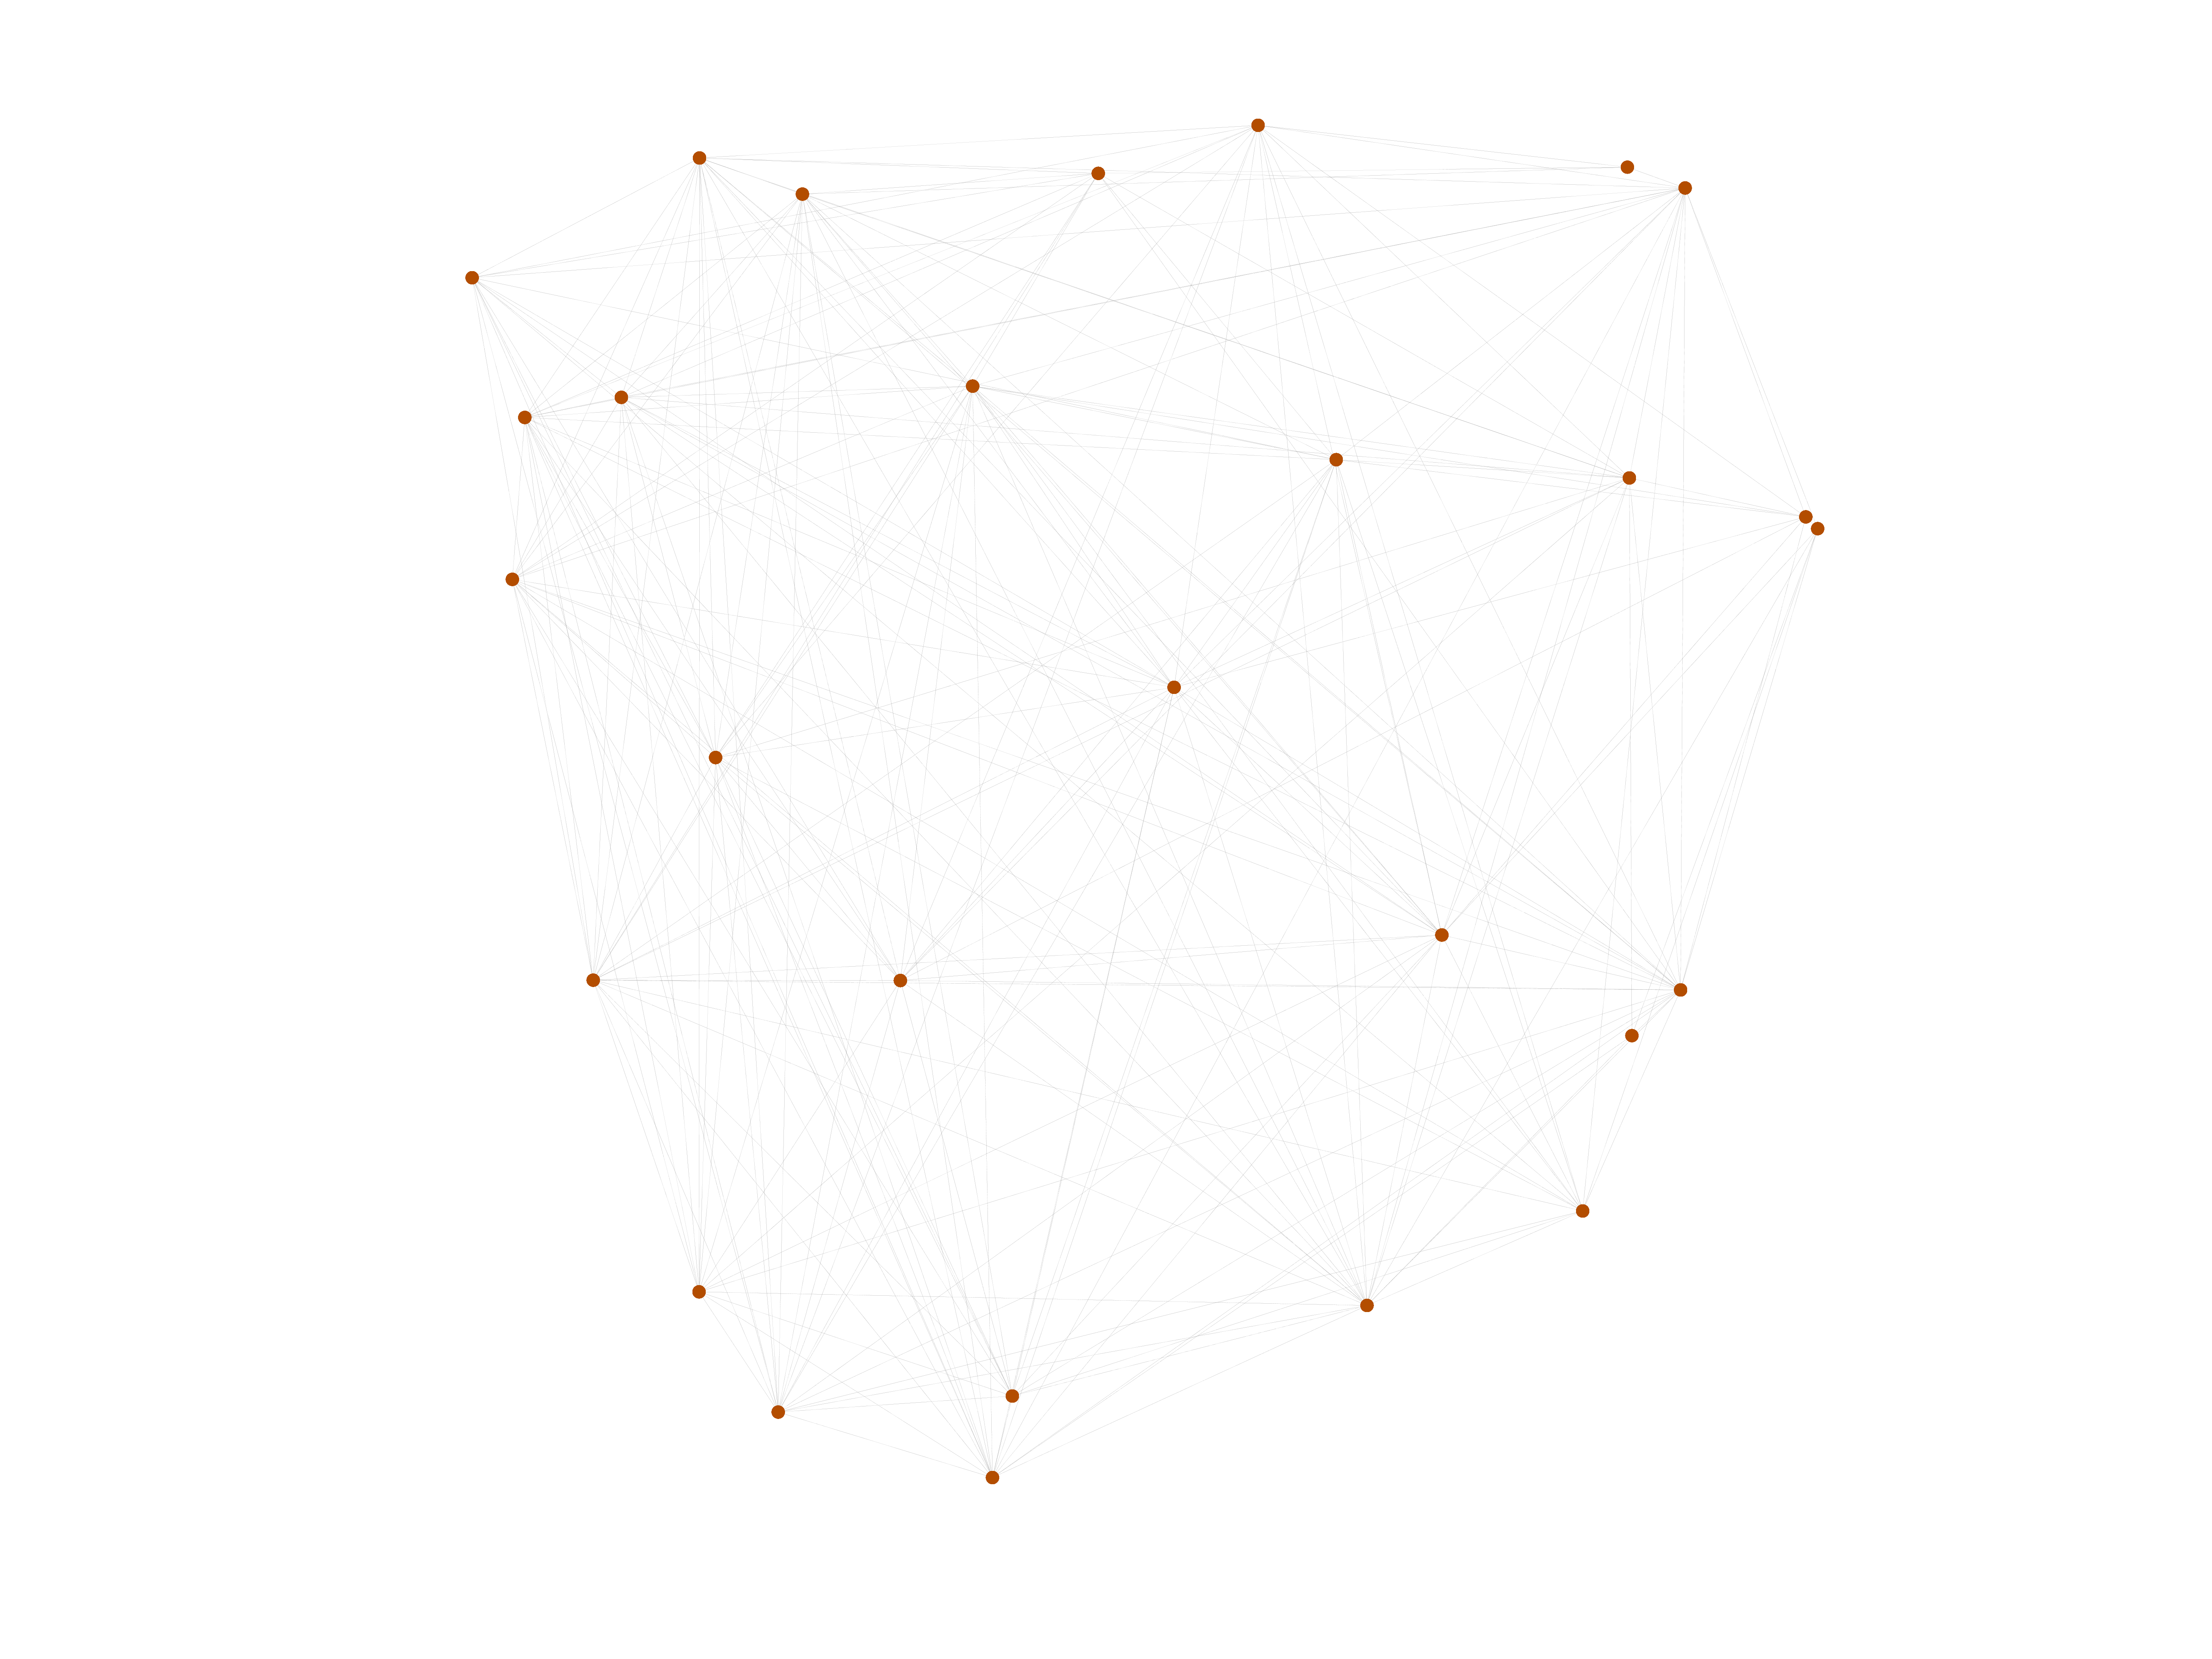
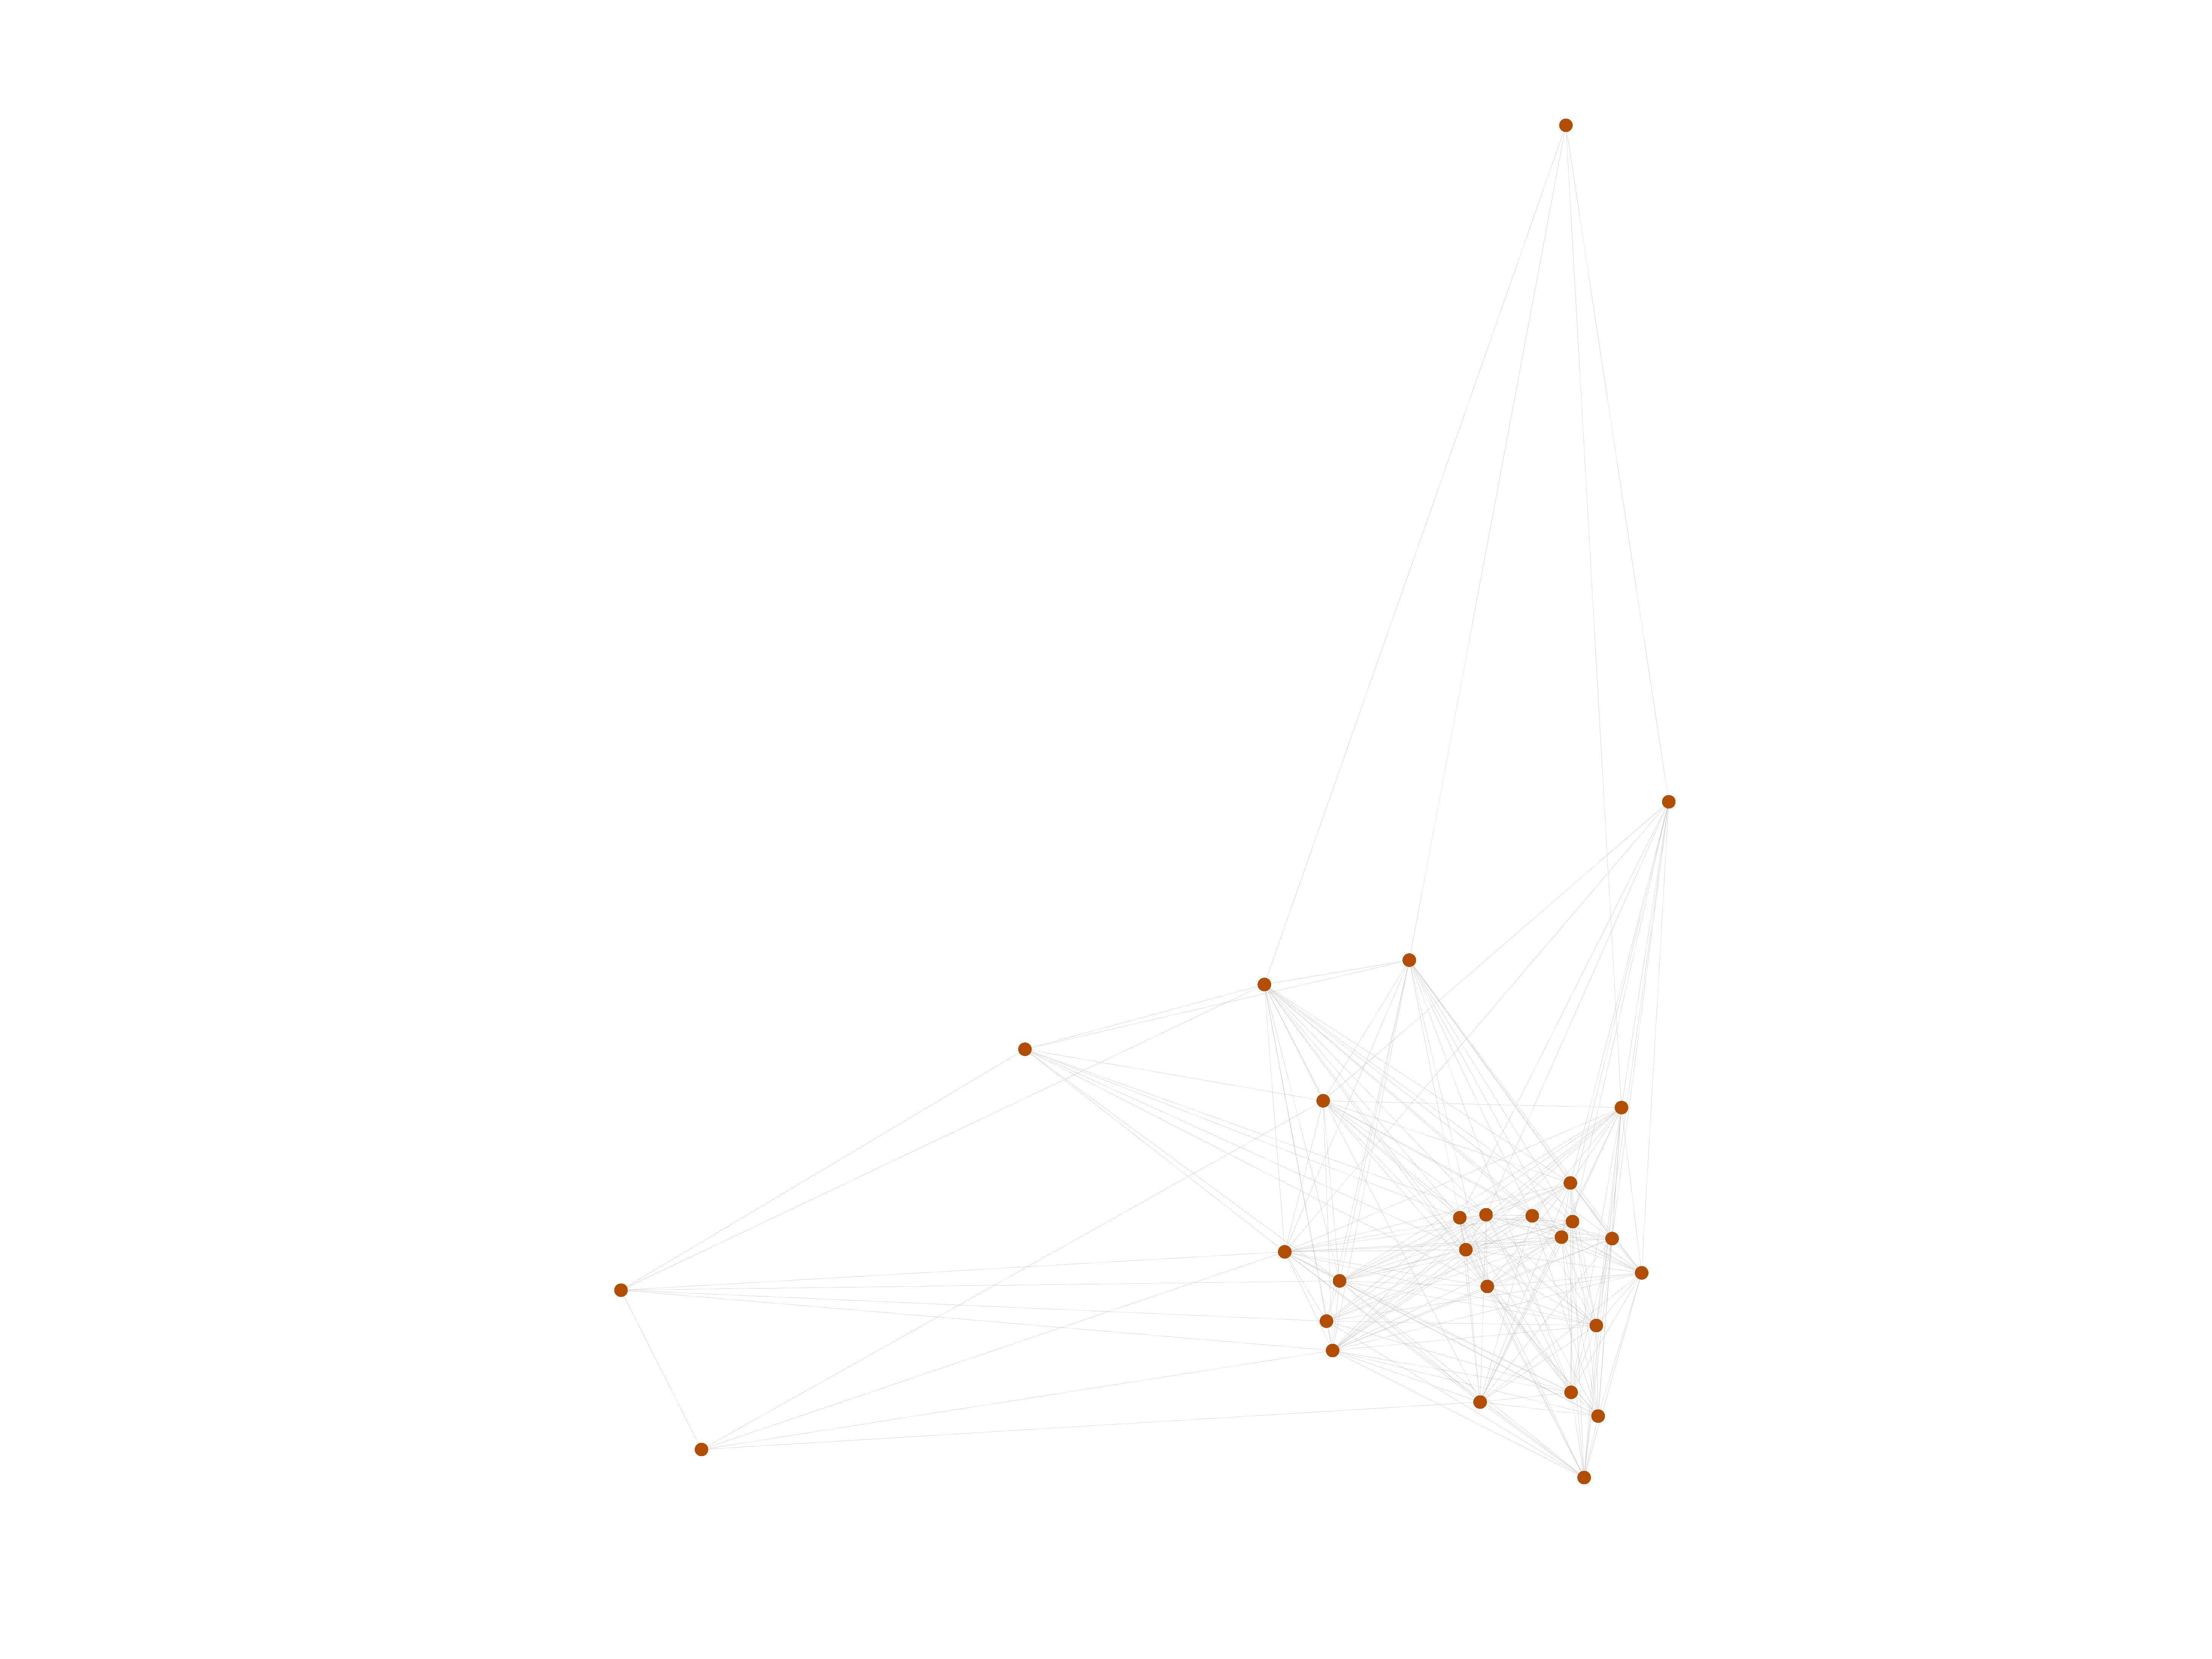
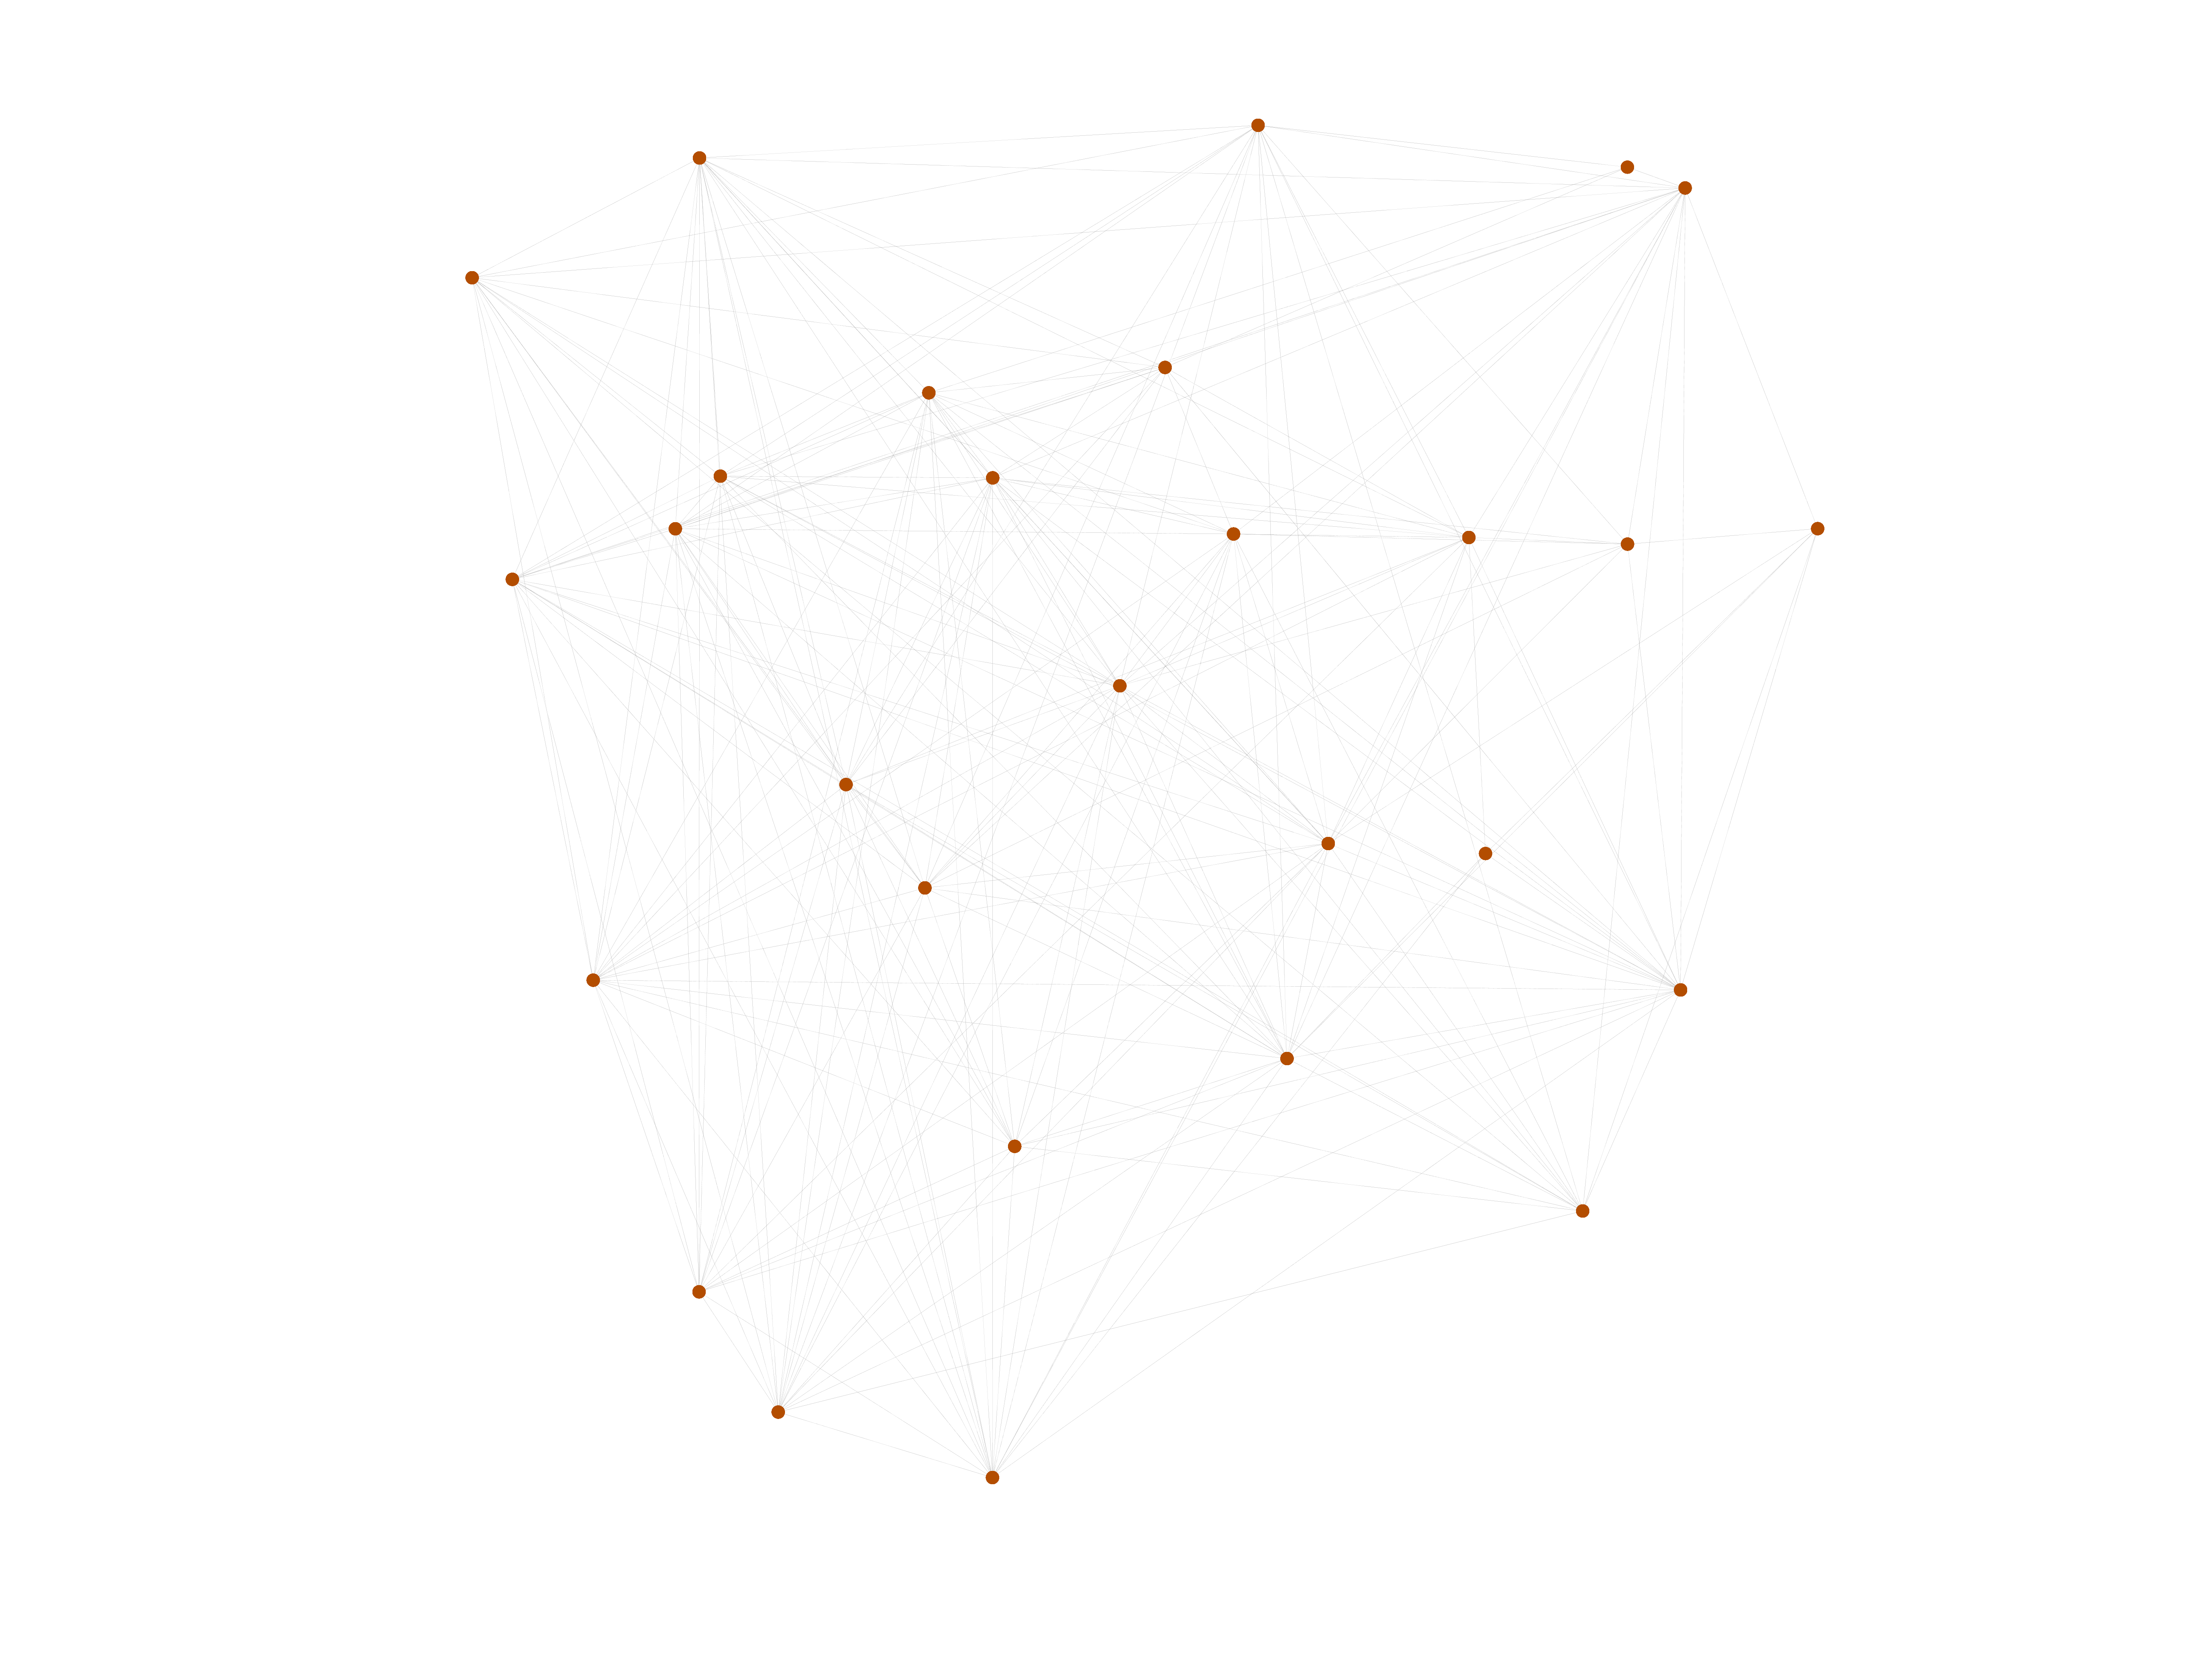
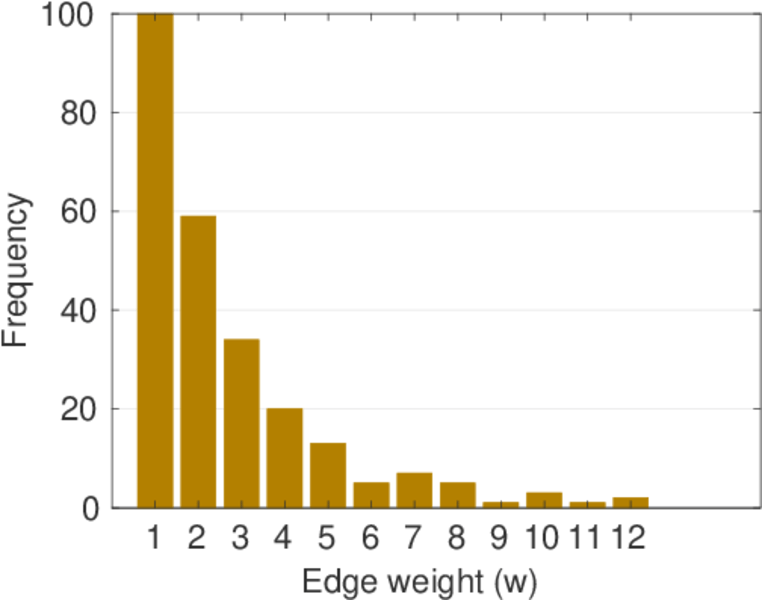
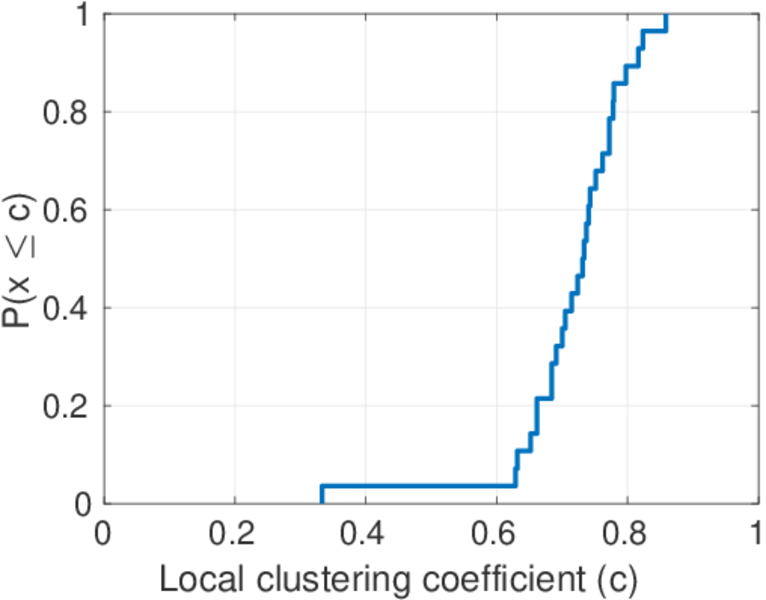
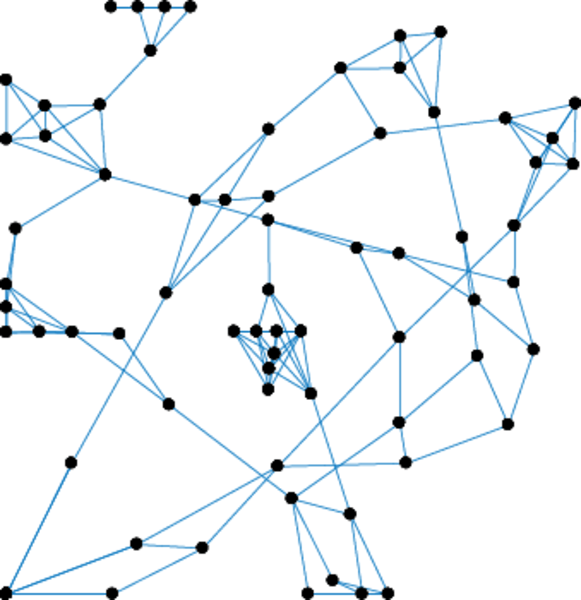
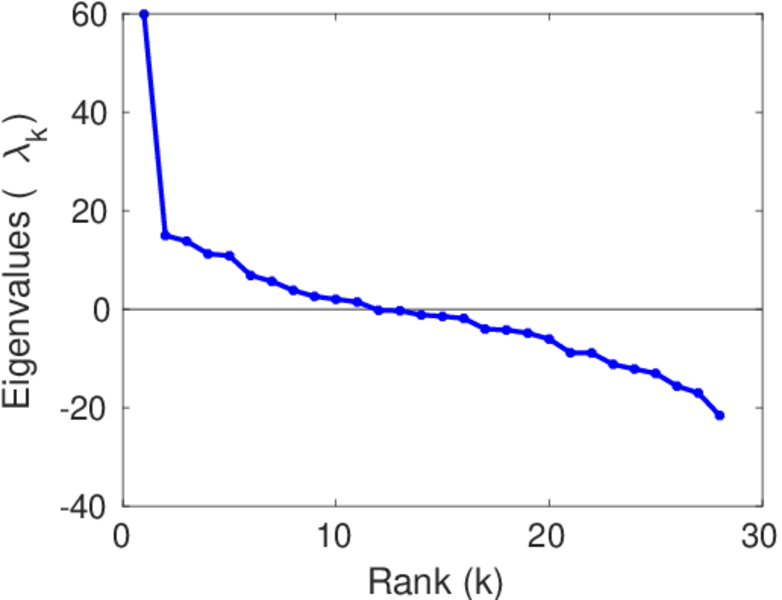
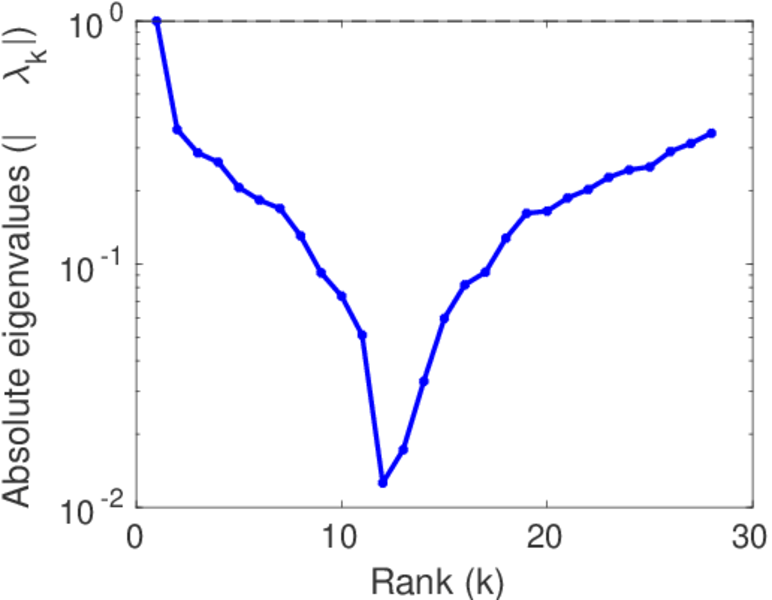
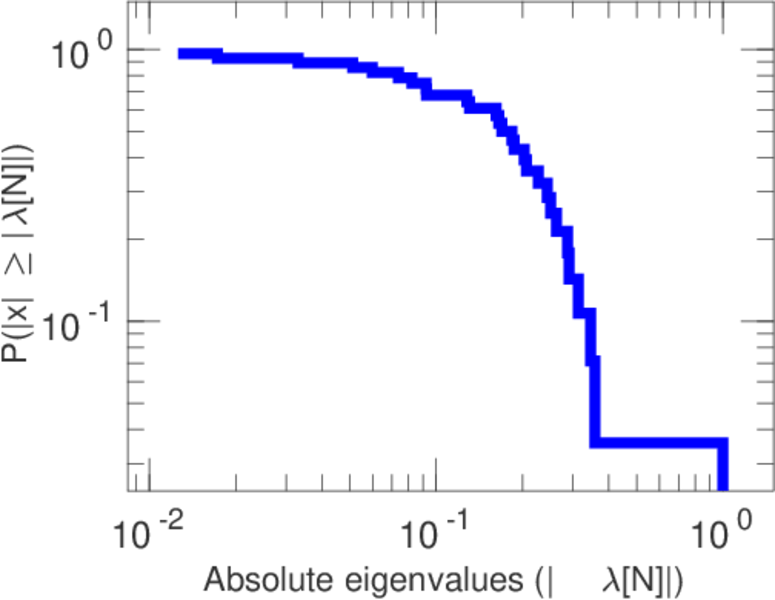
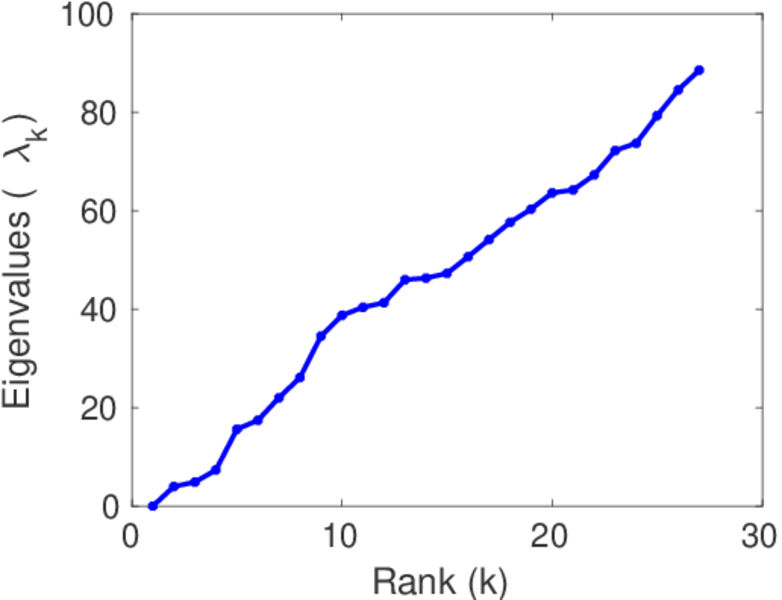
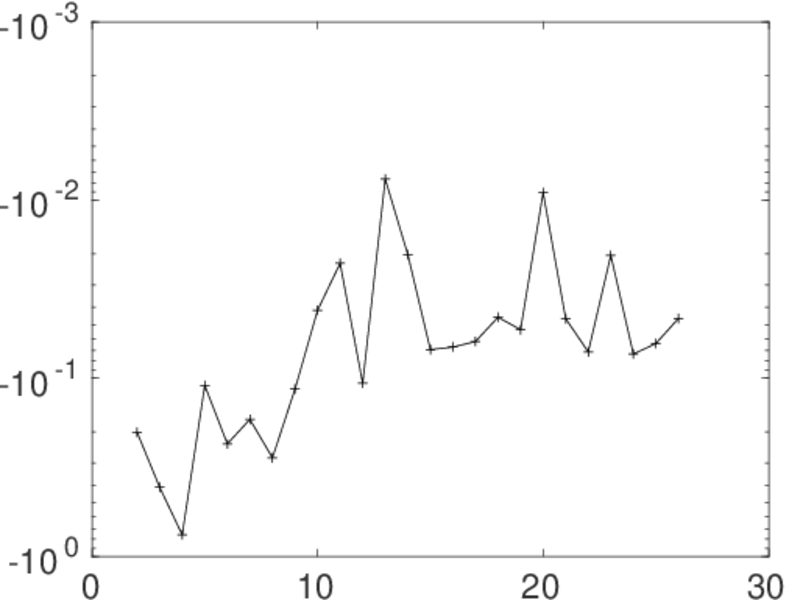
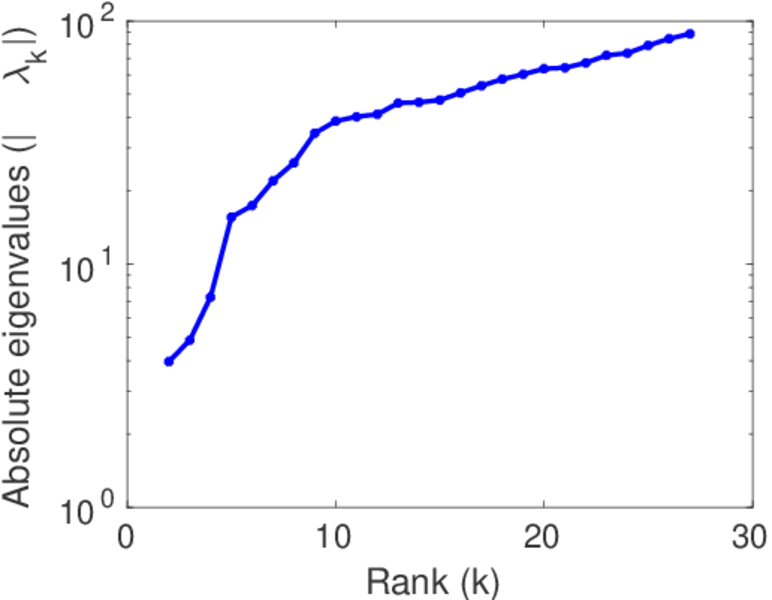
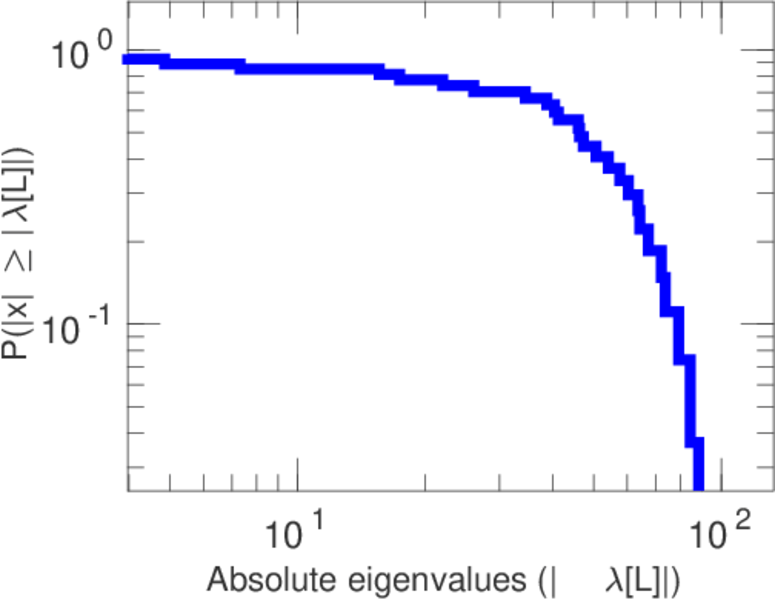
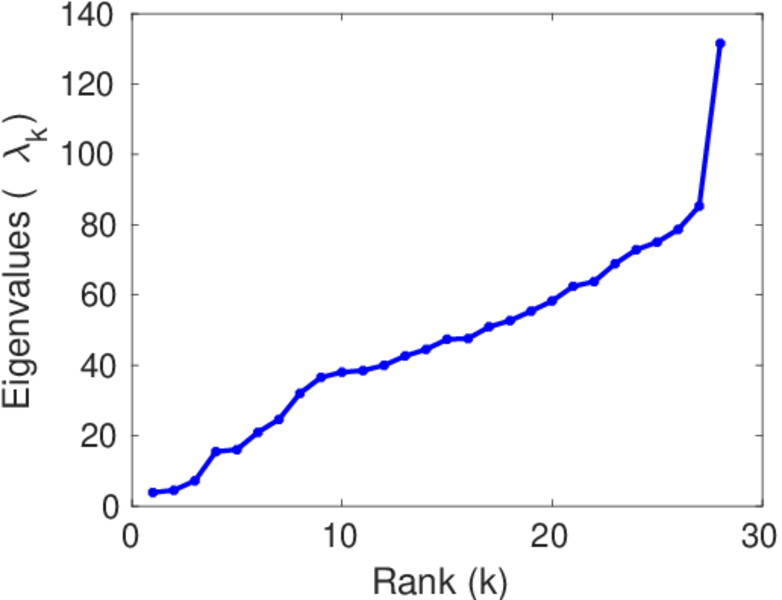
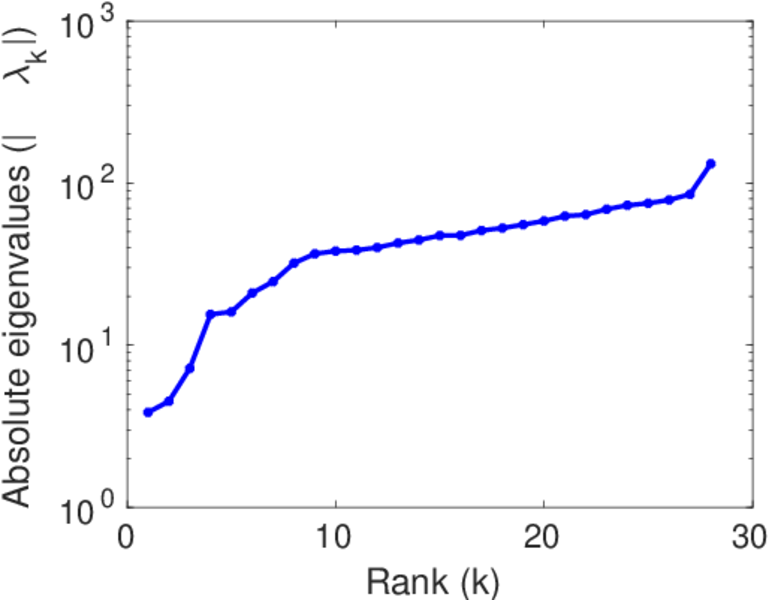
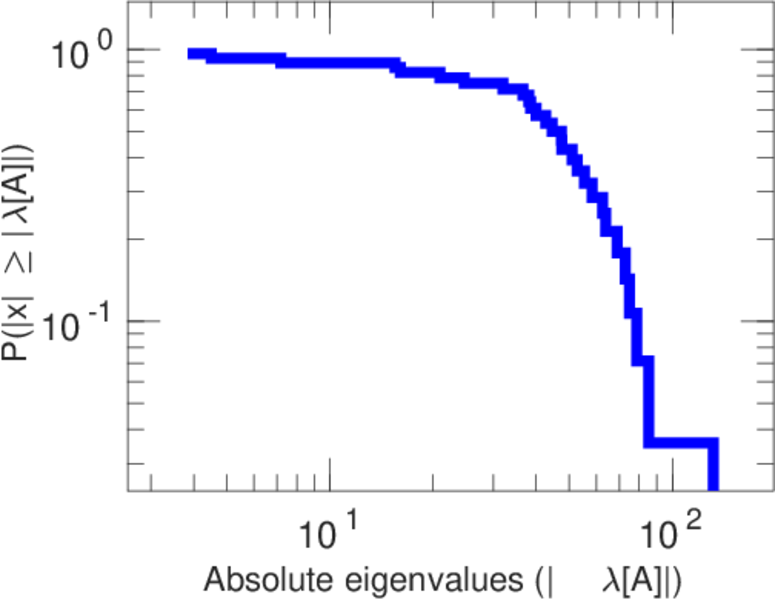
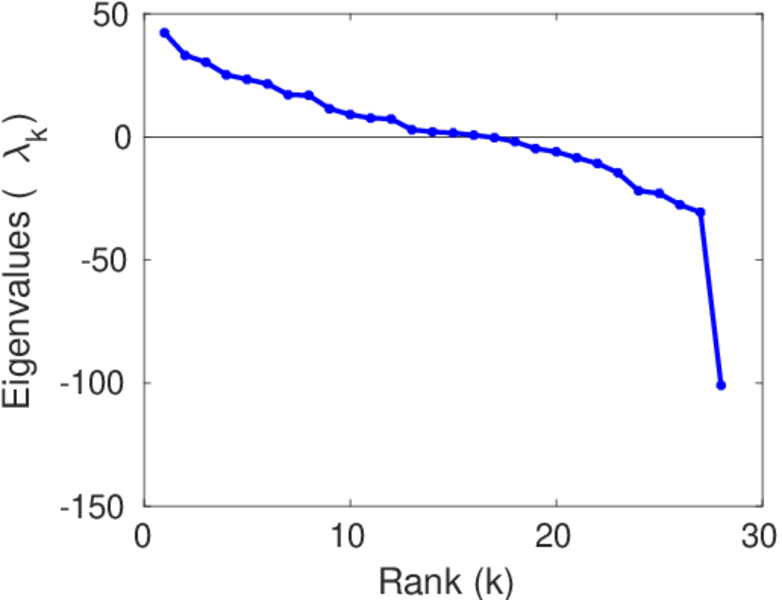
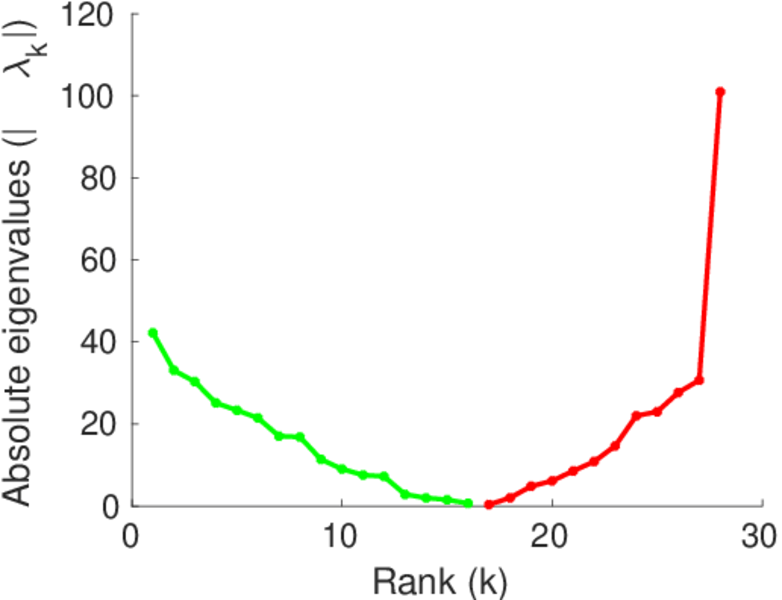
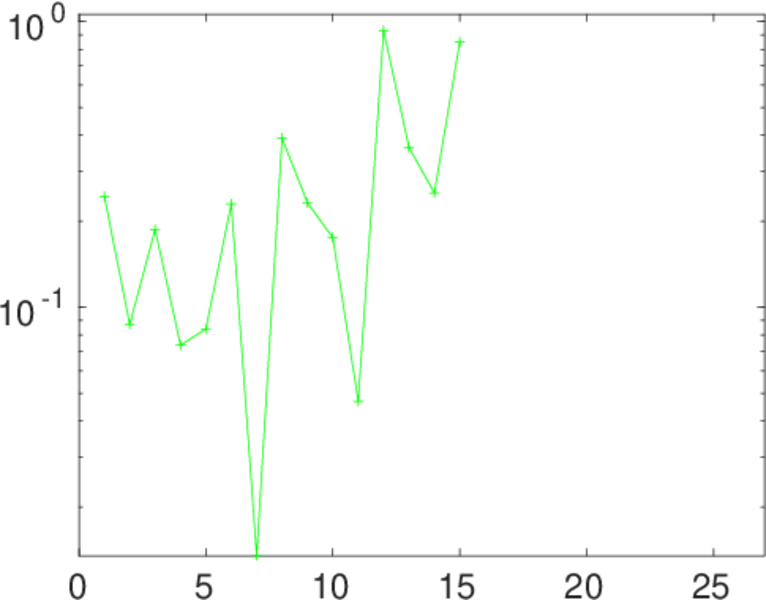
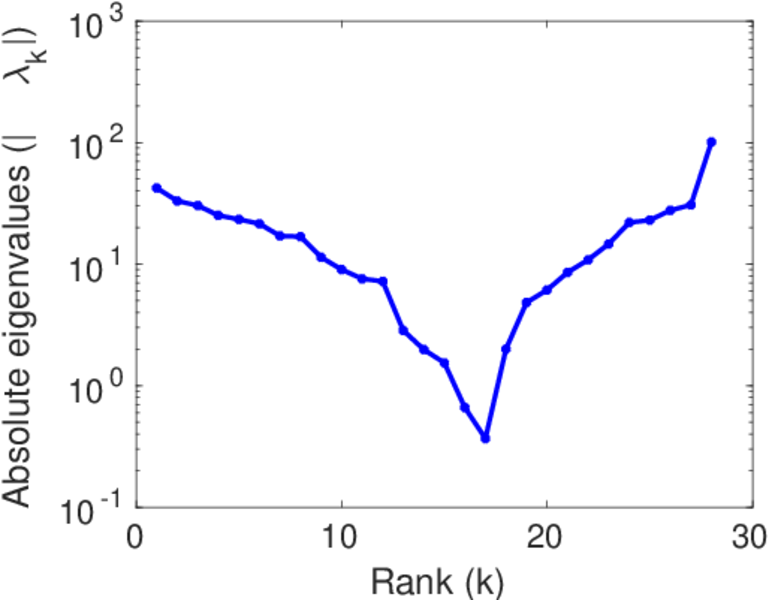
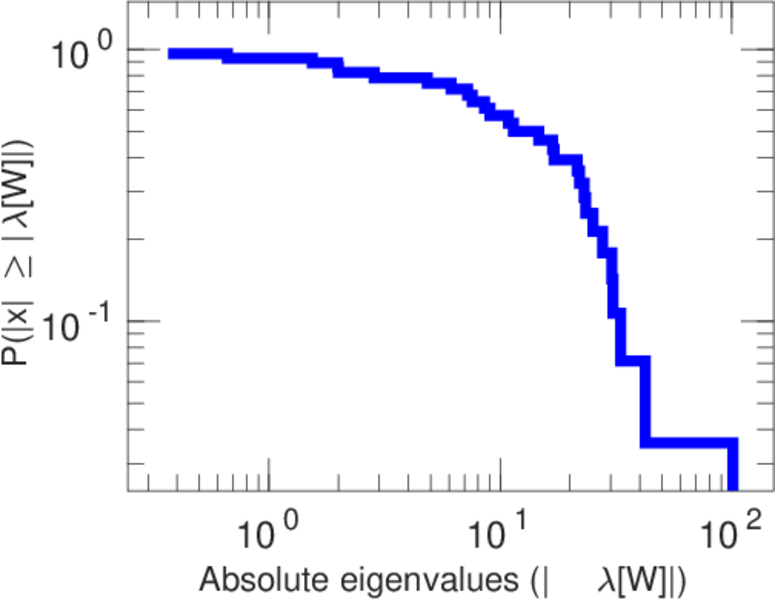
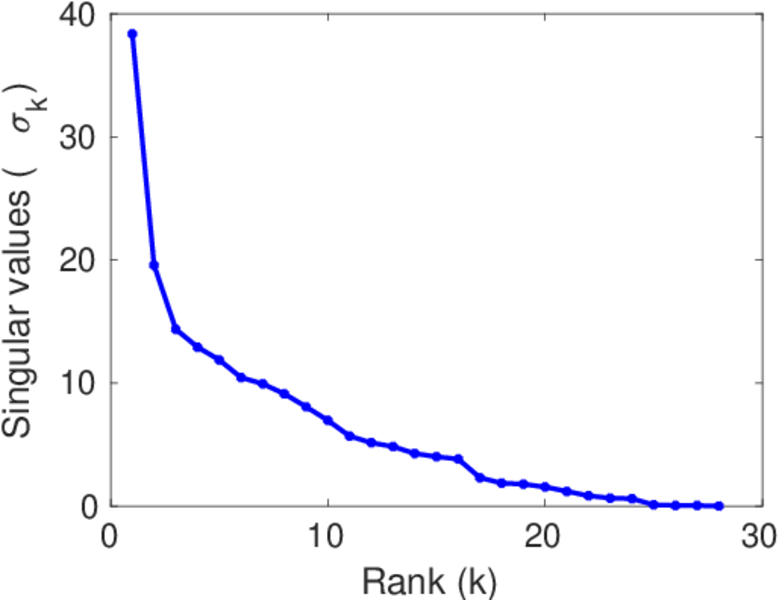
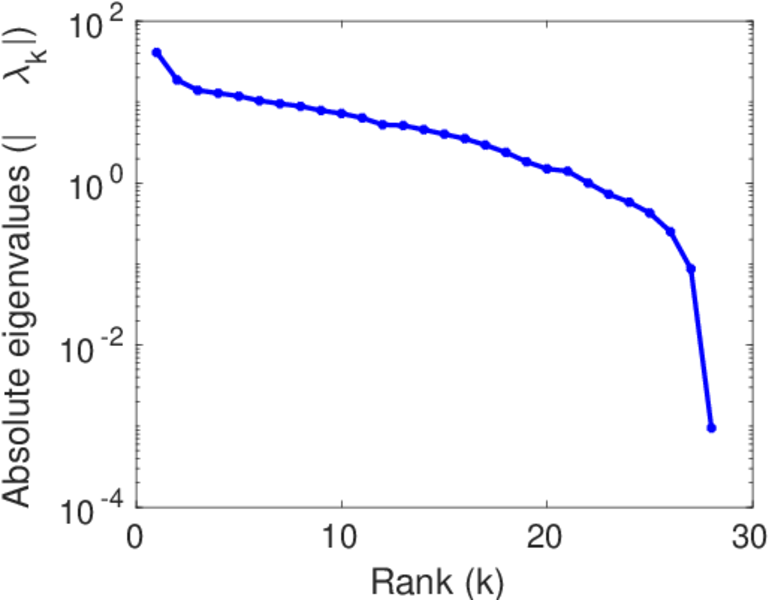
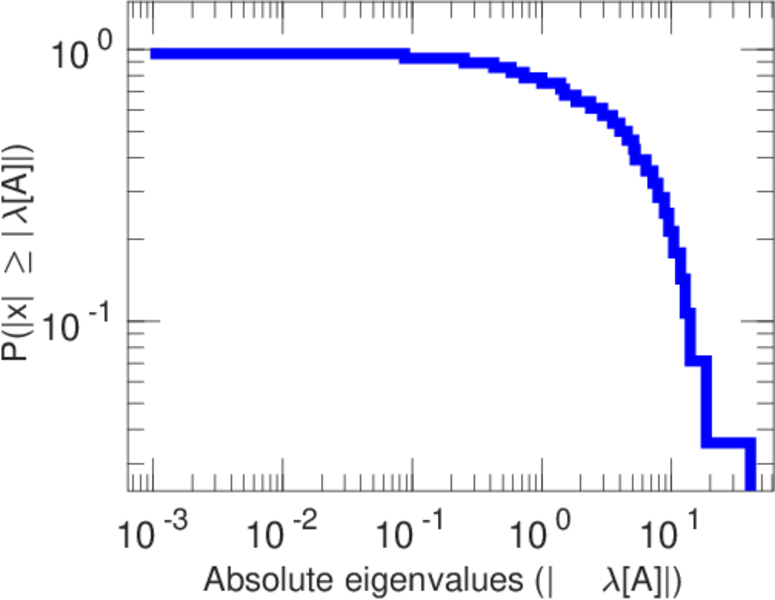
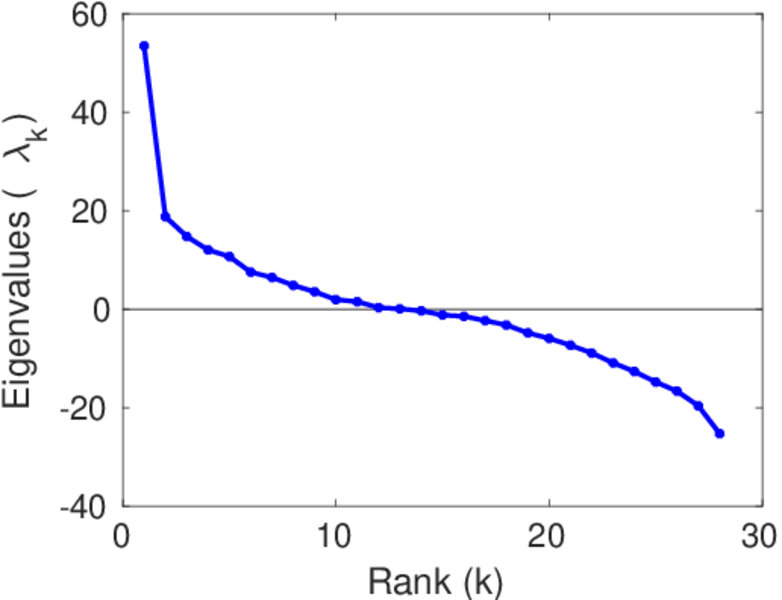
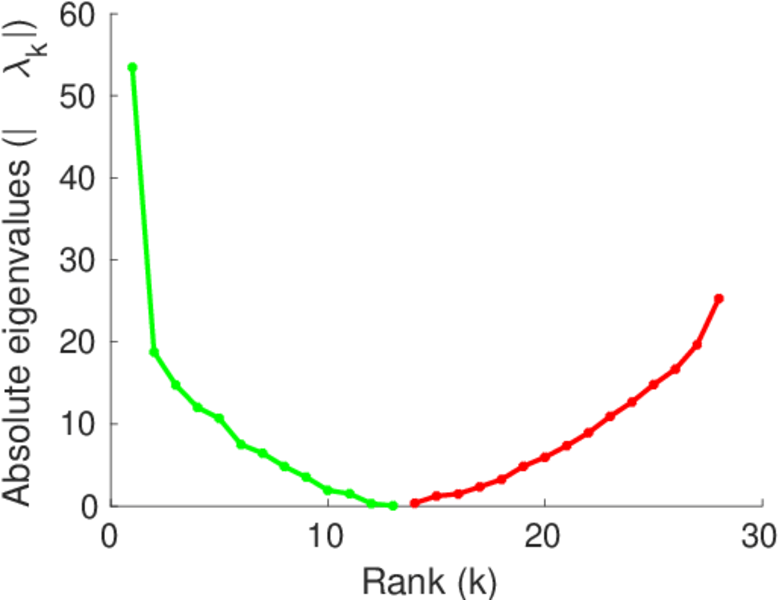
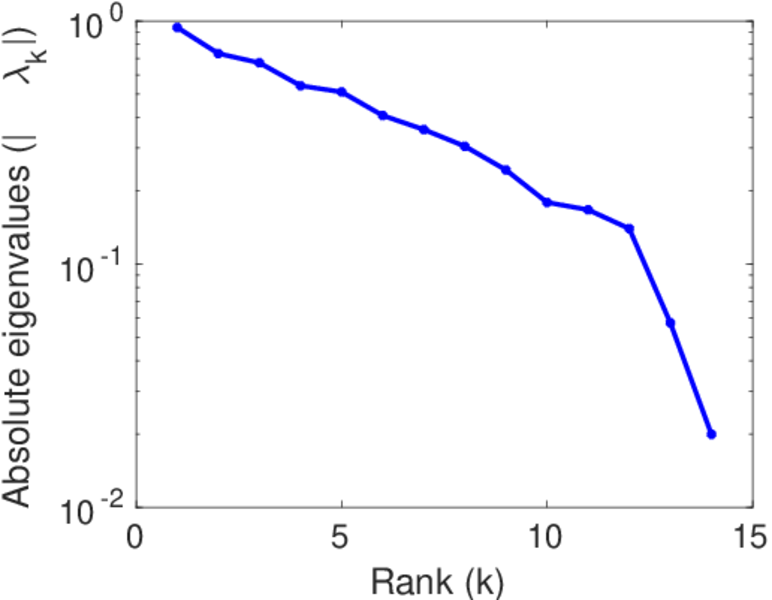
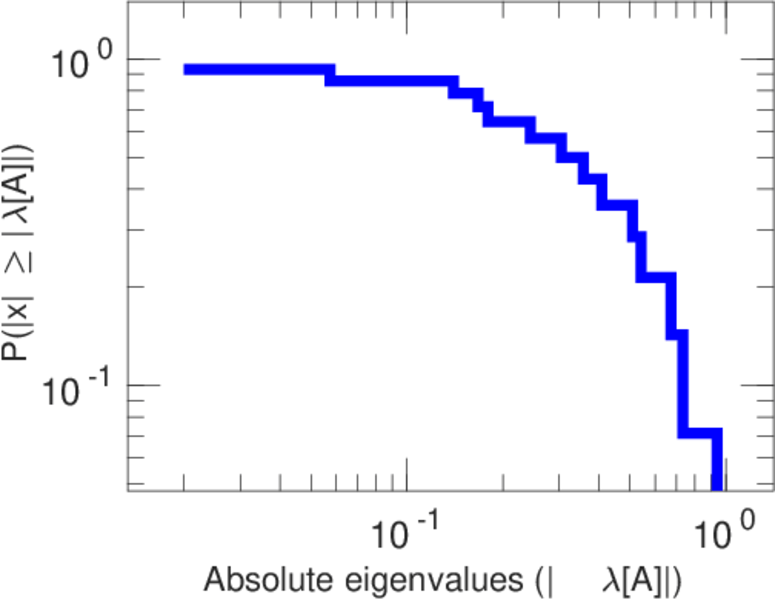
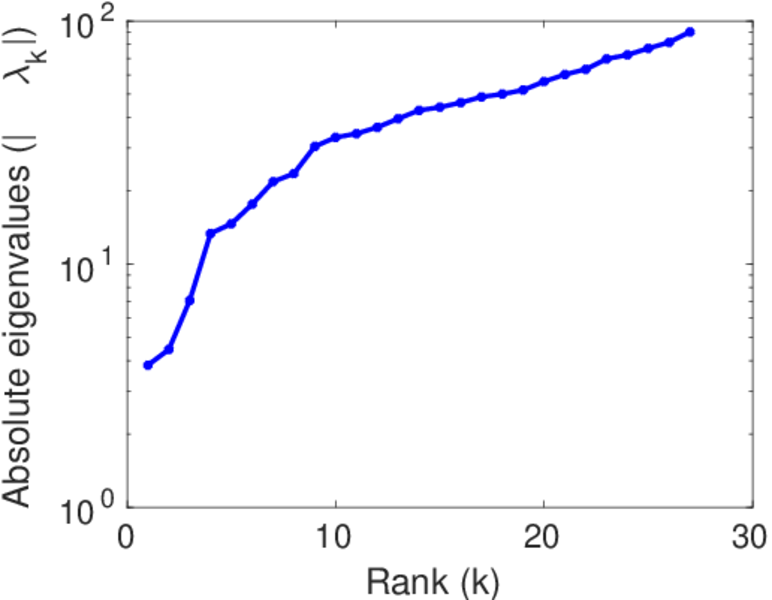
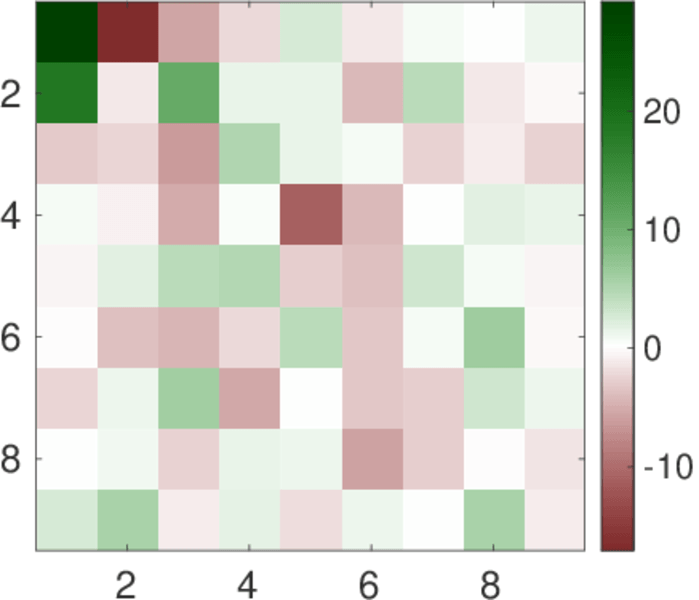
This directed network describes the dominance relationships between 28 female bighorn sheep (Ovis canadensis) observed on the National Bison Range in western Montana (USA) in 1984. A node represents a female bighorn sheep and an edge represents dominance of the left female bighorn sheep over the right female bighorn sheep. The edge weights indicate how often this dominance behavior was observed. Sheeps that are listed as nine years old may have been older in reality.
| Code | Mc
| |
| Internal name | moreno_sheep
| |
| Name | Sheep | |
| Data source | http://moreno.ss.uci.edu/data.html#sheep | |
| Availability | Dataset is available for download | |
| Consistency check | Dataset passed all tests | |
| Category | Animal network | |
| Dataset timestamp | 1984 | |
| Node meaning | Sheep | |
| Edge meaning | Dominance | |
| Network format | Unipartite, directed | |
| Edge type | Positive weights, no multiple edges | |
| Reciprocal | Contains reciprocal edges | |
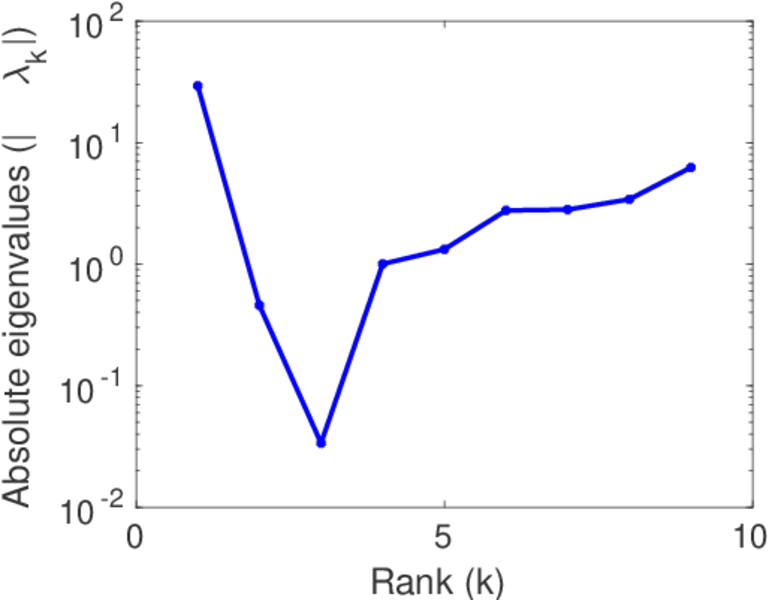
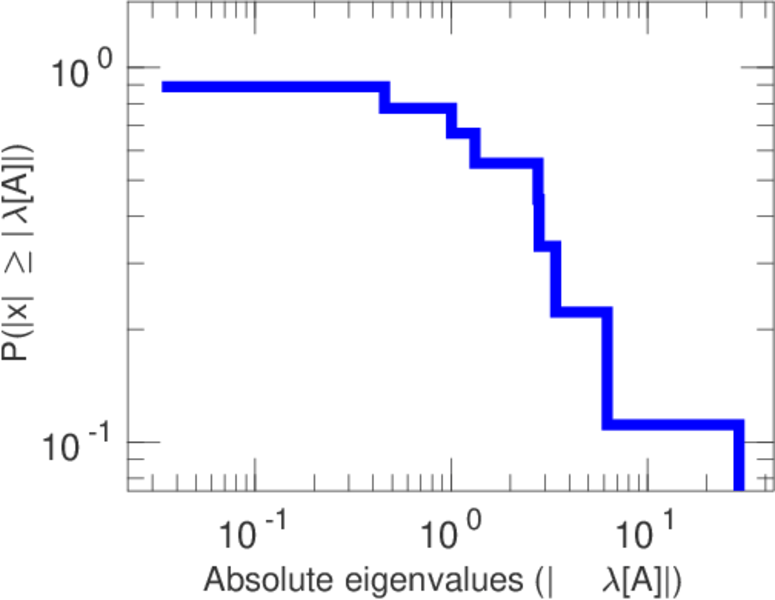
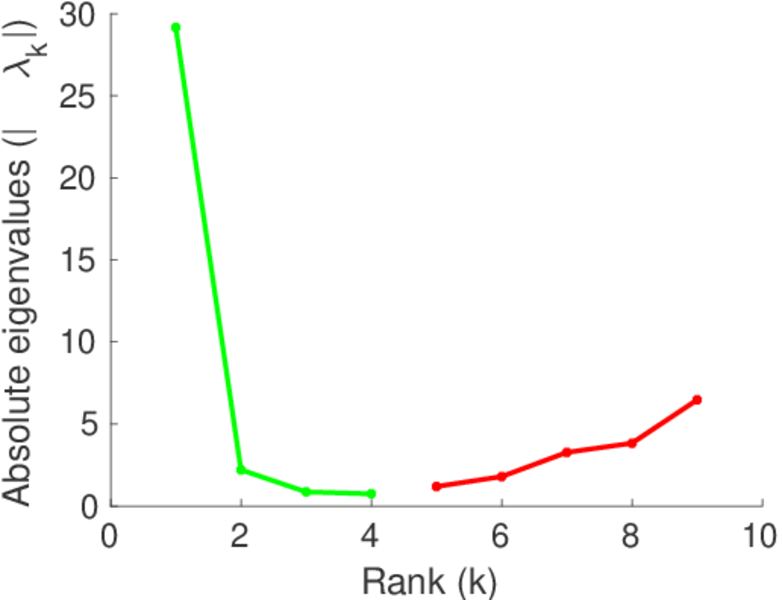
| Directed cycles | Contains directed cycles | |
| Loops | Does not contain loops | |
| Skew-symmetry | Inverted edges can be interpreted as negated edges |


| [1] | Jérôme Kunegis. KONECT – The Koblenz Network Collection. In Proc. Int. Conf. on World Wide Web Companion, pages 1343–1350, 2013. [ http ] |
| [2] | Christine C. Hass. Social status in female bighorn sheep (Ovis canadensis): Expression, development and reproductive correlates. J. Zool., 225(3):509–523, 1991. |