Train bombing

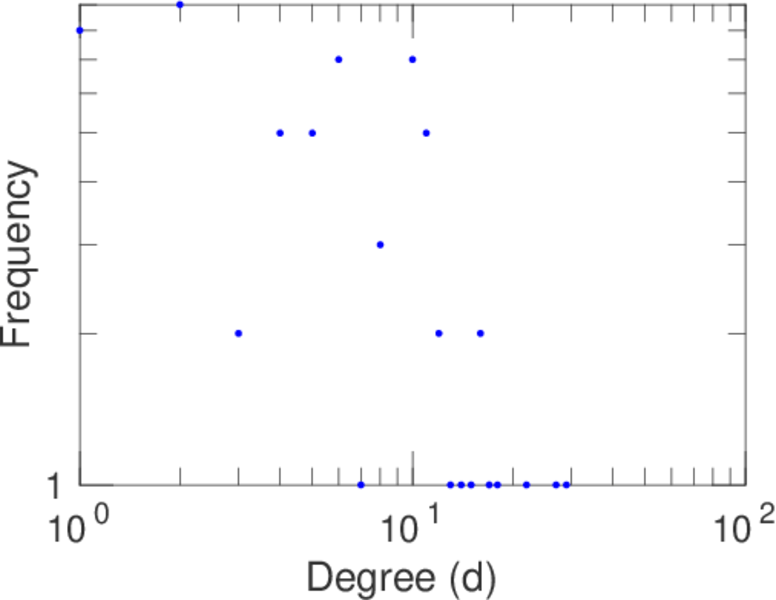
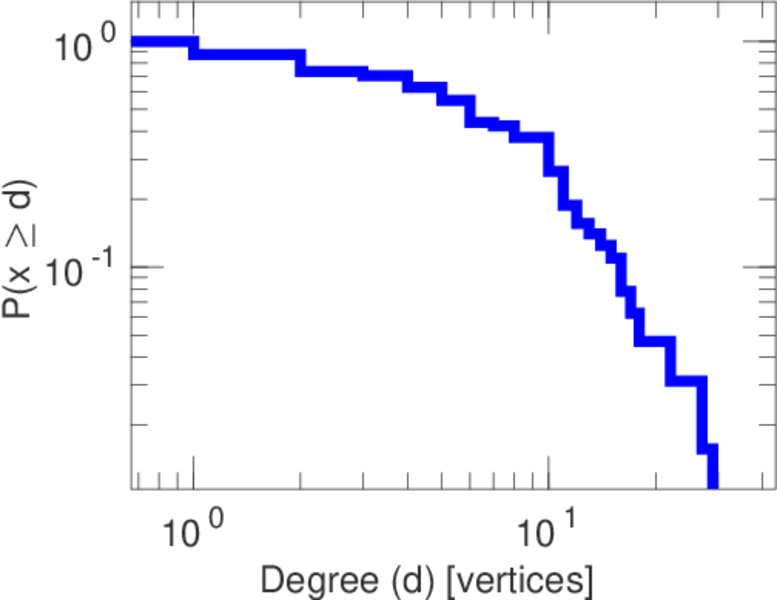
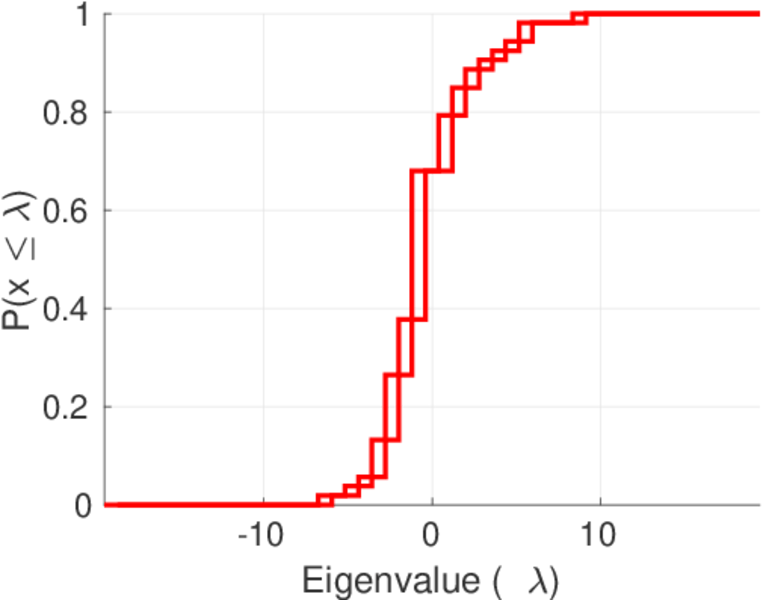
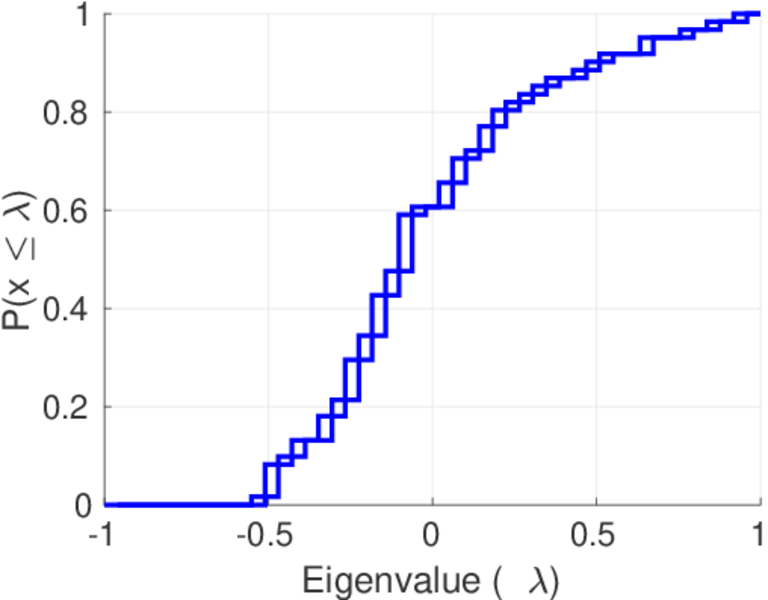
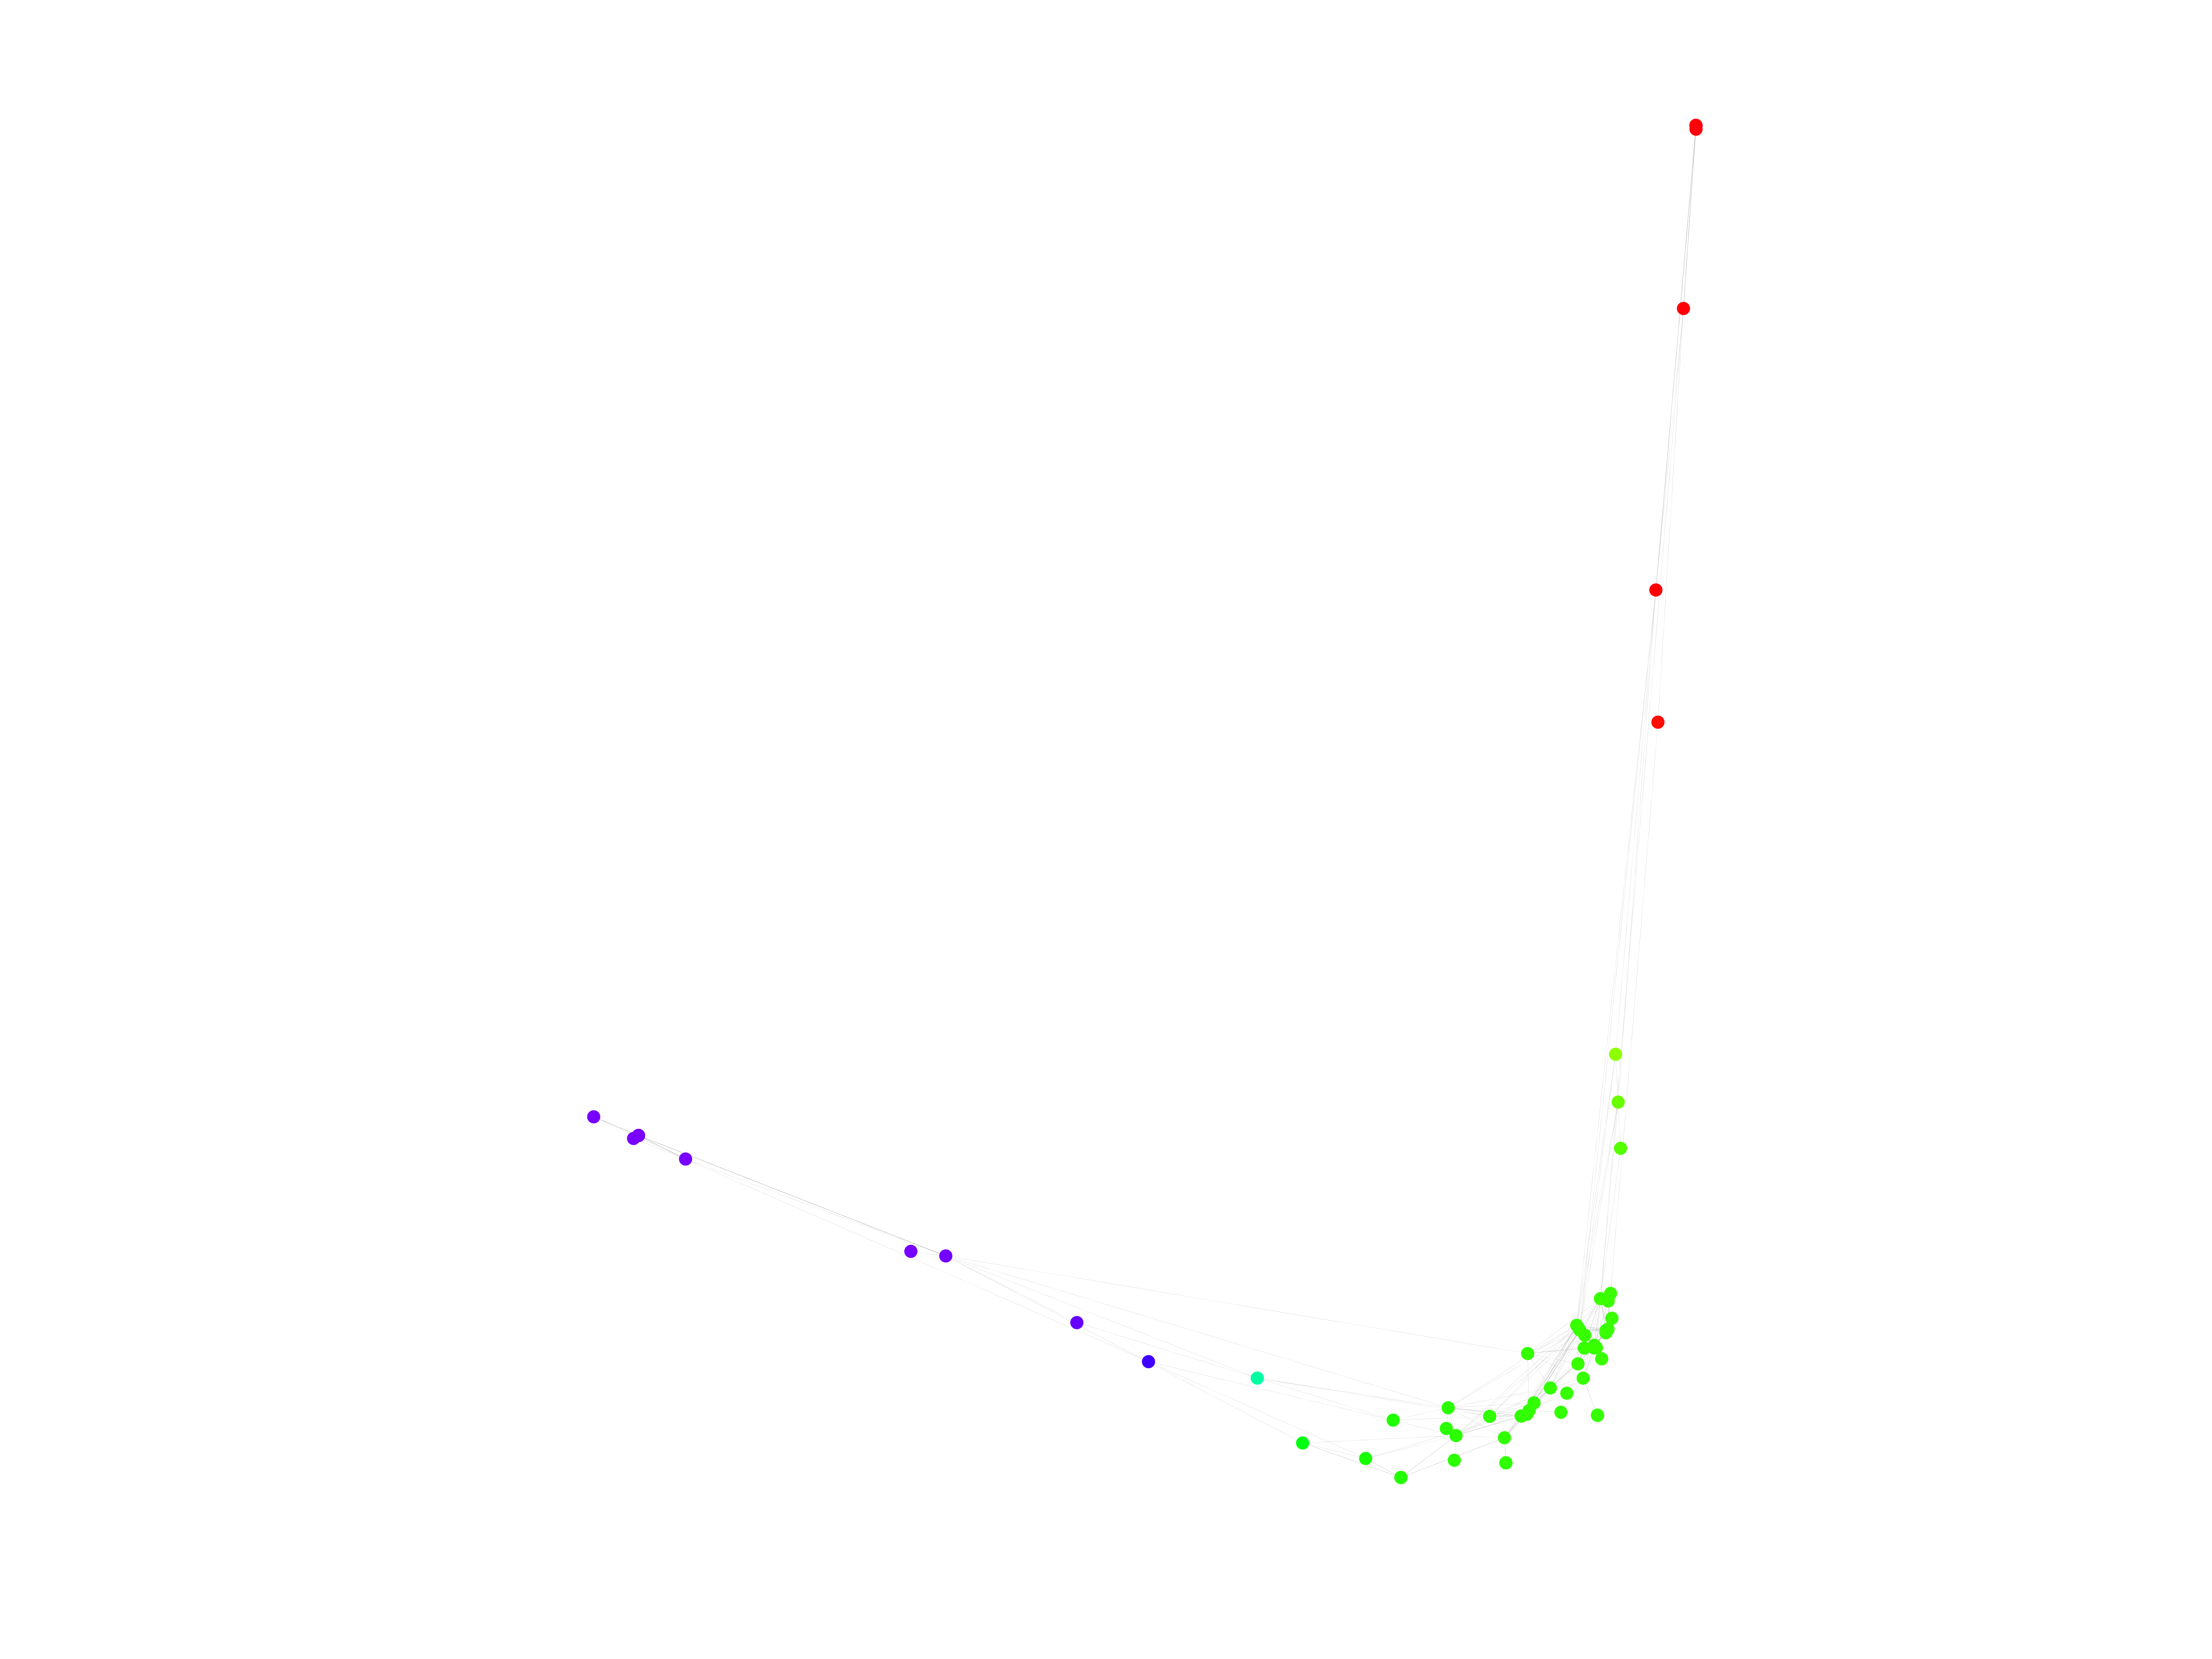
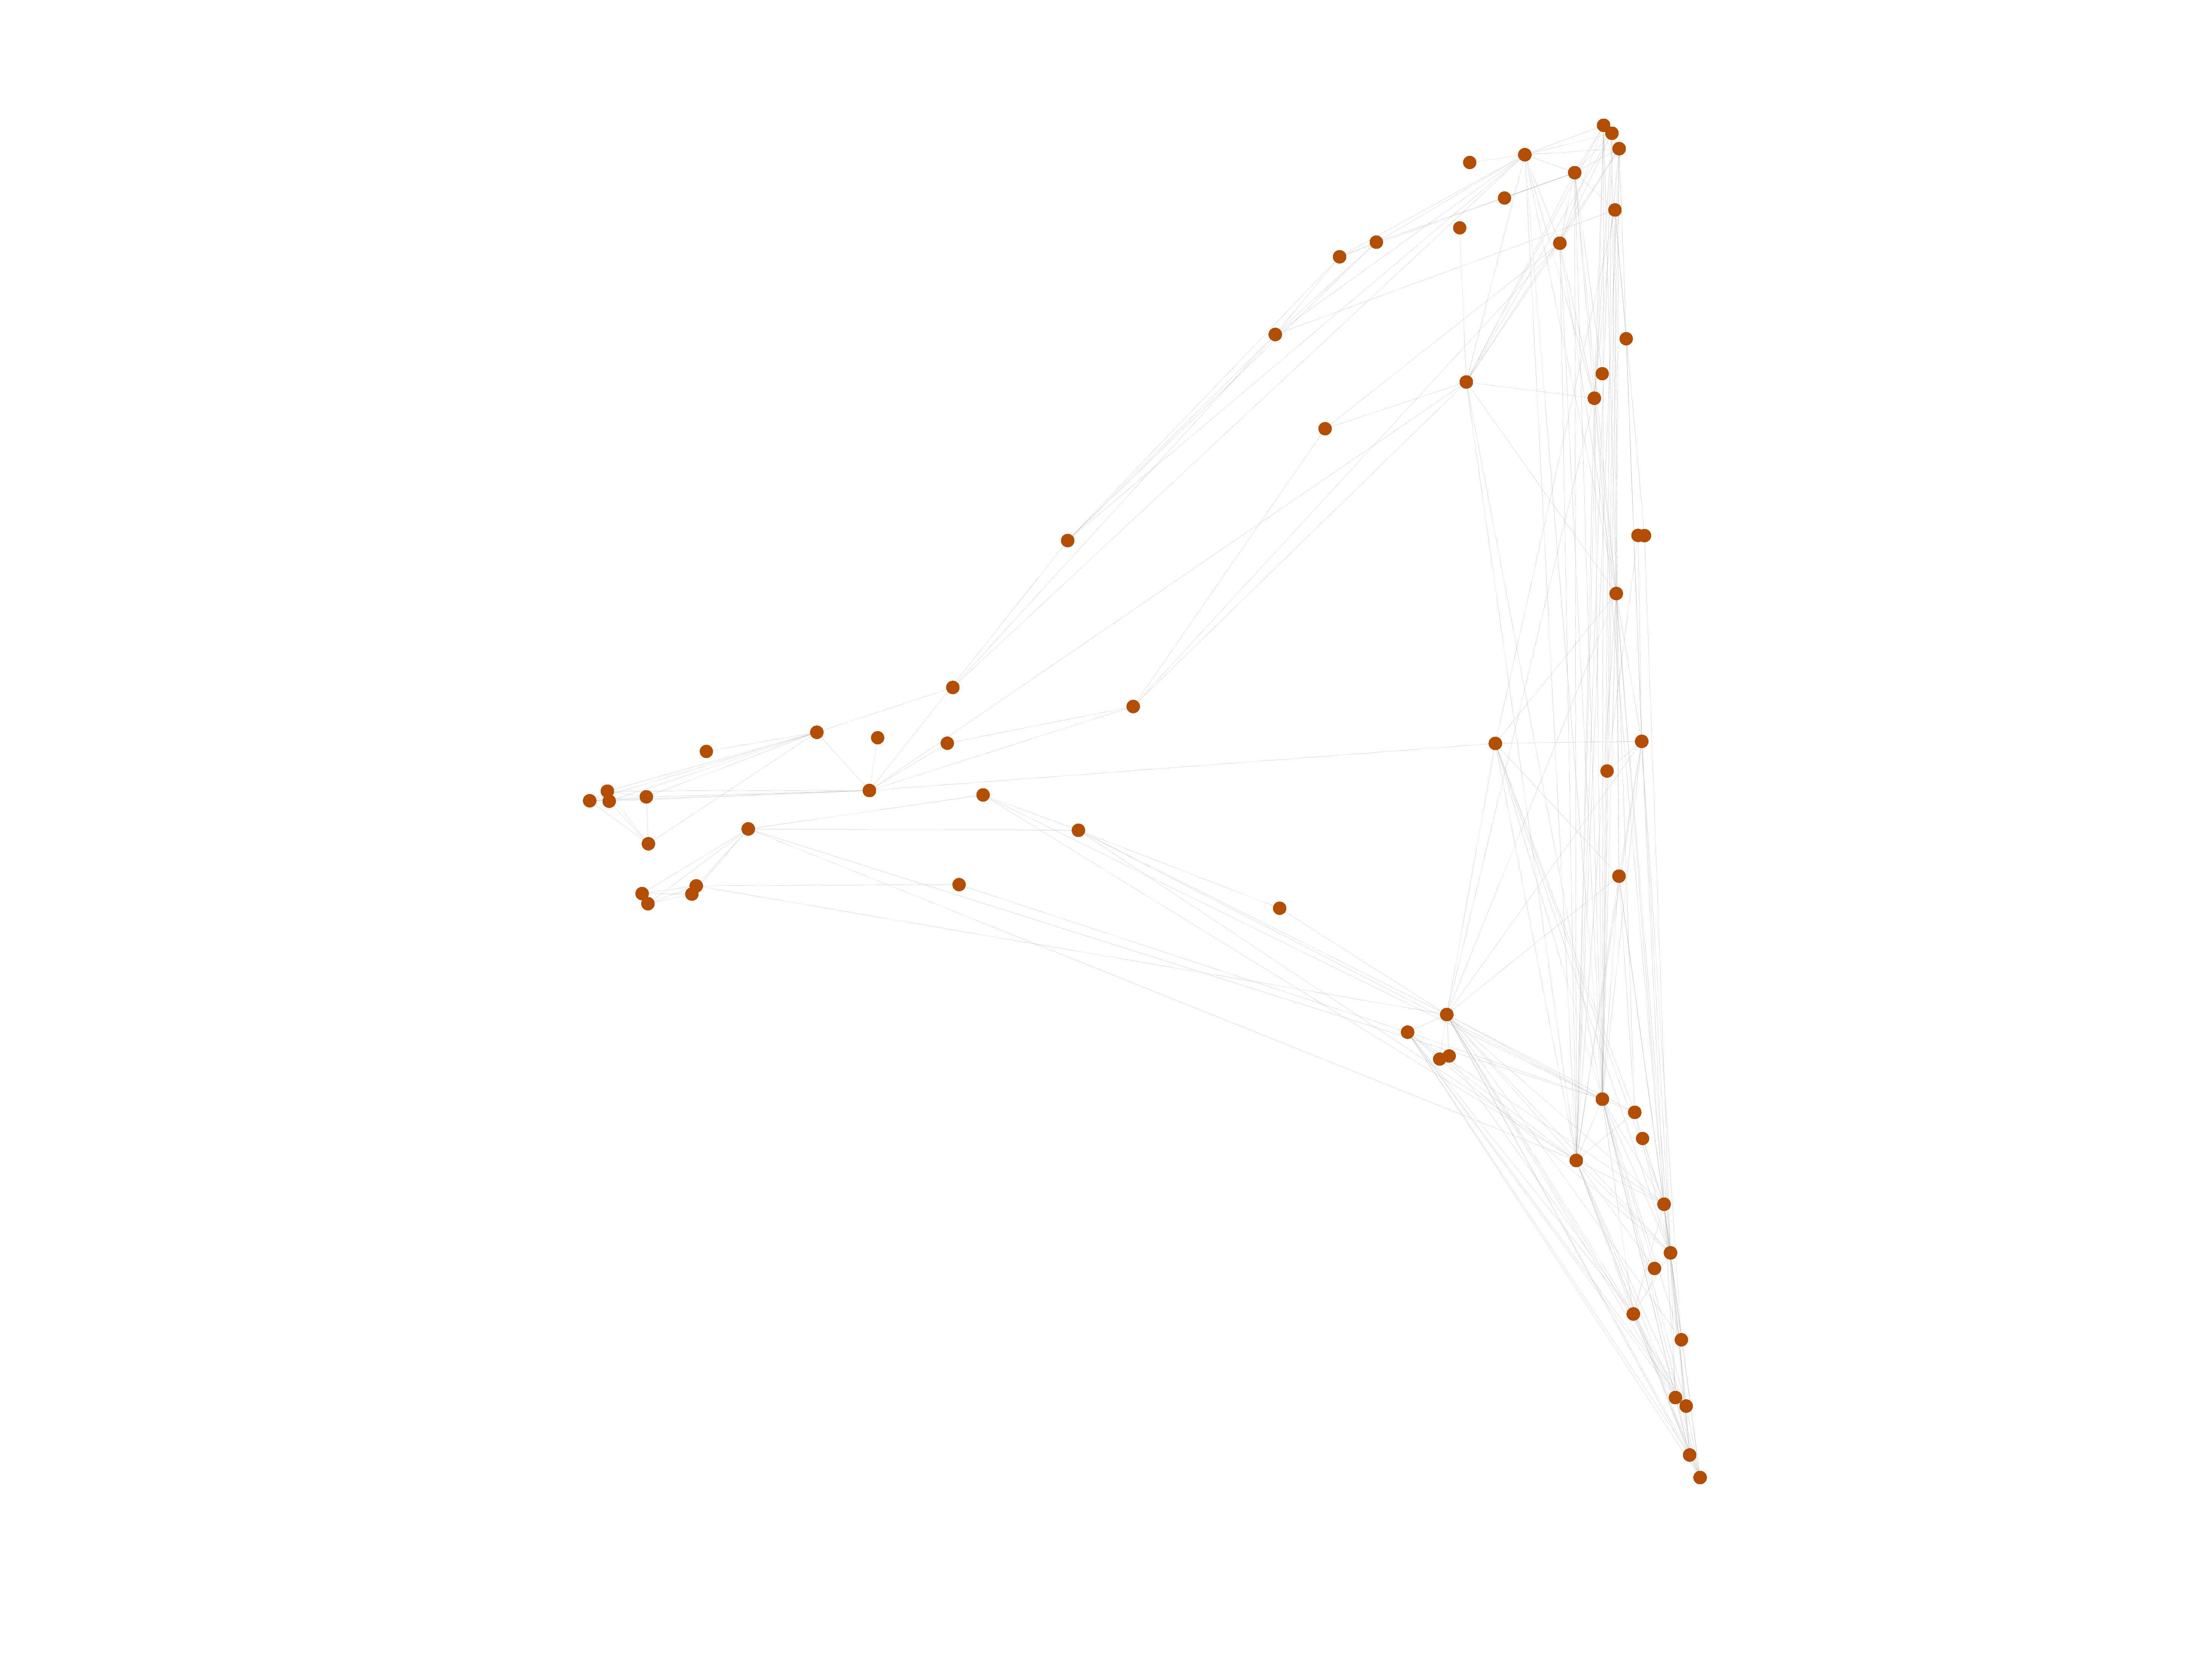
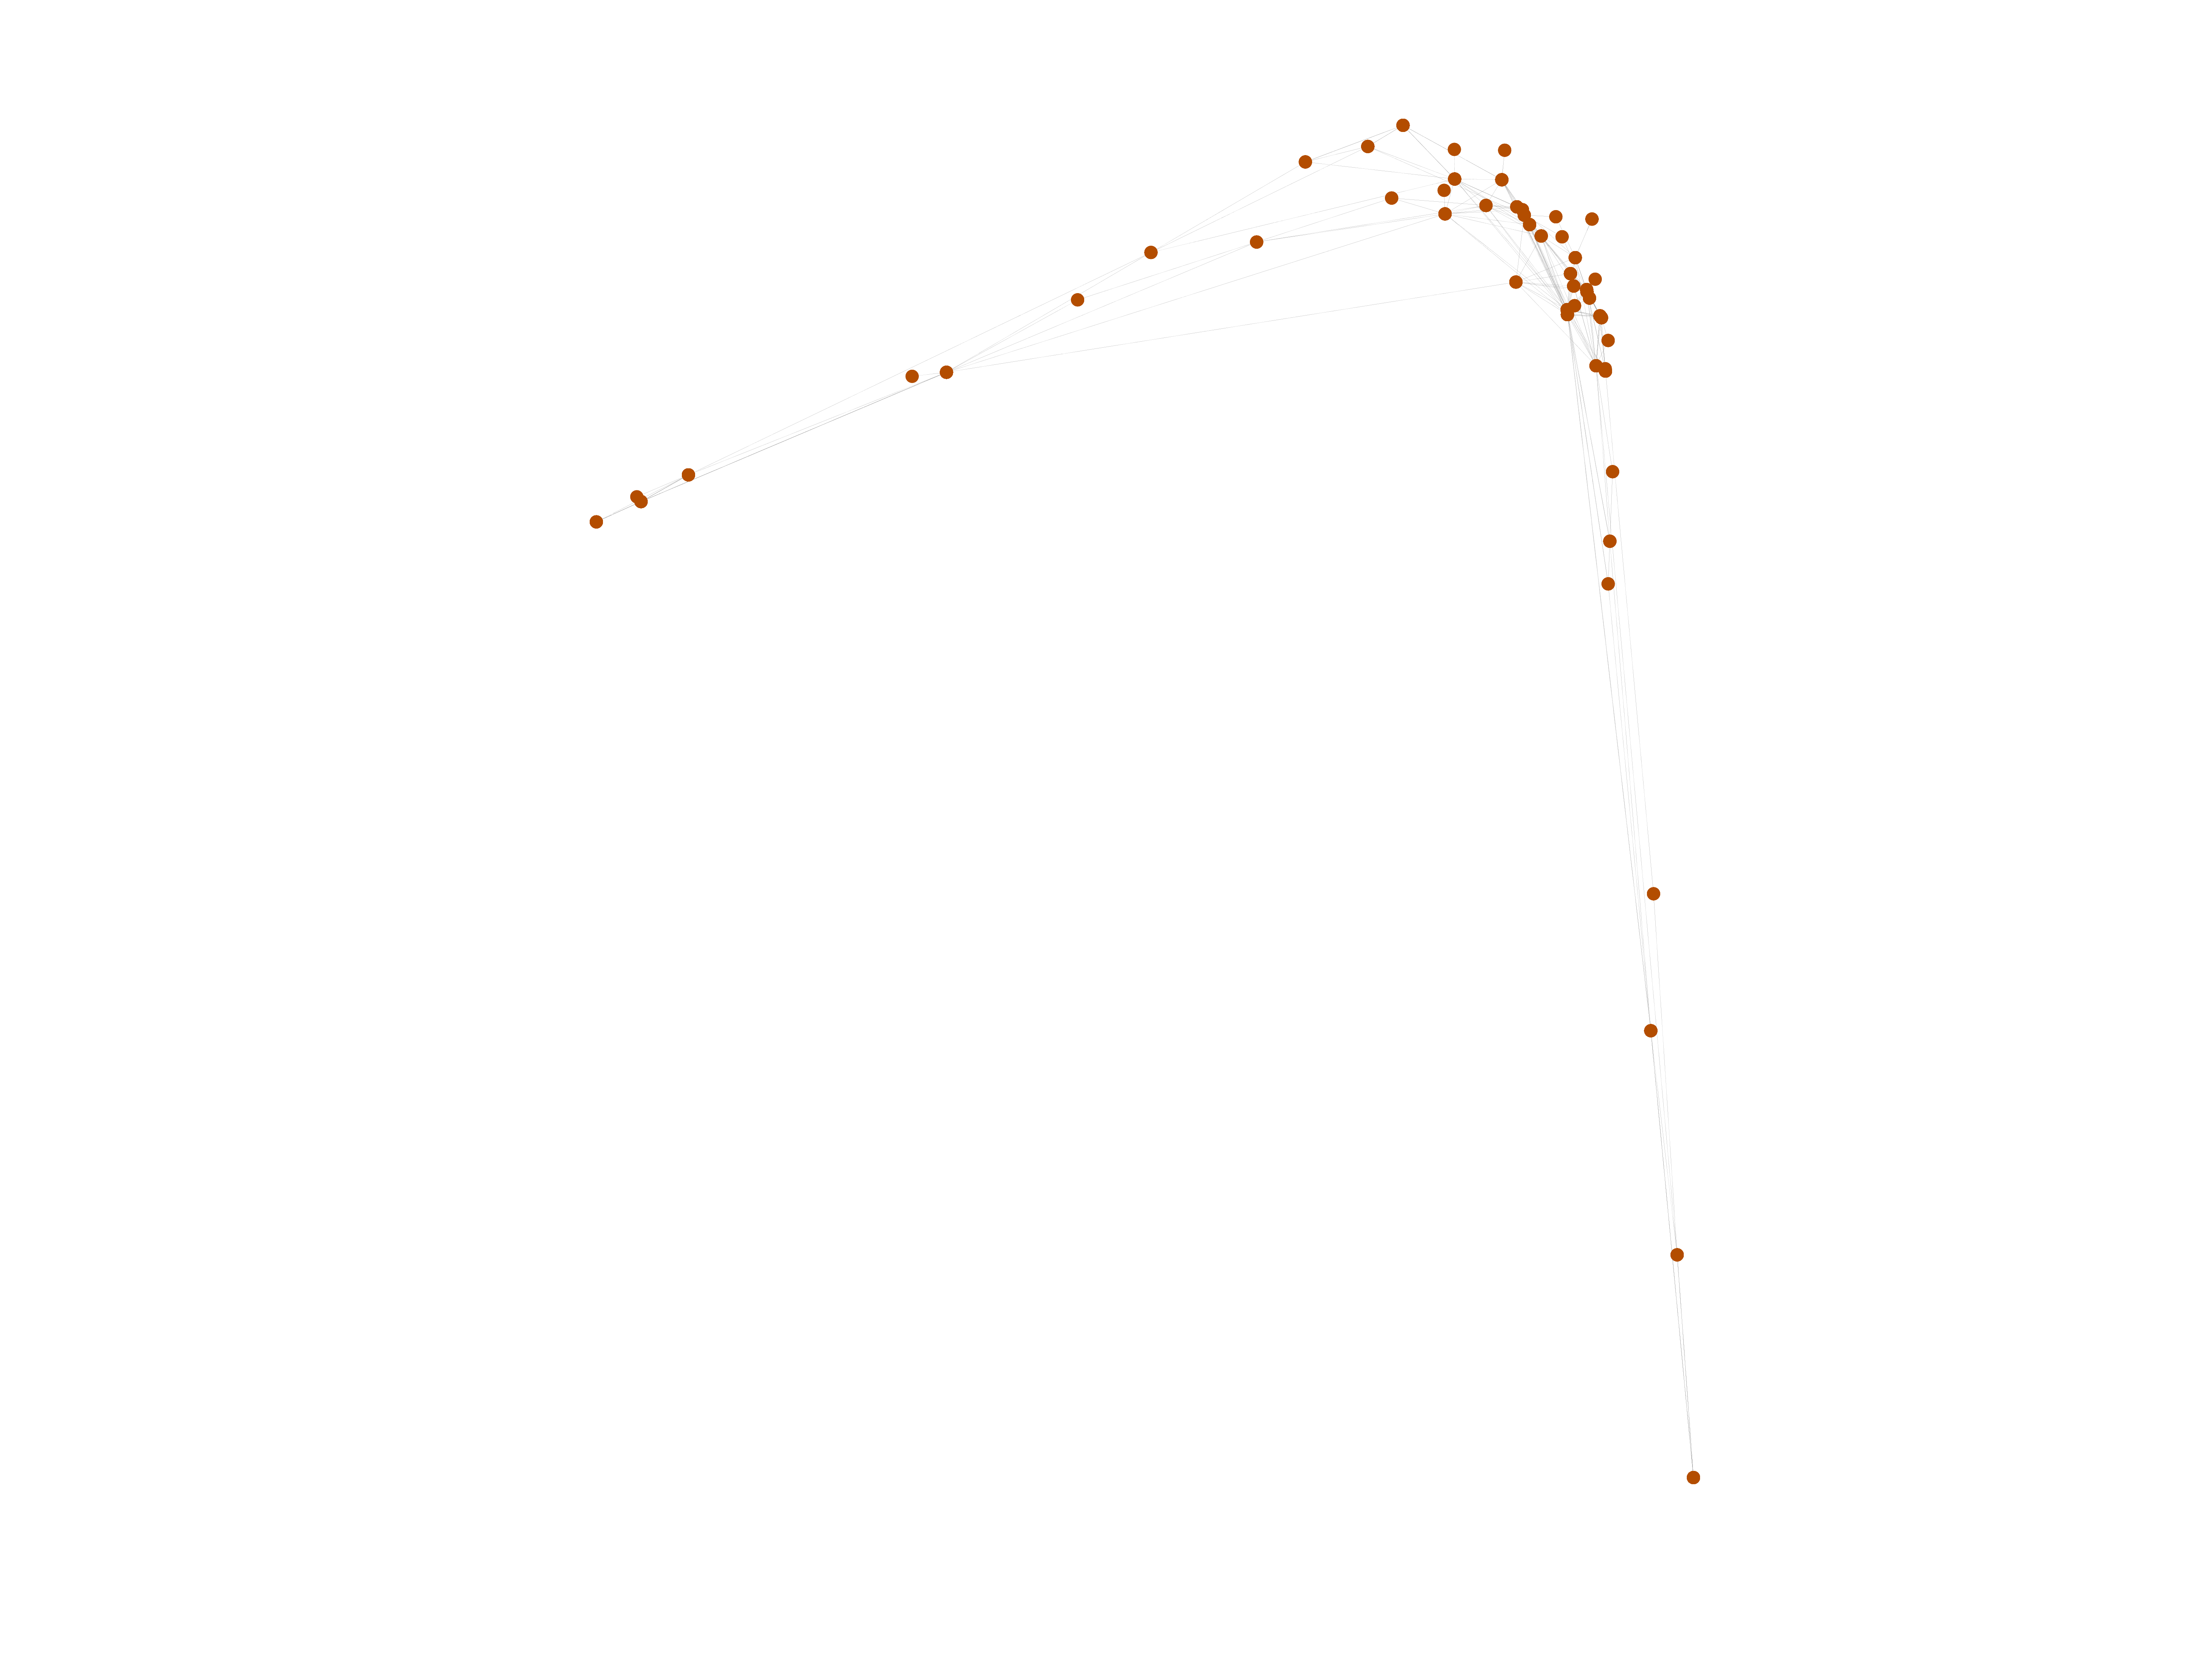
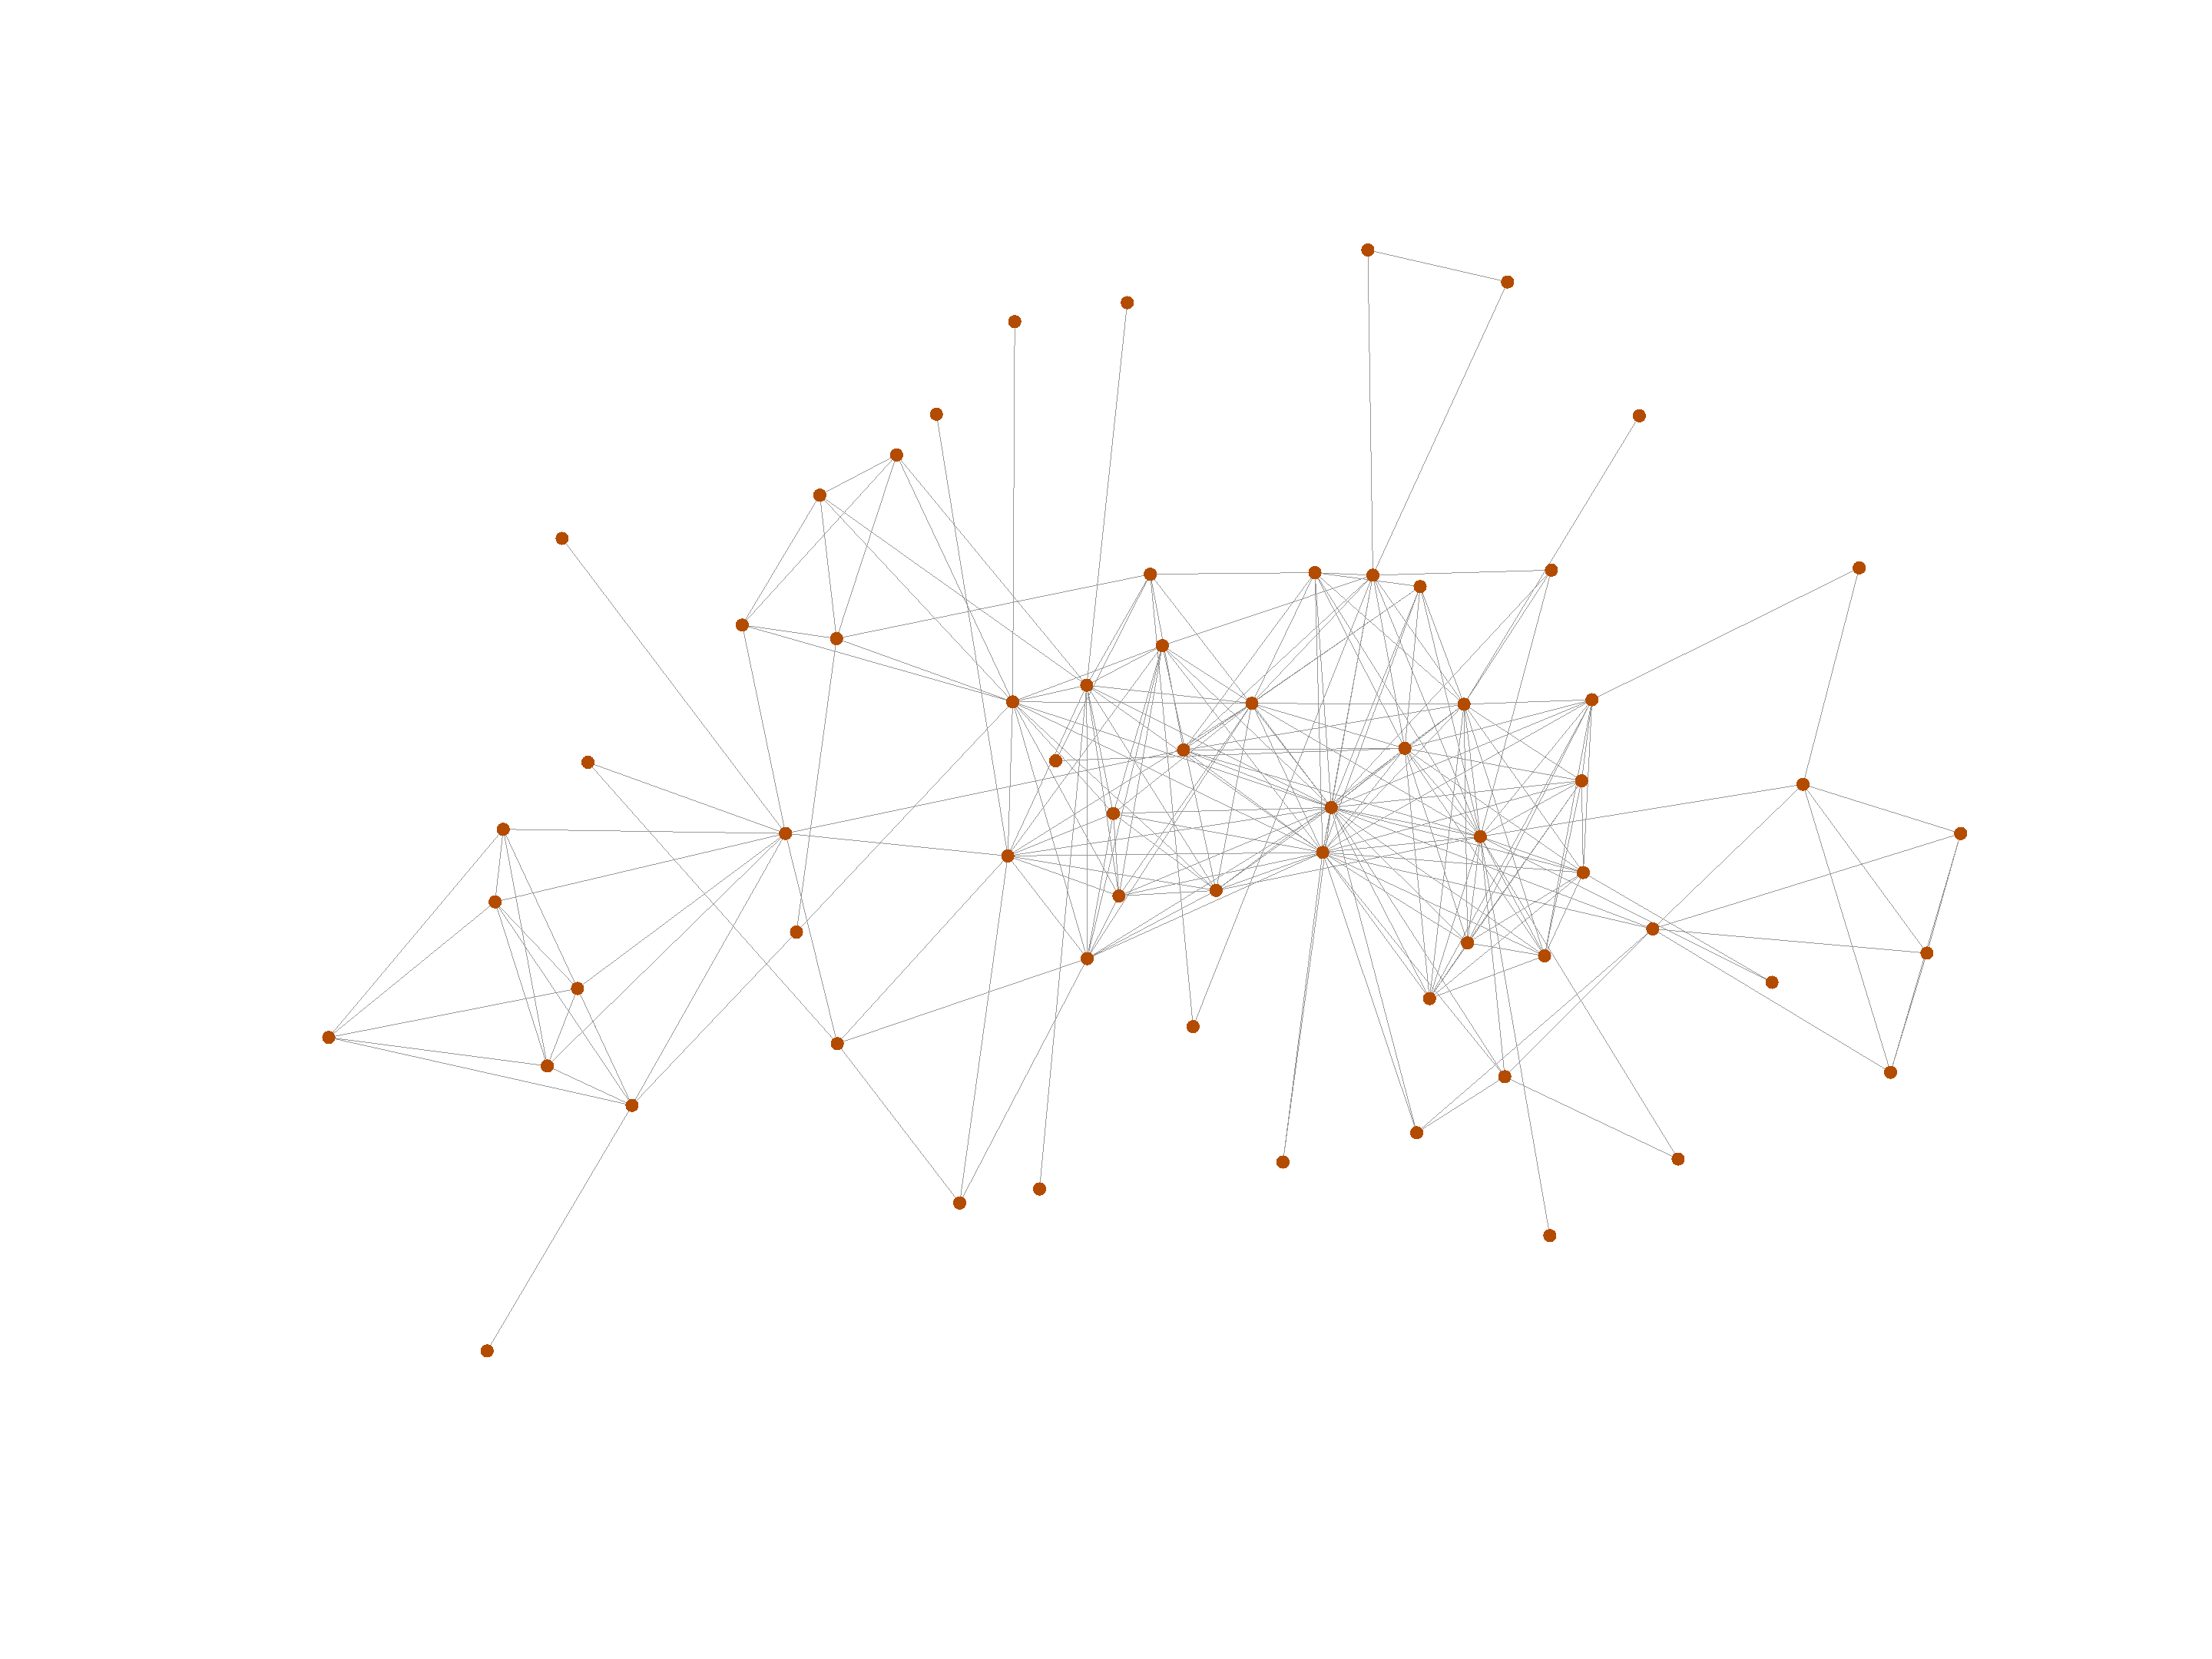
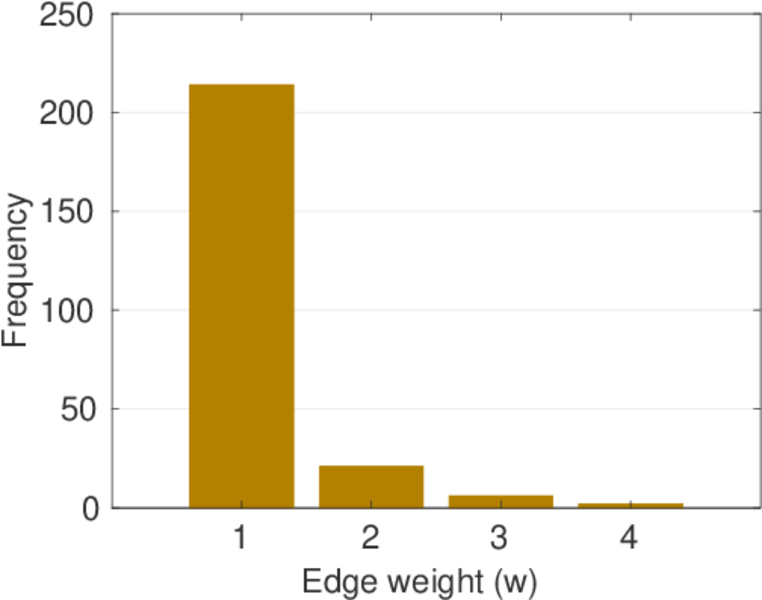
This undirected network contains contacts between suspected terrorists involved in the train bombing of Madrid on March 11, 2004 as reconstructed from newspapers. A node represents a terrorist and an edge between two terrorists shows that there was a contact between the two terroists. The edge weights denote how 'strong' a connection was. This includes friendship and co-participating in training camps or previous attacks.

Metadata

CodeMt
Internal namemoreno_train
NameTrain bombing
Data sourcehttp://moreno.ss.uci.edu/data.html#train
AvailabilityDataset is available for download
Consistency checkDataset passed all tests
Category
Human social network
Node meaningTerrorist
Edge meaningContact
Network formatUnipartite, undirected
Edge typePositive weights, no multiple edges
LoopsDoes not contain loops

Statistics

Size n =64
Volume m =243
Loop count l =0
Wedge count s =2,818
Claw count z =14,360
Cross count x =65,267
Triangle count t =527
Square count q =3,672
4-Tour count T4 =41,134
Maximum degree dmax =29
Average degree d =7.593 75
Fill p =0.120 536
Size of LCC N =64
Diameter δ =6
50-Percentile effective diameter δ0.5 =2.087 61
90-Percentile effective diameter δ0.9 =3.631 38
Median distance δM =3
Mean distance δm =2.627 49
Gini coefficient G =0.428 305
Balanced inequality ratio P =0.329 218
Relative edge distribution entropy Her =0.926 924
Power law exponent γ =1.602 90
Tail power law exponent γt =4.041 00
Tail power law exponent with p γ3 =4.041 00
p-value p =0.817 000
Degree assortativity ρ =+0.029 464 6
Degree assortativity p-value pρ =0.516 967
Clustering coefficient c =0.561 036
Spectral norm α =19.486 3
Algebraic connectivity a =0.332 207
Spectral separation 1[A] / λ2[A]| =2.162 47
Non-bipartivity bA =0.655 074
Normalized non-bipartivity bN =0.454 523
Algebraic non-bipartivity χ =0.831 432
Spectral bipartite frustration bK =0.027 372 3
Controllability C =2
Relative controllability Cr =0.031 250 0

Plots

Fruchterman–Reingold graph drawing

Degree distribution

Cumulative degree distribution

Lorenz curve

Spectral distribution of the adjacency matrix

Spectral distribution of the normalized adjacency matrix

Spectral distribution of the Laplacian

Spectral graph drawing based on the adjacency matrix

Spectral graph drawing based on the Laplacian

Spectral graph drawing based on the normalized adjacency matrix

Degree assortativity

Zipf plot

Hop distribution

Double Laplacian graph drawing

Delaunay graph drawing

Edge weight/multiplicity distribution

Clustering coefficient distribution

Average neighbor degree distribution

SynGraphy

Matrix decompositions plots

Downloads

References

[1] Jérôme Kunegis. KONECT – The Koblenz Network Collection. In Proc. Int. Conf. on World Wide Web Companion, pages 1343–1350, 2013. [ http ]
[2] Brian Hayes. Connecting the dots. can the tools of graph theory and social-network studies unravel the next big plot? Am. Scientist, 94(5):400–404, 2006.